Context-Switch: DTrace Workshop 2006
Workshop slides for a 4-day Context-Switch class in London by Brendan Gregg.PDF: CS2006_dtrace_workshop_slides.pdf
Keywords (from pdftotext):
slide 1:
DTrace Workshop
Context-Switch presents,
DTrace on Solaris 10
London, June, 2006
Brendan Gregg
slide 2:
This document has been provided on an “as is” basis, WITHOUT WARRANTY OF ANY KIND, either
expressed or implied, without even the implied warranty of merchantability or fitness for a particular
purpose. This document could include technical inaccuracies, typographical errors and even spelling errors
(or at the very least, Australian spelling).
Various content, including diagrams and material from the DTraceToolkit, are copyright © 2006 by
Brendan Gregg.
This document was NOT written by Sun Microsystems, and opinions expressed are not those of Sun
Microsystems unless by coincidence.
slide 3:
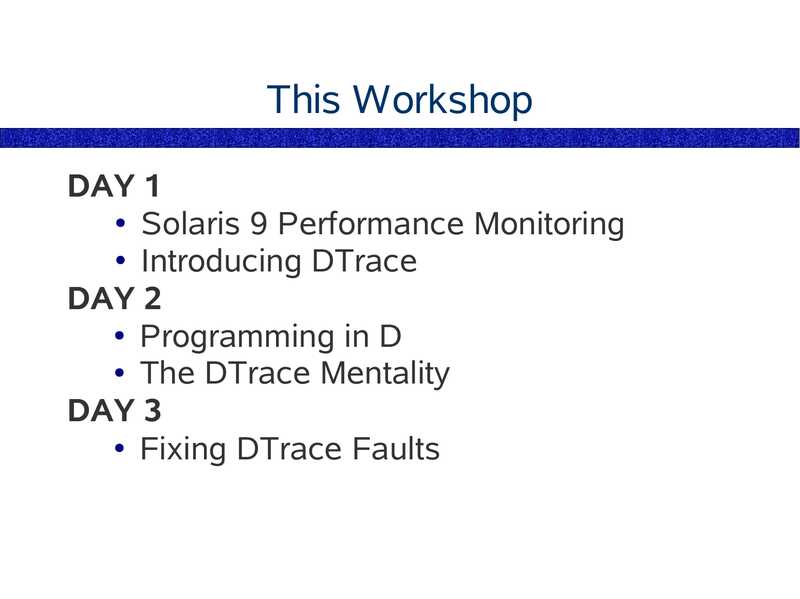
This Workshop
DAY 1
● Solaris 9 Performance Monitoring
● Introducing DTrace
DAY 2
● Programming in D
● The DTrace Mentality
DAY 3
● Fixing DTrace Faults
slide 4:
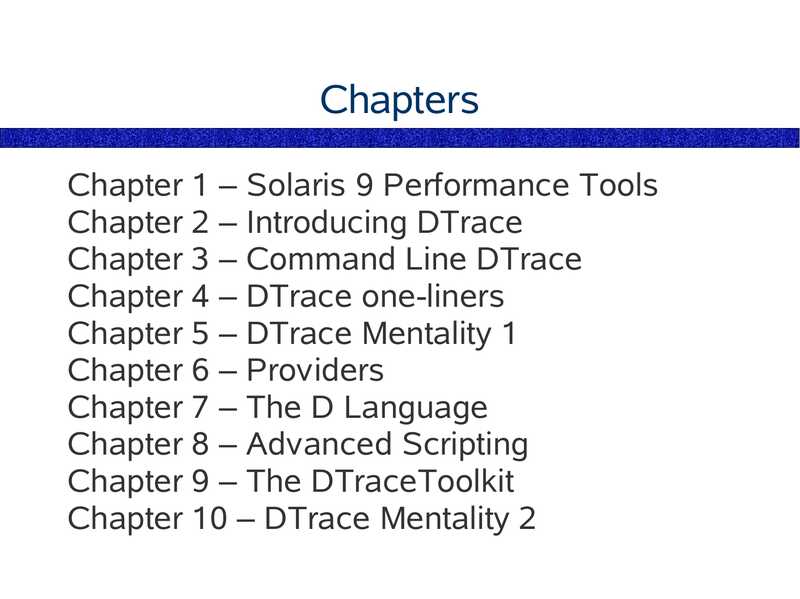
Chapters
Chapter 1 – Solaris 9 Performance Tools
Chapter 2 – Introducing DTrace
Chapter 3 – Command Line DTrace
Chapter 4 – DTrace one-liners
Chapter 5 – DTrace Mentality 1
Chapter 6 – Providers
Chapter 7 – The D Language
Chapter 8 – Advanced Scripting
Chapter 9 – The DTraceToolkit
Chapter 10 – DTrace Mentality 2
slide 5:
References
Some topics presented are based on,
Solaris Performance and Tools: DTrace
and MDB Techniques for Solaris 10 and
OpenSolaris (McDougall/Mauro/Gregg)
slide 6:
Slides
These slides cover key topics
I will cover many side topics, elaborate
further, answer questions, run demos, ...
as such, when I deviate from the slides –
don't panic! It's part of the course.
slide 7:
Chapter 1
Solaris 9 Performance Monitoring
What can be observed
● What can't be observed
● Key DTrace wins
● Start here
slide 8:
Example Fault
Where has my CPU gone?
using Solaris 9 tools
... interactive demo ...
slide 9:
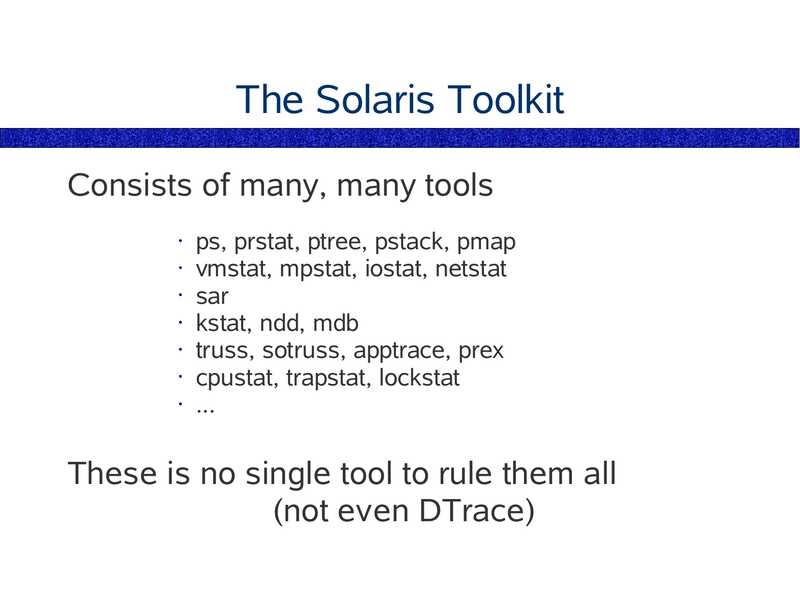
The Solaris Toolkit
Consists of many, many tools
ps, prstat, ptree, pstack, pmap
• vmstat, mpstat, iostat, netstat
• sar
• kstat, ndd, mdb
• truss, sotruss, apptrace, prex
• cpustat, trapstat, lockstat
• ...
These is no single tool to rule them all
(not even DTrace)
slide 10:
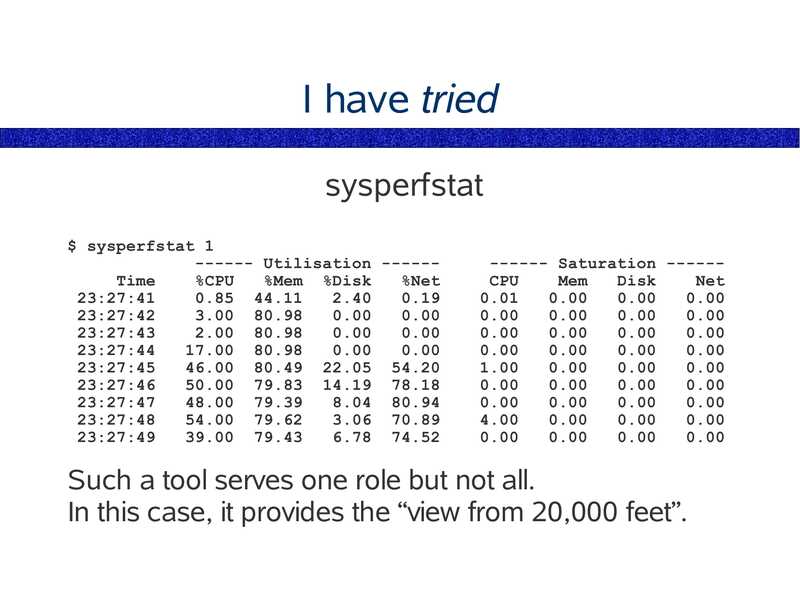
I have tried
sysperfstat
$ sysperfstat 1
------ Utilisation -----Time
%CPU
%Mem %Disk
%Net
23:27:41
0.85 44.11
23:27:42
3.00 80.98
23:27:43
2.00 80.98
23:27:44
17.00 80.98
23:27:45
46.00 80.49 22.05 54.20
23:27:46
50.00 79.83 14.19 78.18
23:27:47
48.00 79.39
8.04 80.94
23:27:48
54.00 79.62
3.06 70.89
23:27:49
39.00 79.43
6.78 74.52
------ Saturation -----CPU
Mem
Disk
Net
Such a tool serves one role but not all.
In this case, it provides the “view from 20,000 feet”.
slide 11:
Coping With Many Tools
Categorise by Approach
● Categorise by Resource Type
Checklists of tools (these slides)
Study some, be aware what else exists
just remembering that something is doable is valuable!
slide 12:
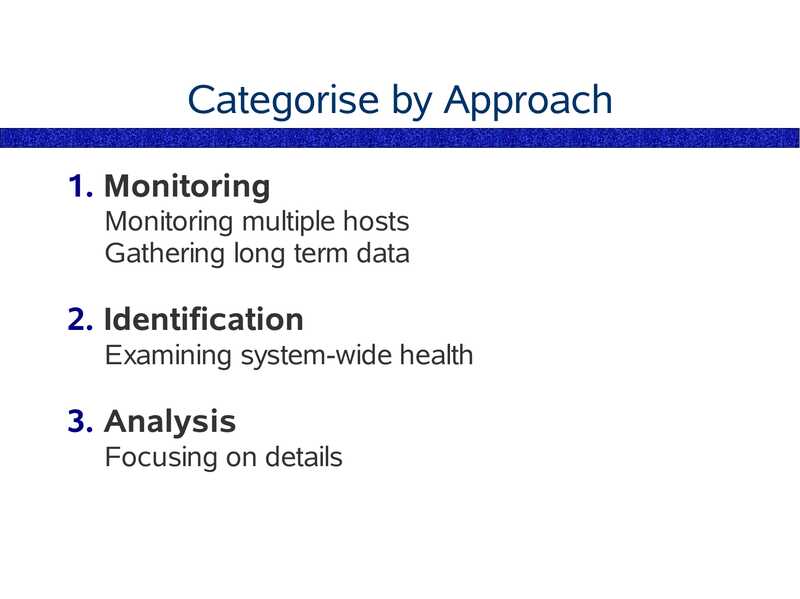
Categorise by Approach
1. Monitoring
Monitoring multiple hosts
Gathering long term data
2. Identification
Examining system-wide health
3. Analysis
Focusing on details
slide 13:
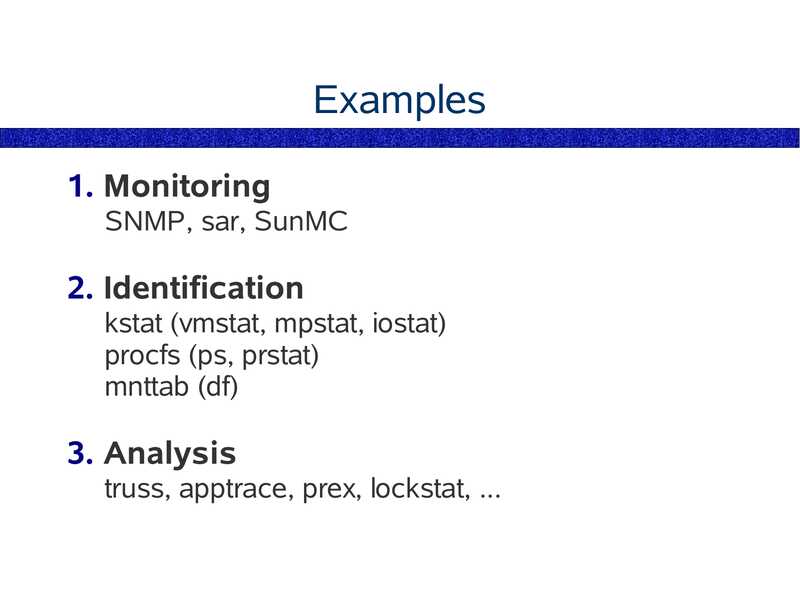
Examples
1. Monitoring
SNMP, sar, SunMC
2. Identification
kstat (vmstat, mpstat, iostat)
procfs (ps, prstat)
mnttab (df)
3. Analysis
truss, apptrace, prex, lockstat, ...
slide 14:
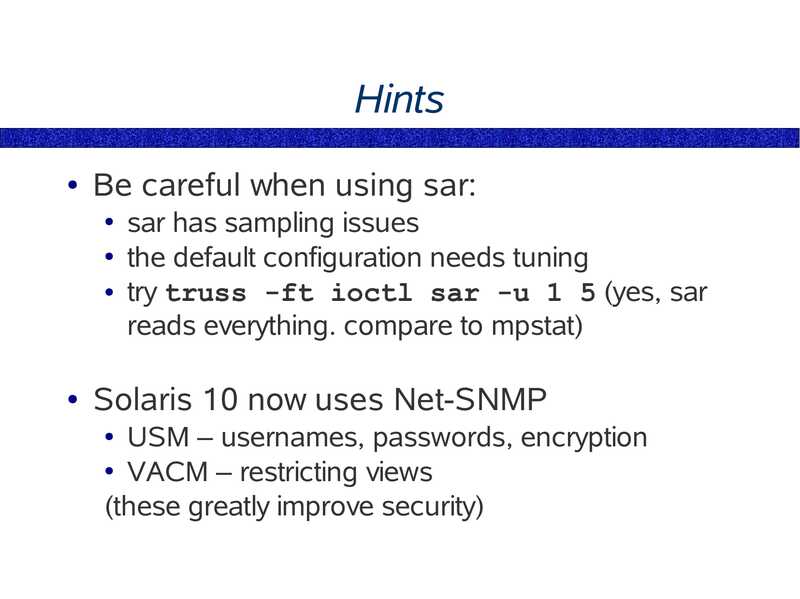
Hints
Be careful when using sar:
sar has sampling issues
● the default configuration needs tuning
● try truss -ft ioctl sar -u 1 5 (yes, sar
reads everything. compare to mpstat)
Solaris 10 now uses Net-SNMP
USM – usernames, passwords, encryption
● VACM – restricting views
(these greatly improve security)
slide 15:
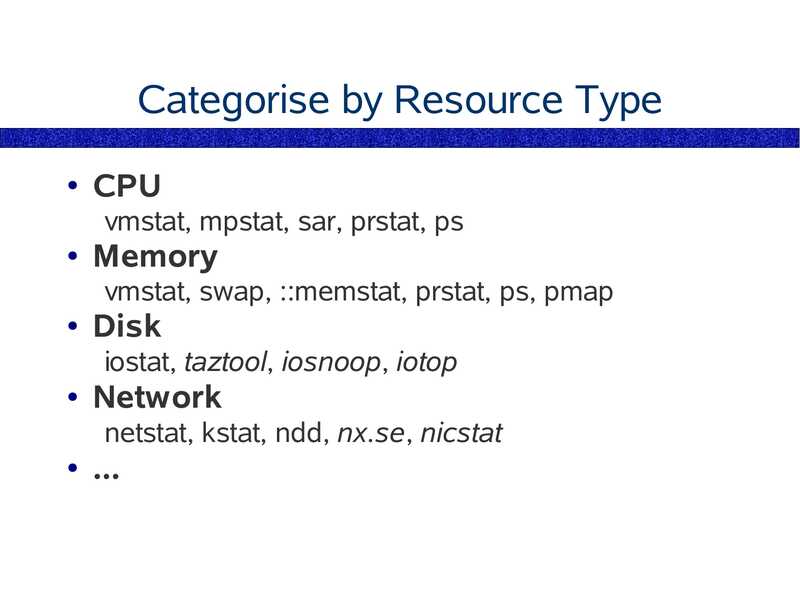
Categorise by Resource Type
CPU
vmstat, mpstat, sar, prstat, ps
Memory
vmstat, swap, ::memstat, prstat, ps, pmap
Disk
iostat, taztool, iosnoop, iotop
Network
netstat, kstat, ndd, nx.se, nicstat
slide 16:
Tools Checklist
The following list of tools serves to:
• provide a checklist
• show what is doable – you'll remember later
• show what can be done – the right tool for
the job
• show what can't be done – where DTrace
can help
• provide starting points for using DTrace
slide 17:
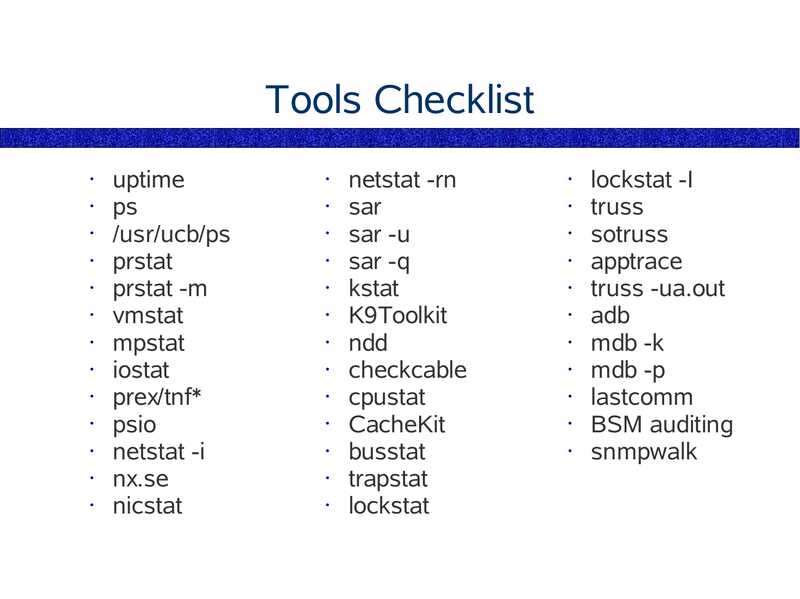
Tools Checklist
uptime
/usr/ucb/ps
prstat
prstat -m
vmstat
mpstat
iostat
prex/tnf*
psio
netstat -i
nx.se
nicstat
netstat -rn
sar
sar -u
sar -q
kstat
K9Toolkit
ndd
checkcable
cpustat
CacheKit
busstat
trapstat
lockstat
lockstat -I
truss
sotruss
apptrace
truss -ua.out
adb
mdb -k
mdb -p
lastcomm
BSM auditing
snmpwalk
slide 18:
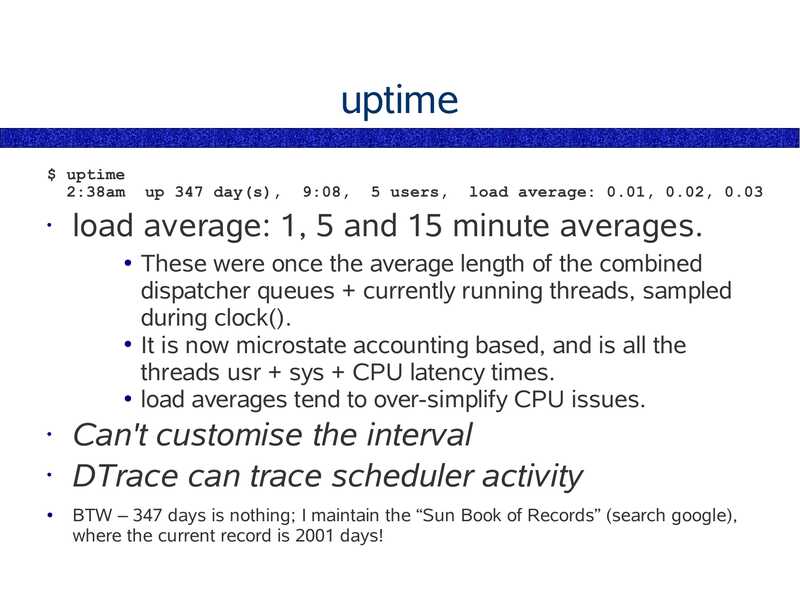
uptime
$ uptime
2:38am
up 347 day(s),
9:08,
5 users,
load average: 0.01, 0.02, 0.03
load average: 1, 5 and 15 minute averages.
These were once the average length of the combined
dispatcher queues + currently running threads, sampled
during clock().
● It is now microstate accounting based, and is all the
threads usr + sys + CPU latency times.
● load averages tend to over-simplify CPU issues.
Can't customise the interval
• DTrace can trace scheduler activity
BTW – 347 days is nothing; I maintain the “Sun Book of Records” (search google),
where the current record is 2001 days!
slide 19:
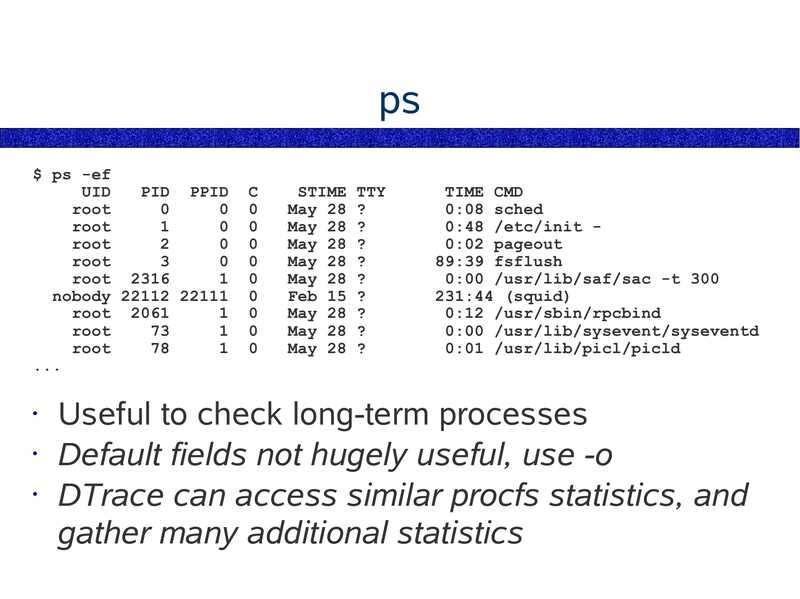
$ ps -ef
UID
PID PPID
root
root
root
root
root 2316
nobody 22112 22111
root 2061
root
root
STIME TTY
May 28 ?
May 28 ?
May 28 ?
May 28 ?
May 28 ?
Feb 15 ?
May 28 ?
May 28 ?
May 28 ?
TIME CMD
0:08 sched
0:48 /etc/init 0:02 pageout
89:39 fsflush
0:00 /usr/lib/saf/sac -t 300
231:44 (squid)
0:12 /usr/sbin/rpcbind
0:00 /usr/lib/sysevent/syseventd
0:01 /usr/lib/picl/picld
Useful to check long-term processes
• Default fields not hugely useful, use -o
• DTrace can access similar procfs statistics, and
gather many additional statistics
slide 20:
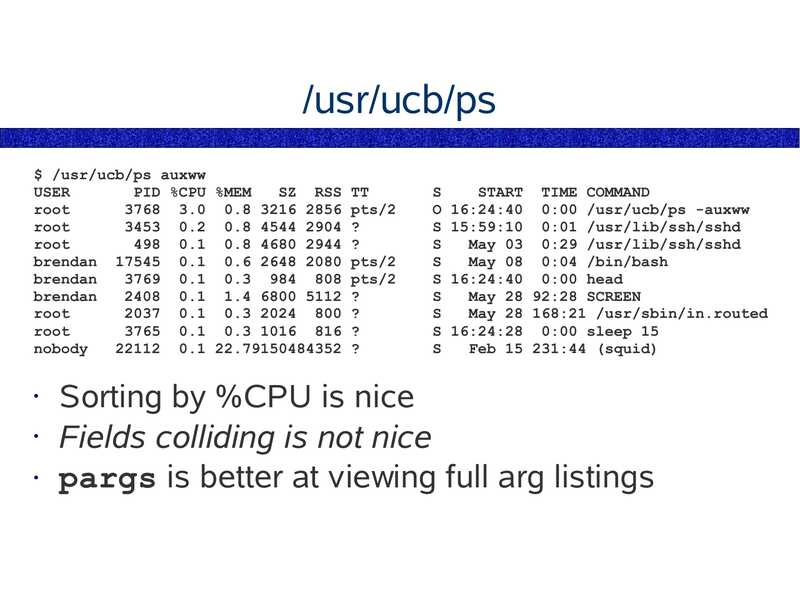
/usr/ucb/ps
$ /usr/ucb/ps auxww
USER
PID %CPU %MEM
SZ RSS TT
root
3768 3.0 0.8 3216 2856 pts/2
root
3453 0.2 0.8 4544 2904 ?
root
498 0.1 0.8 4680 2944 ?
brendan 17545 0.1 0.6 2648 2080 pts/2
brendan
3769 0.1 0.3 984 808 pts/2
brendan
2408 0.1 1.4 6800 5112 ?
root
2037 0.1 0.3 2024 800 ?
root
3765 0.1 0.3 1016 816 ?
nobody
22112 0.1 22.79150484352 ?
START TIME COMMAND
O 16:24:40 0:00 /usr/ucb/ps -auxww
S 15:59:10 0:01 /usr/lib/ssh/sshd
May 03 0:29 /usr/lib/ssh/sshd
May 08 0:04 /bin/bash
S 16:24:40 0:00 head
May 28 92:28 SCREEN
May 28 168:21 /usr/sbin/in.routed
S 16:24:28 0:00 sleep 15
Feb 15 231:44 (squid)
Sorting by %CPU is nice
• Fields colliding is not nice
• pargs is better at viewing full arg listings
slide 21:
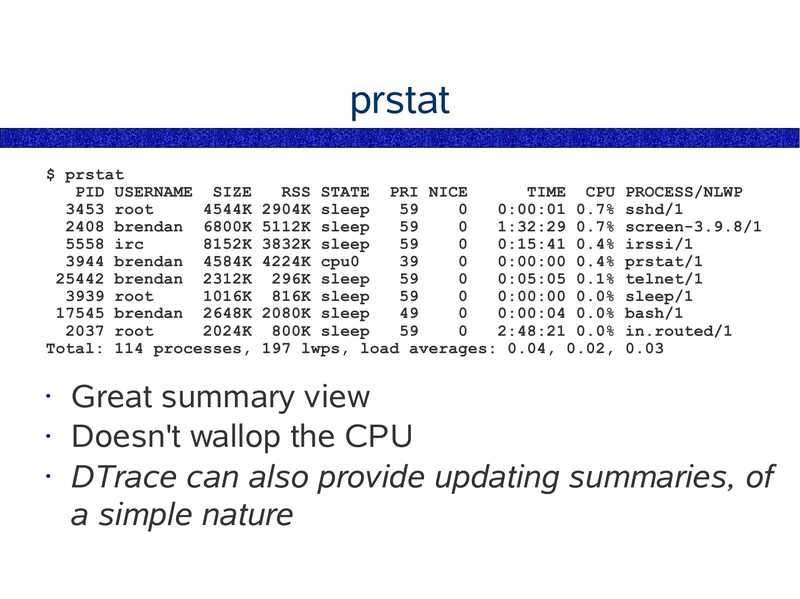
prstat
$ prstat
PID USERNAME SIZE
RSS STATE PRI NICE
TIME CPU PROCESS/NLWP
3453 root
4544K 2904K sleep
0:00:01 0.7% sshd/1
2408 brendan 6800K 5112K sleep
1:32:29 0.7% screen-3.9.8/1
5558 irc
8152K 3832K sleep
0:15:41 0.4% irssi/1
3944 brendan 4584K 4224K cpu0
0:00:00 0.4% prstat/1
25442 brendan 2312K 296K sleep
0:05:05 0.1% telnet/1
3939 root
1016K 816K sleep
0:00:00 0.0% sleep/1
17545 brendan 2648K 2080K sleep
0:00:04 0.0% bash/1
2037 root
2024K 800K sleep
2:48:21 0.0% in.routed/1
Total: 114 processes, 197 lwps, load averages: 0.04, 0.02, 0.03
Great summary view
• Doesn't wallop the CPU
• DTrace can also provide updating summaries, of
a simple nature
slide 22:
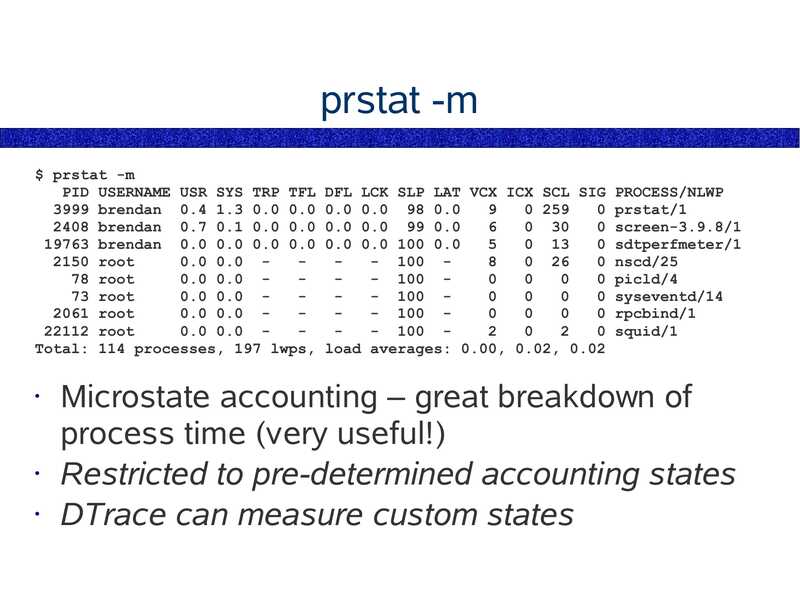
prstat -m
$ prstat -m
PID USERNAME USR SYS TRP TFL DFL LCK SLP LAT VCX ICX SCL SIG PROCESS/NLWP
3999 brendan 0.4 1.3 0.0 0.0 0.0 0.0 98 0.0
0 259
0 prstat/1
2408 brendan 0.7 0.1 0.0 0.0 0.0 0.0 99 0.0
0 30
0 screen-3.9.8/1
19763 brendan 0.0 0.0 0.0 0.0 0.0 0.0 100 0.0
0 13
0 sdtperfmeter/1
2150 root
0.0 0.0 - 100 8
0 26
0 nscd/25
78 root
0.0 0.0 - 100 0
0 picld/4
73 root
0.0 0.0 - 100 0
0 syseventd/14
2061 root
0.0 0.0 - 100 0
0 rpcbind/1
22112 root
0.0 0.0 - 100 2
0 squid/1
Total: 114 processes, 197 lwps, load averages: 0.00, 0.02, 0.02
Microstate accounting – great breakdown of
process time (very useful!)
• Restricted to pre-determined accounting states
• DTrace can measure custom states
slide 23:
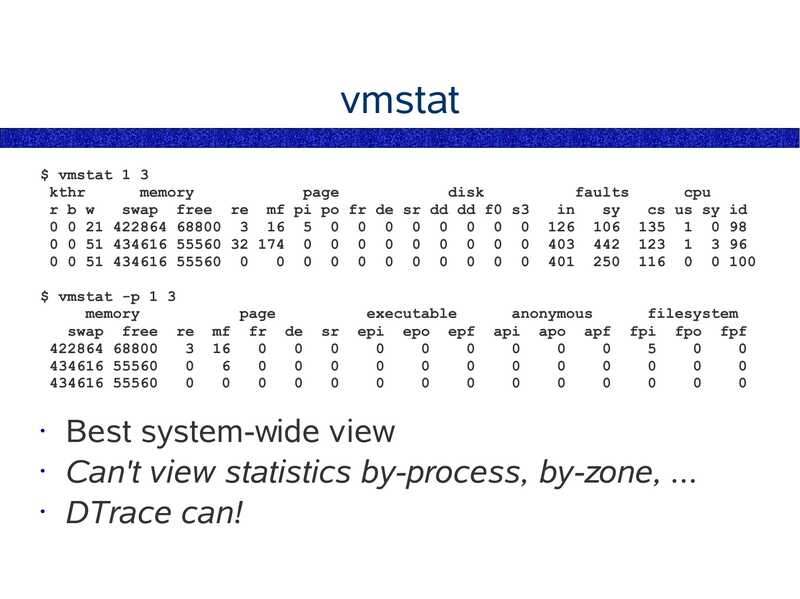
vmstat
$ vmstat 1 3
kthr
memory
page
disk
r b w
swap free re mf pi po fr de sr dd dd f0 s3
0 0 21 422864 68800 3 16 5 0 0 0 0 0 0 0 0
0 0 51 434616 55560 32 174 0 0 0 0 0 0 0 0 0
0 0 51 434616 55560 0
0 0 0 0 0 0 0 0 0 0
$ vmstat -p 1 3
memory
swap free re
422864 68800
434616 55560
434616 55560
page
mf fr de
executable
epi epo epf
faults
cpu
cs us sy id
126 106 135 1 0 98
403 442 123 1 3 96
401 250 116 0 0 100
anonymous
api apo apf
filesystem
fpi fpo fpf
Best system-wide view
• Can't view statistics by-process, by-zone, ...
• DTrace can!
slide 24:
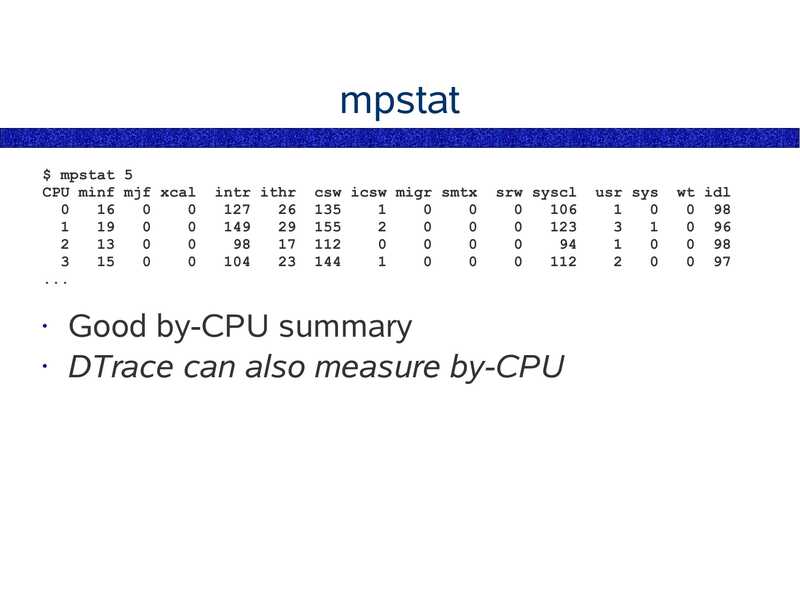
mpstat
$ mpstat 5
CPU minf mjf xcal
intr ithr
csw icsw migr smtx
srw syscl
Good by-CPU summary
• DTrace can also measure by-CPU
usr sys
wt idl
0 98
0 96
0 98
0 97
slide 25:
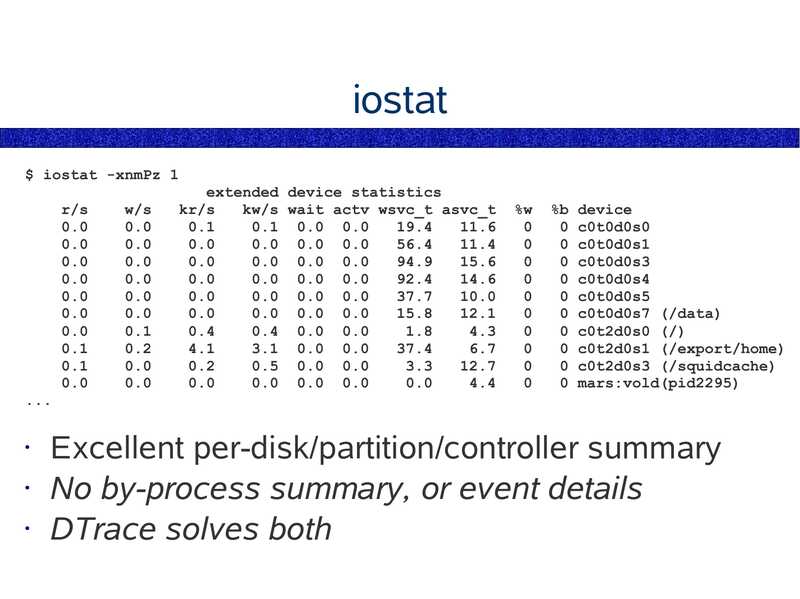
iostat
$ iostat -xnmPz 1
r/s
w/s
extended device statistics
kr/s
kw/s wait actv wsvc_t asvc_t
0.1 0.0 0.0
0.0 0.0 0.0
0.0 0.0 0.0
0.0 0.0 0.0
0.0 0.0 0.0
0.0 0.0 0.0
0.4 0.0 0.0
3.1 0.0 0.0
0.5 0.0 0.0
0.0 0.0 0.0
%b device
0 c0t0d0s0
0 c0t0d0s1
0 c0t0d0s3
0 c0t0d0s4
0 c0t0d0s5
0 c0t0d0s7 (/data)
0 c0t2d0s0 (/)
0 c0t2d0s1 (/export/home)
0 c0t2d0s3 (/squidcache)
0 mars:vold(pid2295)
Excellent per-disk/partition/controller summary
• No by-process summary, or event details
• DTrace solves both
slide 26:
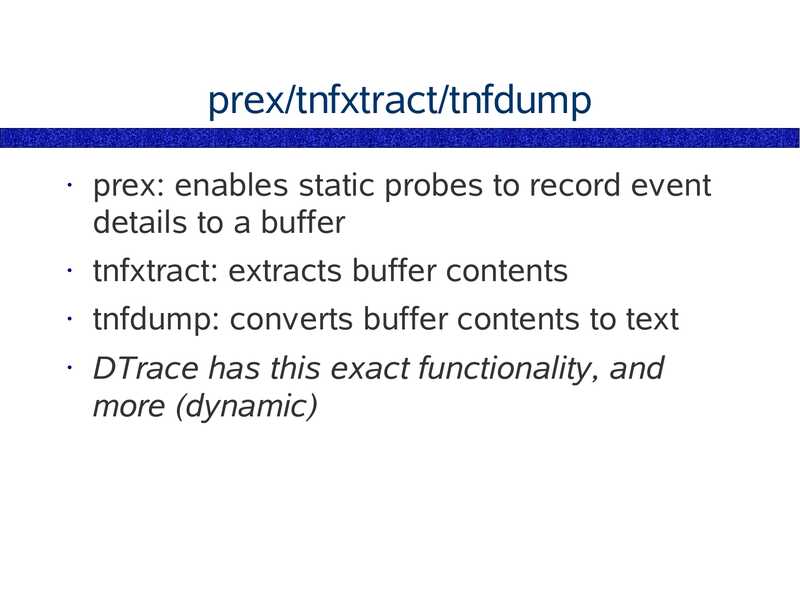
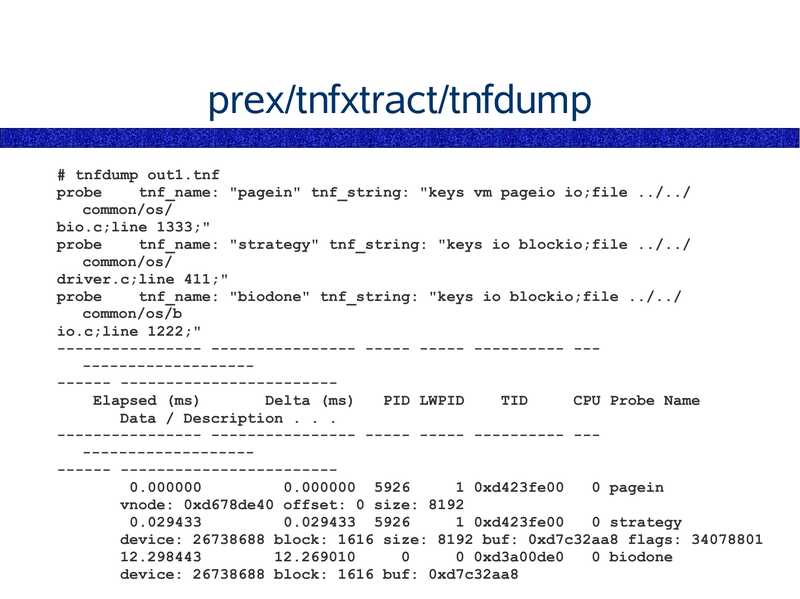
prex/tnfxtract/tnfdump
prex: enables static probes to record event
details to a buffer
tnfxtract: extracts buffer contents
tnfdump: converts buffer contents to text
DTrace has this exact functionality, and
more (dynamic)
slide 27:
prex/tnfxtract/tnfdump
# tnfdump out1.tnf
probe
tnf_name: "pagein" tnf_string: "keys vm pageio io;file ../../
common/os/
bio.c;line 1333;"
probe
tnf_name: "strategy" tnf_string: "keys io blockio;file ../../
common/os/
driver.c;line 411;"
probe
tnf_name: "biodone" tnf_string: "keys io blockio;file ../../
common/os/b
io.c;line 1222;"
---------------- ---------------- ----- ----- ---------- -------------------------- -----------------------Elapsed (ms)
Delta (ms)
PID LWPID
TID
CPU Probe Name
Data / Description . . .
---------------- ---------------- ----- ----- ---------- -------------------------- -----------------------0.000000
0.000000 5926
1 0xd423fe00
0 pagein
vnode: 0xd678de40 offset: 0 size: 8192
0.029433 5926
1 0xd423fe00
0 strategy
device: 26738688 block: 1616 size: 8192 buf: 0xd7c32aa8 flags: 34078801
0 0xd3a00de0
0 biodone
device: 26738688 block: 1616 buf: 0xd7c32aa8
slide 28:
psio
# ./psio 1
UID
PID PPID %I/O
STIME TTY
brendan 13271 10093 65.4 23:20:16 pts/20
root
0 0.0
Mar 16 ?
root
0 0.0
Mar 16 ?
root
0 0.0
Mar 16 ?
TIME CMD
0:01 grep brendan contents
0:16 sched
0:10 /etc/init 0:00 pageout
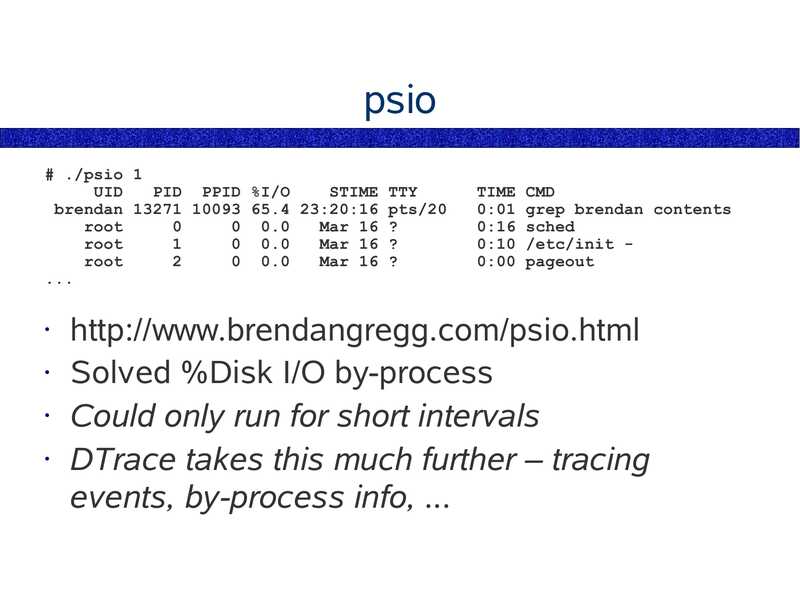
http://www.brendangregg.com/psio.html
• Solved %Disk I/O by-process
• Could only run for short intervals
• DTrace takes this much further – tracing
events, by-process info, ...
slide 29:
netstat -i
$ netstat -i 1 5
input
hme0
output
packets errs packets errs colls
206999694 32
223490272 0
input (Total)
output
packets errs packets errs colls
326931321 32
343421899 0
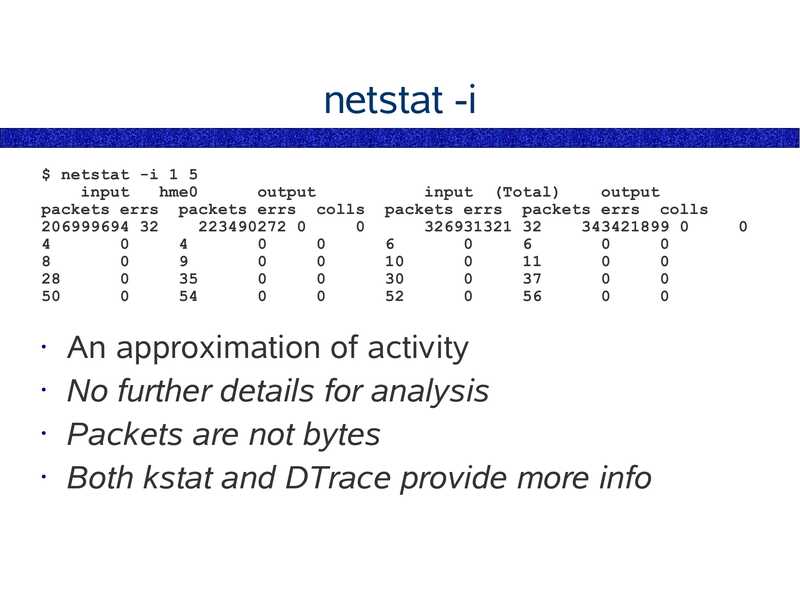
An approximation of activity
• No further details for analysis
• Packets are not bytes
• Both kstat and DTrace provide more info
slide 30:
nx.se
$ se nx.se 1
Current tcp RtoMin is 400, interval 1, start Thu May 11 18:22:37 2006
18:22:38 Iseg/s Oseg/s InKB/s OuKB/s Rst/s Atf/s Ret% Icn/s Ocn/s
tcp
Name
Ipkt/s Opkt/s InKB/s OuKB/s IErr/s OErr/s Coll% NoCP/s Defr/s
hme0
0.34 0.000 0.000
18:22:39 Iseg/s Oseg/s InKB/s OuKB/s Rst/s Atf/s Ret% Icn/s Ocn/s
tcp
Name
Ipkt/s Opkt/s InKB/s OuKB/s IErr/s OErr/s Coll% NoCP/s Defr/s
hme0
0.34 0.000 0.000
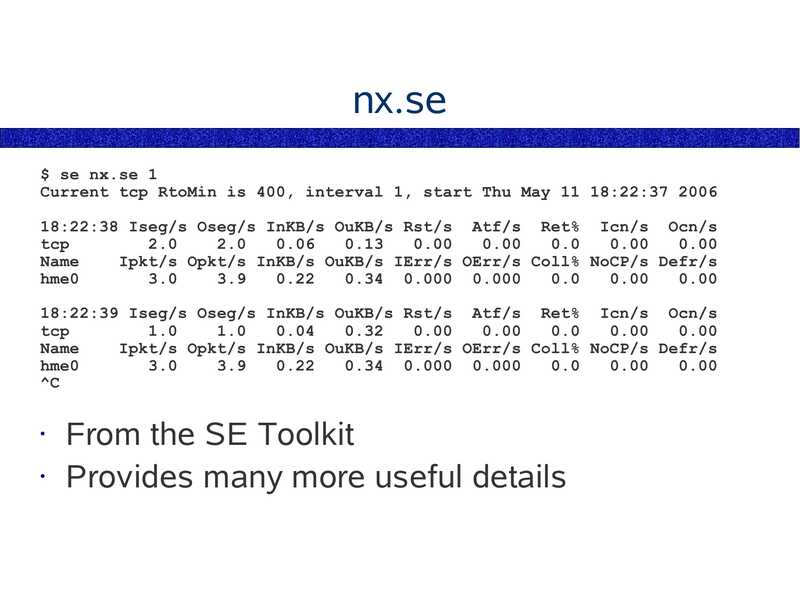
From the SE Toolkit
• Provides many more useful details
slide 31:
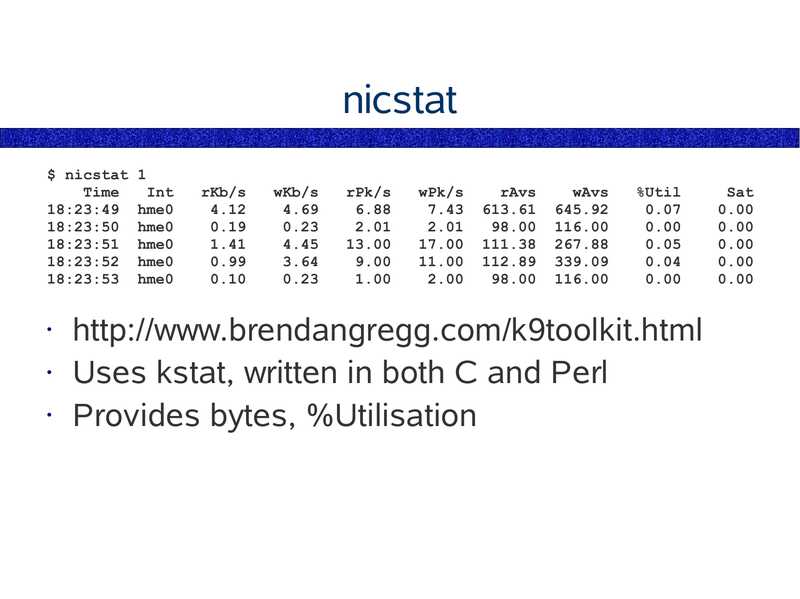
nicstat
$ nicstat 1
Time
Int
18:23:49 hme0
18:23:50 hme0
18:23:51 hme0
18:23:52 hme0
18:23:53 hme0
rKb/s
wKb/s
rPk/s
wPk/s
rAvs
wAvs
%Util
http://www.brendangregg.com/k9toolkit.html
• Uses kstat, written in both C and Perl
• Provides bytes, %Utilisation
Sat
slide 32:
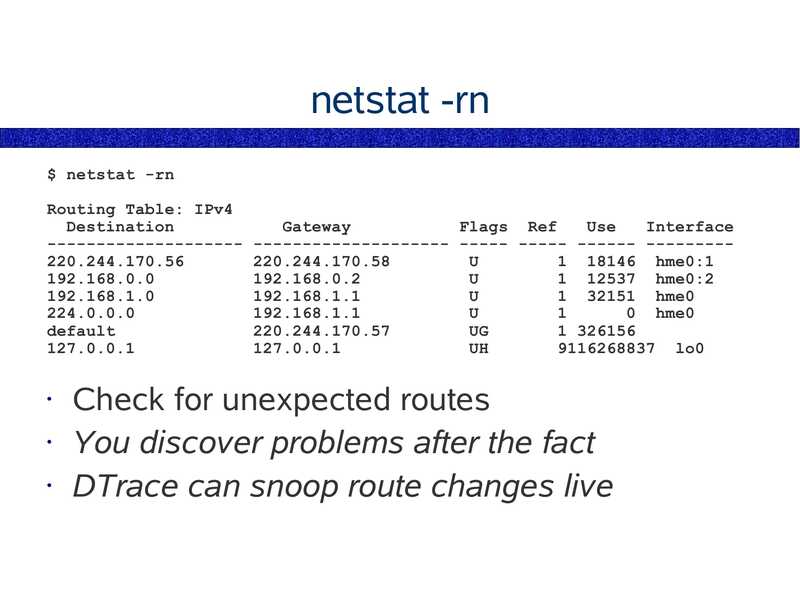
netstat -rn
$ netstat -rn
Routing Table: IPv4
Destination
Gateway
Flags Ref
Use
Interface
-------------------- -------------------- ----- ----- ------ --------220.244.170.56
1 18146 hme0:1
1 12537 hme0:2
1 32151 hme0
0 hme0
default
1 326156
9116268837 lo0
Check for unexpected routes
• You discover problems after the fact
• DTrace can snoop route changes live
slide 33:
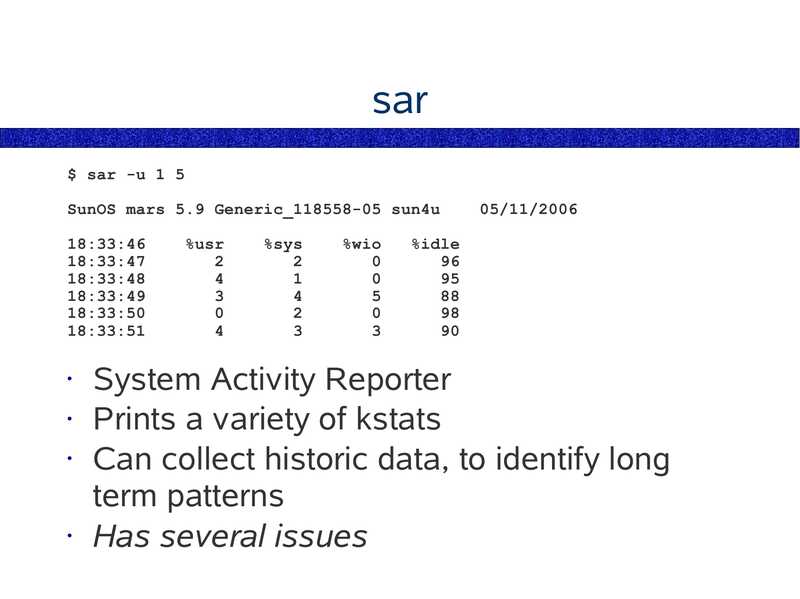
sar
$ sar -u 1 5
SunOS mars 5.9 Generic_118558-05 sun4u
18:33:46
18:33:47
18:33:48
18:33:49
18:33:50
18:33:51
%usr
%sys
%wio
05/11/2006
%idle
System Activity Reporter
• Prints a variety of kstats
• Can collect historic data, to identify long
term patterns
• Has several issues
slide 34:
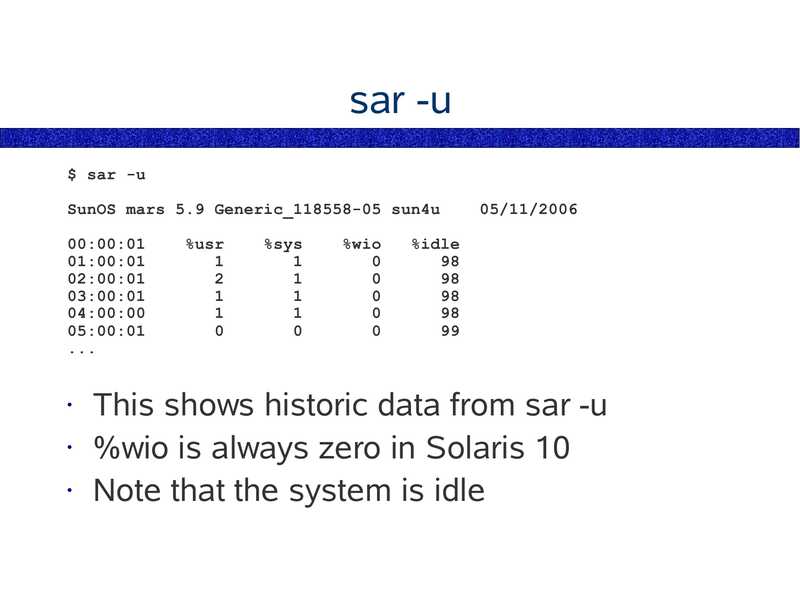
sar -u
$ sar -u
SunOS mars 5.9 Generic_118558-05 sun4u
00:00:01
01:00:01
02:00:01
03:00:01
04:00:00
05:00:01
%usr
%sys
%wio
05/11/2006
%idle
This shows historic data from sar -u
• %wio is always zero in Solaris 10
• Note that the system is idle
slide 35:
sar -q
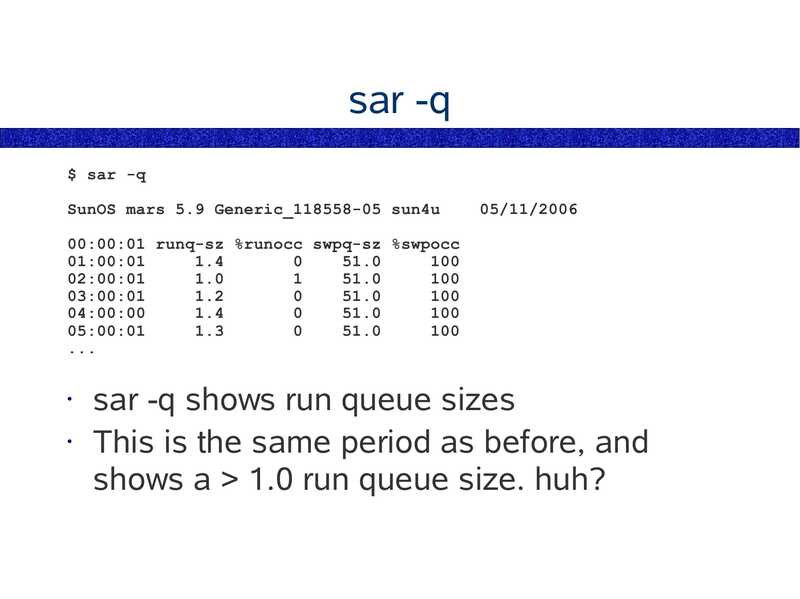
$ sar -q
SunOS mars 5.9 Generic_118558-05 sun4u
05/11/2006
00:00:01 runq-sz %runocc swpq-sz %swpocc
01:00:01
02:00:01
03:00:01
04:00:00
05:00:01
sar -q shows run queue sizes
• This is the same period as before, and
shows a >gt; 1.0 run queue size. huh?
slide 36:
kstat
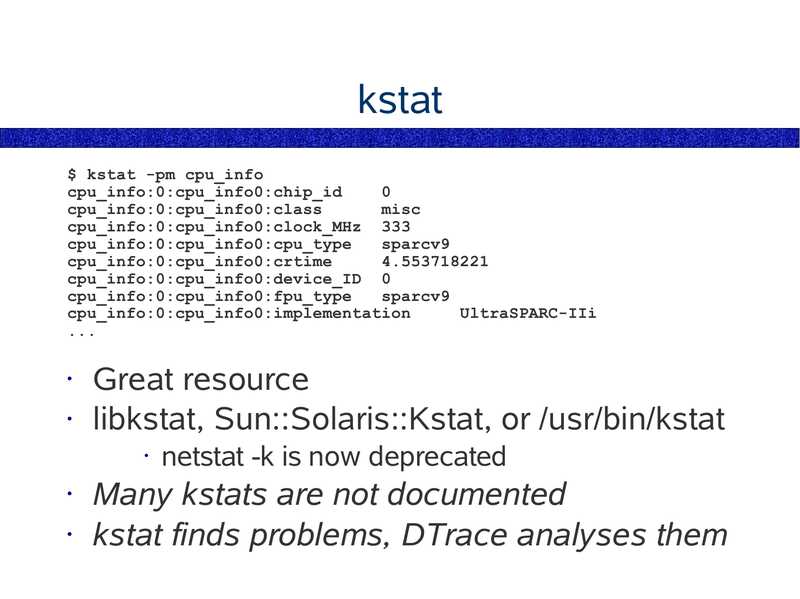
$ kstat -pm cpu_info
cpu_info:0:cpu_info0:chip_id
cpu_info:0:cpu_info0:class
misc
cpu_info:0:cpu_info0:clock_MHz 333
cpu_info:0:cpu_info0:cpu_type
sparcv9
cpu_info:0:cpu_info0:crtime
cpu_info:0:cpu_info0:device_ID 0
cpu_info:0:cpu_info0:fpu_type
sparcv9
cpu_info:0:cpu_info0:implementation
UltraSPARC-IIi
Great resource
• libkstat, Sun::Solaris::Kstat, or /usr/bin/kstat
netstat -k is now deprecated
Many kstats are not documented
• kstat finds problems, DTrace analyses them
slide 37:
K9Toolkit
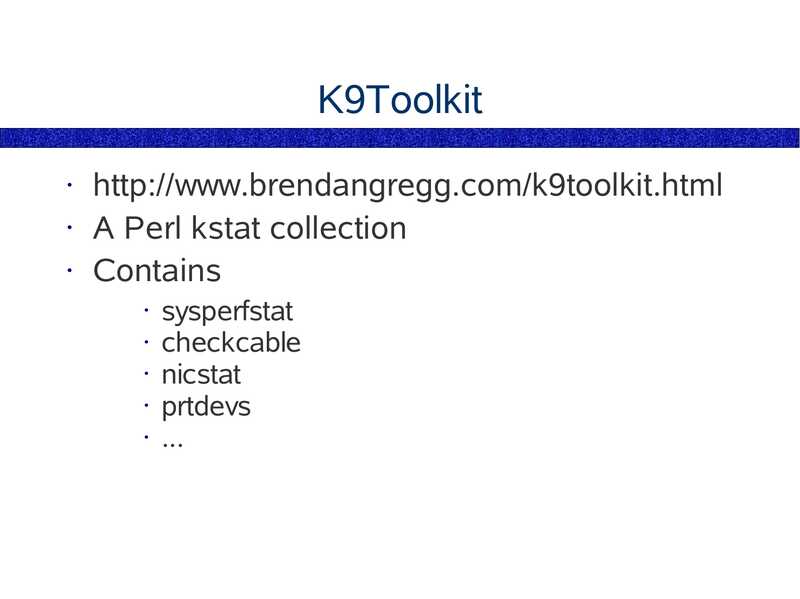
http://www.brendangregg.com/k9toolkit.html
• A Perl kstat collection
• Contains
sysperfstat
• checkcable
• nicstat
• prtdevs
• ...
slide 38:
ndd
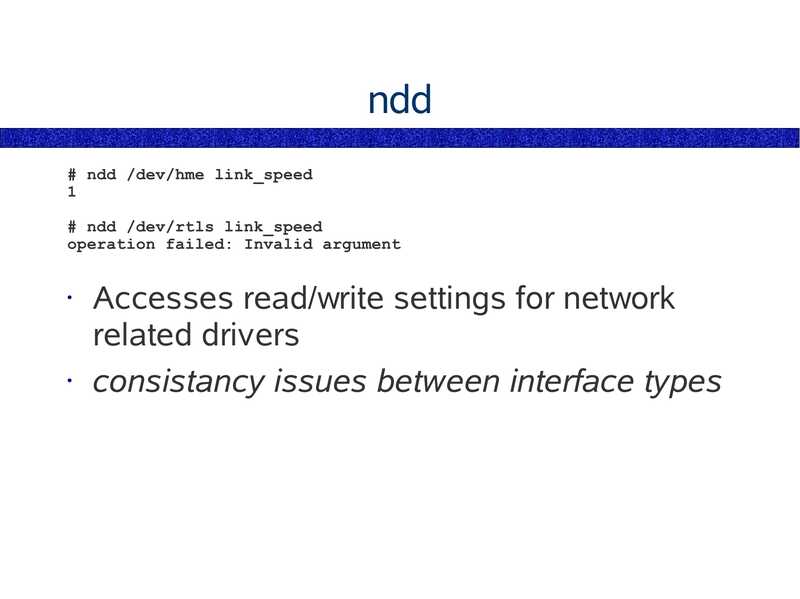
# ndd /dev/hme link_speed
# ndd /dev/rtls link_speed
operation failed: Invalid argument
Accesses read/write settings for network
related drivers
• consistancy issues between interface types
slide 39:
checkcable
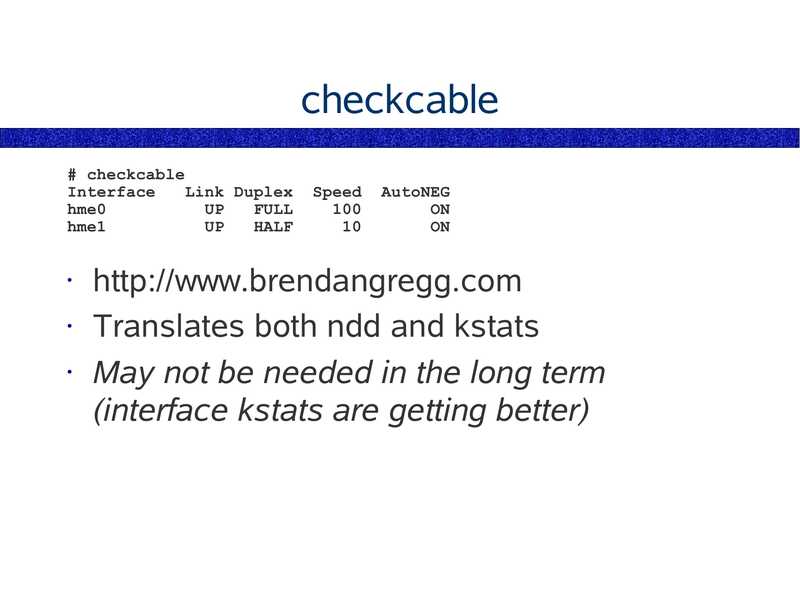
# checkcable
Interface
Link Duplex
hme0
FULL
hme1
HALF
Speed
AutoNEG
http://www.brendangregg.com
• Translates both ndd and kstats
• May not be needed in the long term
(interface kstats are getting better)
slide 40:
cpustat
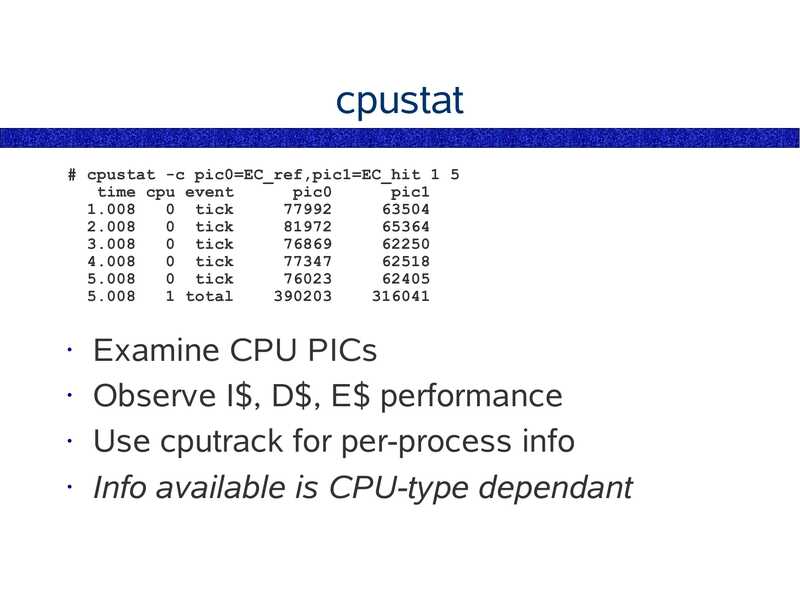
# cpustat -c pic0=EC_ref,pic1=EC_hit 1 5
time cpu event
pic0
pic1
0 tick
0 tick
0 tick
0 tick
0 tick
1 total
Examine CPU PICs
• Observe I$, D$, E$ performance
• Use cputrack for per-process info
• Info available is CPU-type dependant
slide 41:
CacheKit
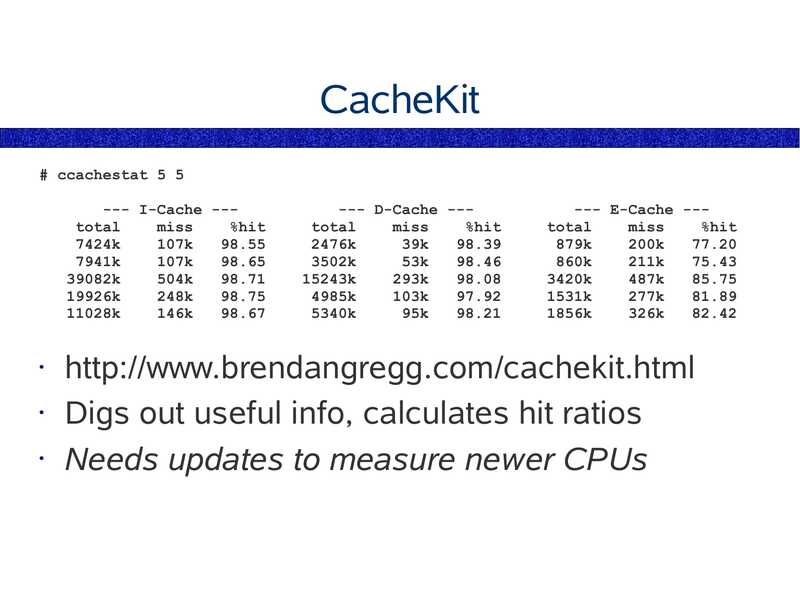
# ccachestat 5 5
--- I-Cache --total
miss
%hit
7424k
107k
7941k
107k
39082k
504k
19926k
248k
11028k
146k
--- D-Cache --total
miss
%hit
2476k
39k
3502k
53k
15243k
293k
4985k
103k
5340k
95k
--- E-Cache --total
miss
%hit
879k
200k
860k
211k
3420k
487k
1531k
277k
1856k
326k
http://www.brendangregg.com/cachekit.html
• Digs out useful info, calculates hit ratios
• Needs updates to measure newer CPUs
slide 42:
busstat
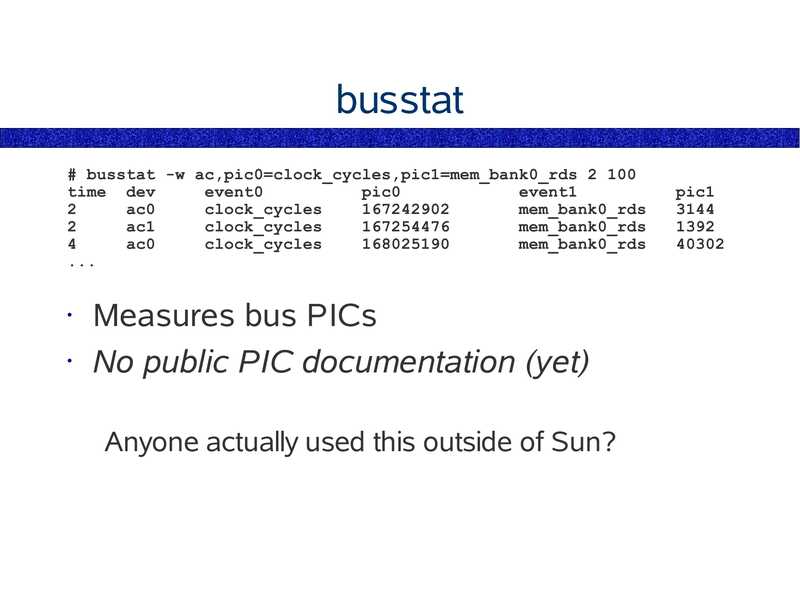
# busstat -w ac,pic0=clock_cycles,pic1=mem_bank0_rds 2 100
time dev
event0
pic0
event1
ac0
clock_cycles
mem_bank0_rds
ac1
clock_cycles
mem_bank0_rds
ac0
clock_cycles
mem_bank0_rds
Measures bus PICs
• No public PIC documentation (yet)
Anyone actually used this outside of Sun?
pic1
slide 43:
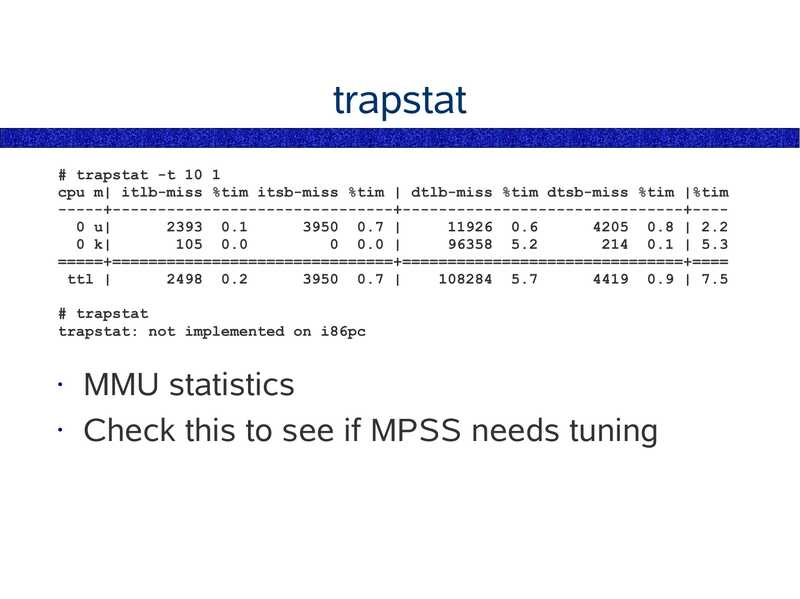
trapstat
# trapstat -t 10 1
cpu m| itlb-miss %tim itsb-miss %tim | dtlb-miss %tim dtsb-miss %tim |%tim
-----+-------------------------------+-------------------------------+---0 u|
2393 0.1
3950 0.7 |
11926 0.6
4205 0.8 | 2.2
0 k|
105 0.0
0 0.0 |
96358 5.2
214 0.1 | 5.3
=====+===============================+===============================+====
ttl |
2498 0.2
3950 0.7 |
108284 5.7
4419 0.9 | 7.5
# trapstat
trapstat: not implemented on i86pc
MMU statistics
• Check this to see if MPSS needs tuning
slide 44:
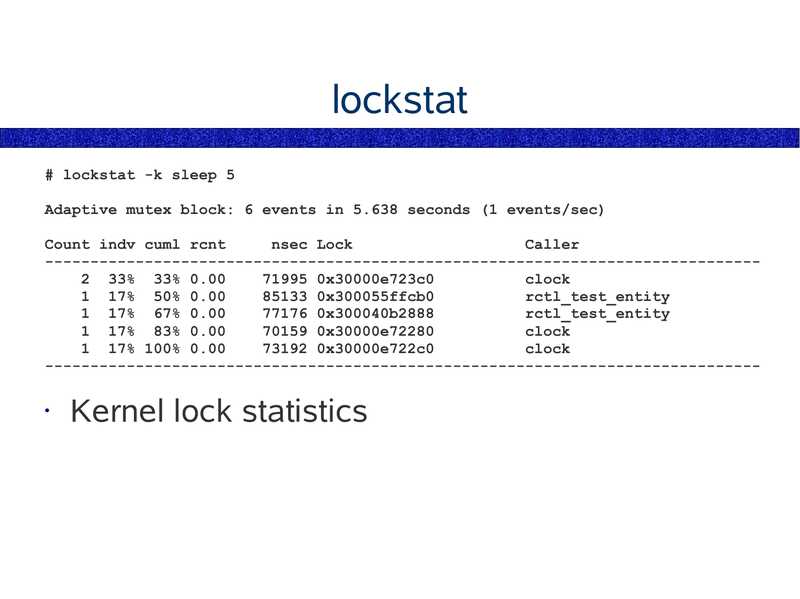
lockstat
# lockstat -k sleep 5
Adaptive mutex block: 6 events in 5.638 seconds (1 events/sec)
Count indv cuml rcnt
nsec Lock
Caller
------------------------------------------------------------------------------2 33% 33% 0.00
71995 0x30000e723c0
clock
1 17% 50% 0.00
85133 0x300055ffcb0
rctl_test_entity
1 17% 67% 0.00
77176 0x300040b2888
rctl_test_entity
1 17% 83% 0.00
70159 0x30000e72280
clock
1 17% 100% 0.00
73192 0x30000e722c0
clock
------------------------------------------------------------------------------•
Kernel lock statistics
slide 45:
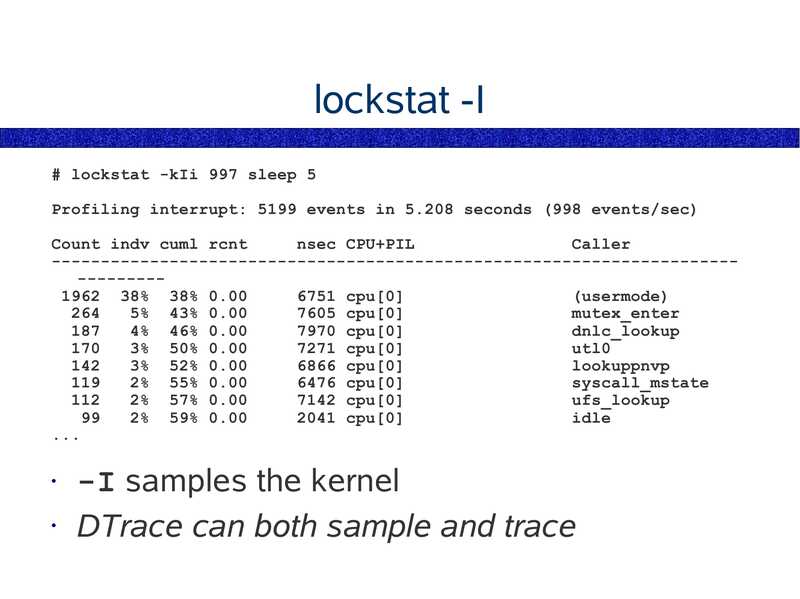
lockstat -I
# lockstat -kIi 997 sleep 5
Profiling interrupt: 5199 events in 5.208 seconds (998 events/sec)
Count indv cuml rcnt
nsec CPU+PIL
Caller
-----------------------------------------------------------------------------1962 38% 38% 0.00
6751 cpu[0]
(usermode)
5% 43% 0.00
7605 cpu[0]
mutex_enter
4% 46% 0.00
7970 cpu[0]
dnlc_lookup
3% 50% 0.00
7271 cpu[0]
utl0
3% 52% 0.00
6866 cpu[0]
lookuppnvp
2% 55% 0.00
6476 cpu[0]
syscall_mstate
2% 57% 0.00
7142 cpu[0]
ufs_lookup
2% 59% 0.00
2041 cpu[0]
idle
-I samples the kernel
• DTrace can both sample and trace
slide 46:
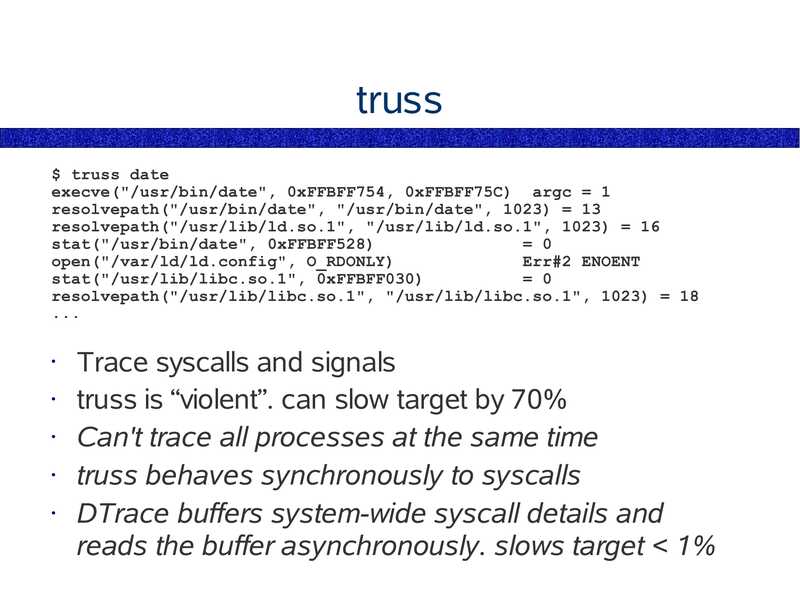
truss
$ truss date
execve("/usr/bin/date", 0xFFBFF754, 0xFFBFF75C) argc = 1
resolvepath("/usr/bin/date", "/usr/bin/date", 1023) = 13
resolvepath("/usr/lib/ld.so.1", "/usr/lib/ld.so.1", 1023) = 16
stat("/usr/bin/date", 0xFFBFF528)
= 0
open("/var/ld/ld.config", O_RDONLY)
Err#2 ENOENT
stat("/usr/lib/libc.so.1", 0xFFBFF030)
= 0
resolvepath("/usr/lib/libc.so.1", "/usr/lib/libc.so.1", 1023) = 18
Trace syscalls and signals
truss is “violent”. can slow target by 70%
Can't trace all processes at the same time
truss behaves synchronously to syscalls
DTrace buffers system-wide syscall details and
reads the buffer asynchronously. slows target
slide 47:
sotruss
$ sotruss date
date
date
date
date
date
date
date
date
date
date
->gt;
->gt;
->gt;
->gt;
->gt;
->gt;
->gt;
->gt;
->gt;
->gt;
libc.so.1:*atexit(0xff3bfaac, 0x21800, 0x0)
libc.so.1:*atexit(0x11654, 0x21800, 0x0)
libc.so.1:*setlocale(0x6, 0x116dc, 0xff3509e0)
libc.so.1:*textdomain(0x116e0, 0x116dc, 0xff3509e0)
libc.so.1:*getopt(0x1, 0xffbff684, 0x116f0)
libc.so.1:*time(0x21d98, 0xffbff684, 0x116f0)
libc.so.1:*nl_langinfo(0x3a, 0xffbff684, 0x21d98)
libc.so.1:*localtime(0x21d98, 0x3a, 0x21d98)
libc_psr.so.1:*memcpy(0xffbff5f4, 0xff2427b0, 0x24)
libc.so.1:*strftime(0x21d9c, 0x400, 0xff22b094)
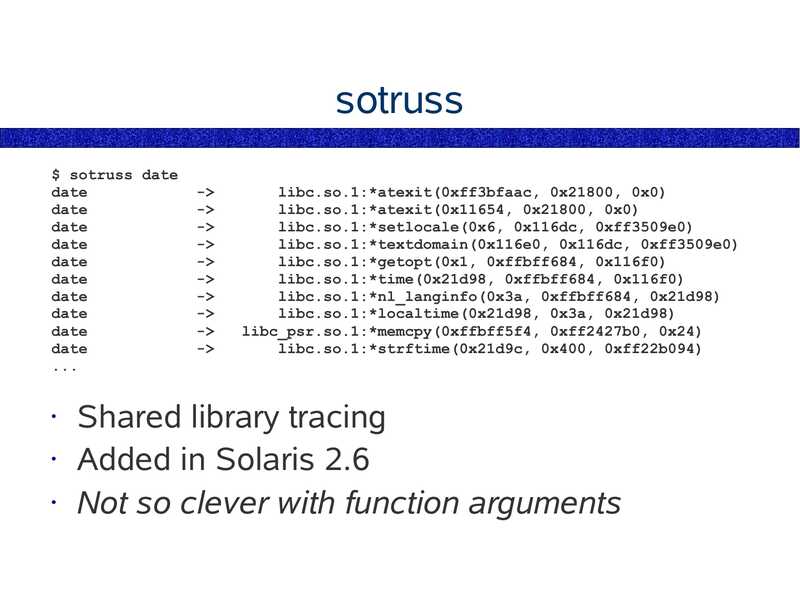
Shared library tracing
• Added in Solaris 2.6
• Not so clever with function arguments

slide 48:
apptrace
$ apptrace date
date
->gt; libc.so.1:atexit(func = 0xff3bfaac) = 0x0
date
->gt; libc.so.1:atexit(func = 0x11654) = 0x0
date
->gt; libc.so.1:setlocale(category = 0x6, locale = "") = "C"
date
->gt; libc.so.1:textdomain(domainname = "SUNW_OST_OSCMD") =
"SUNW_OST_OSCMD"
date
->gt; libc.so.1:getopt(argc = 0x1, argv = 0xffbff67c, optstring = "a:u")
= 0xffffffff errno = 0 (Error 0)
date
->gt; libc.so.1:strftime(s = "Fri May 12 17:16:12 ", maxsize = 0x400,
format = "%a %b %e %T %Z %Y", timeptr = 0xffbff5ec) = 0x1c
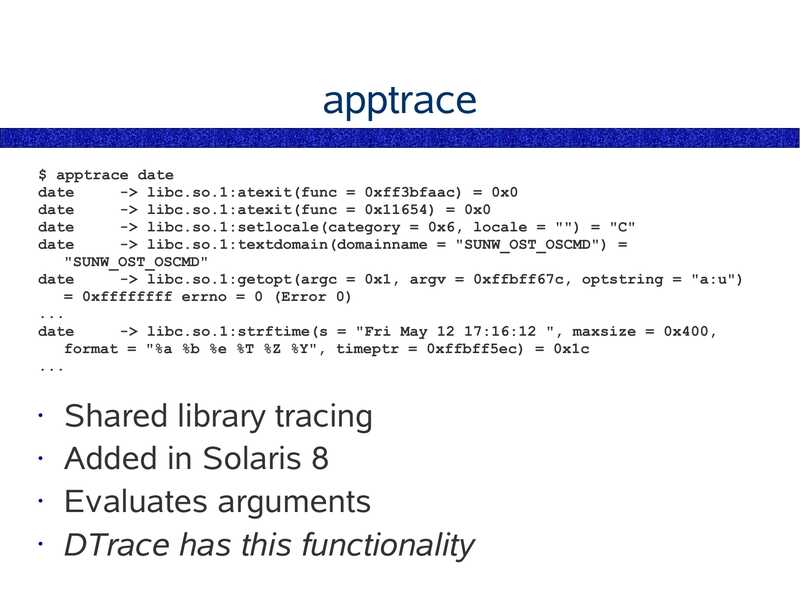
Shared library tracing
• Added in Solaris 8
• Evaluates arguments
• DTrace has this functionality

slide 49:
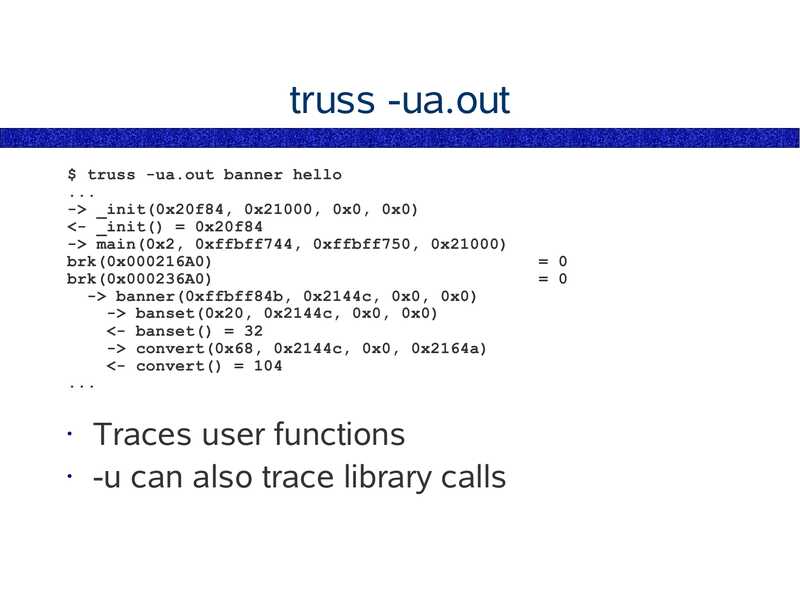
truss -ua.out
$ truss -ua.out banner hello
->gt; _init(0x20f84, 0x21000, 0x0, 0x0)
gt; main(0x2, 0xffbff744, 0xffbff750, 0x21000)
brk(0x000216A0)
brk(0x000236A0)
->gt; banner(0xffbff84b, 0x2144c, 0x0, 0x0)
->gt; banset(0x20, 0x2144c, 0x0, 0x0)
gt; convert(0x68, 0x2144c, 0x0, 0x2164a)

slide 50:
adb/mdb
Perform core dump analysis – processes
• Perform clash dump analysis – kernel
• mdb was added in Solaris 8

slide 51:
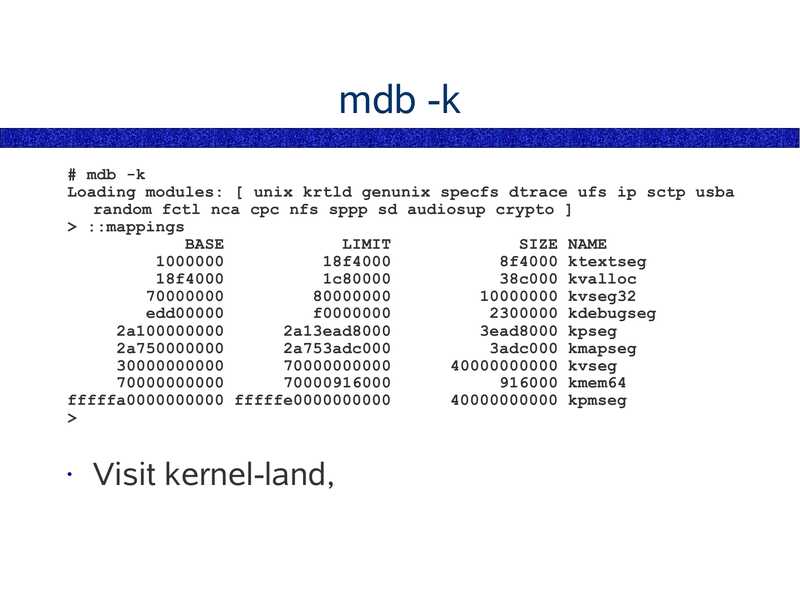
mdb -k
# mdb -k
Loading modules: [ unix krtld genunix specfs dtrace ufs ip sctp usba
random fctl nca cpc nfs sppp sd audiosup crypto ]
>gt; ::mappings
BASE
LIMIT
SIZE NAME
18f4000
8f4000 ktextseg
18f4000
1c80000
38c000 kvalloc
10000000 kvseg32
edd00000
f0000000
2300000 kdebugseg
2a100000000
2a13ead8000
3ead8000 kpseg
2a750000000
2a753adc000
3adc000 kmapseg
40000000000 kvseg
916000 kmem64
fffffa0000000000 fffffe0000000000
40000000000 kpmseg
>gt;
Visit kernel-land,

slide 52:
mdb -k
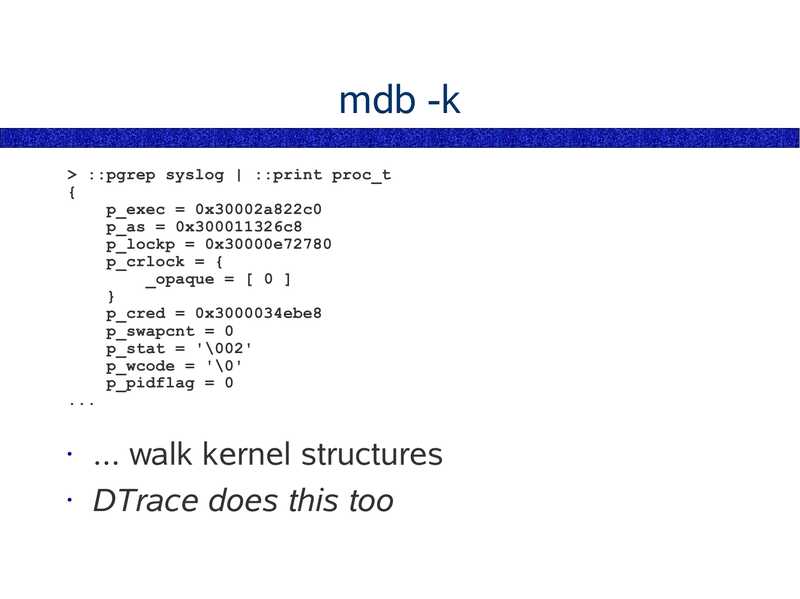
>gt; ::pgrep syslog | ::print proc_t
p_exec = 0x30002a822c0
p_as = 0x300011326c8
p_lockp = 0x30000e72780
p_crlock = {
_opaque = [ 0 ]
p_cred = 0x3000034ebe8
p_swapcnt = 0
p_stat = '\002'
p_wcode = '\0'
p_pidflag = 0
... walk kernel structures
• DTrace does this too

slide 53:
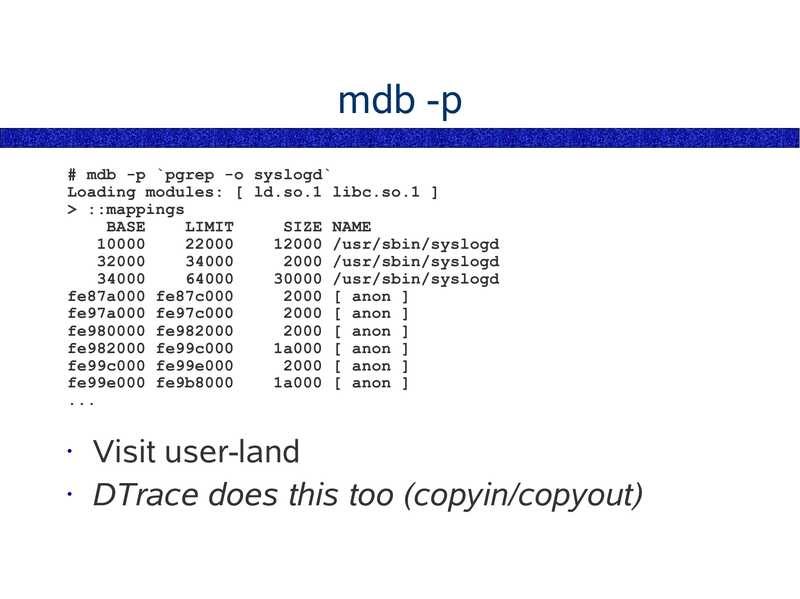
mdb -p
# mdb -p `pgrep -o syslogd`
Loading modules: [ ld.so.1 libc.so.1 ]
>gt; ::mappings
BASE
LIMIT
SIZE NAME
12000 /usr/sbin/syslogd
2000 /usr/sbin/syslogd
30000 /usr/sbin/syslogd
fe87a000 fe87c000
2000 [ anon ]
fe97a000 fe97c000
2000 [ anon ]
fe980000 fe982000
2000 [ anon ]
fe982000 fe99c000
1a000 [ anon ]
fe99c000 fe99e000
2000 [ anon ]
fe99e000 fe9b8000
1a000 [ anon ]
Visit user-land
• DTrace does this too (copyin/copyout)

slide 54:
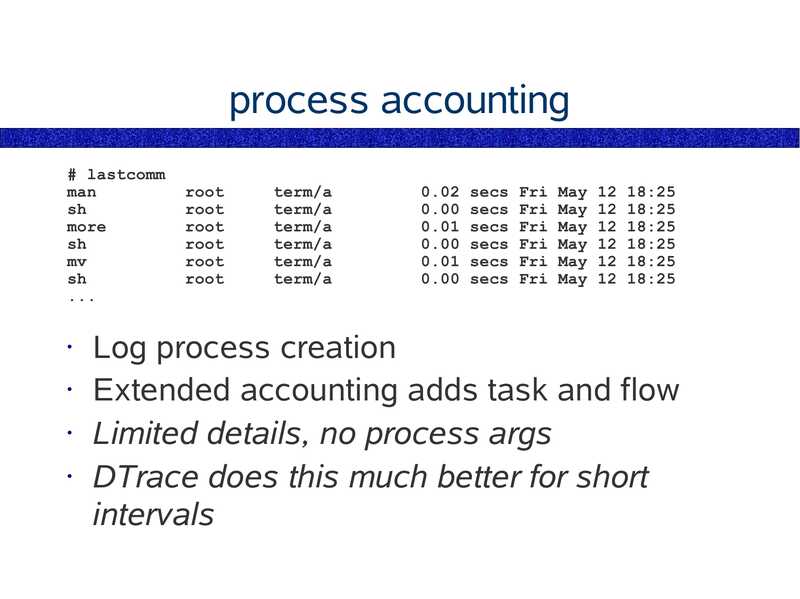
process accounting
# lastcomm
man
more
root
root
root
root
root
root
term/a
term/a
term/a
term/a
term/a
term/a
0.02 secs Fri May 12 18:25
0.00 secs Fri May 12 18:25
0.01 secs Fri May 12 18:25
0.00 secs Fri May 12 18:25
0.01 secs Fri May 12 18:25
0.00 secs Fri May 12 18:25
Log process creation
• Extended accounting adds task and flow
• Limited details, no process args
• DTrace does this much better for short
intervals

slide 55:
BSM auditing
Logs plenty of details
• Should be customised
• Not really an as-needed troubleshooting tool
• DTrace serves this role

slide 56:
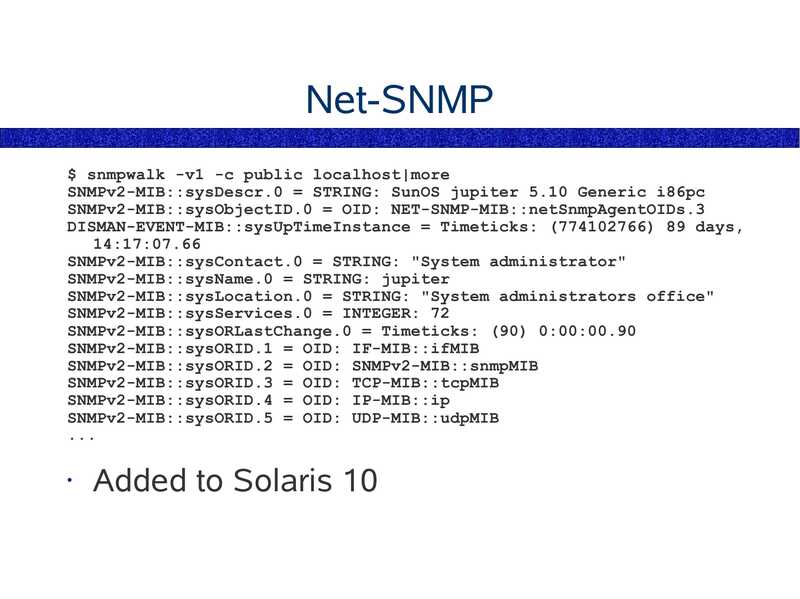
Net-SNMP
$ snmpwalk -v1 -c public localhost|more
SNMPv2-MIB::sysDescr.0 = STRING: SunOS jupiter 5.10 Generic i86pc
SNMPv2-MIB::sysObjectID.0 = OID: NET-SNMP-MIB::netSnmpAgentOIDs.3
DISMAN-EVENT-MIB::sysUpTimeInstance = Timeticks: (774102766) 89 days,
14:17:07.66
SNMPv2-MIB::sysContact.0 = STRING: "System administrator"
SNMPv2-MIB::sysName.0 = STRING: jupiter
SNMPv2-MIB::sysLocation.0 = STRING: "System administrators office"
SNMPv2-MIB::sysServices.0 = INTEGER: 72
SNMPv2-MIB::sysORLastChange.0 = Timeticks: (90) 0:00:00.90
SNMPv2-MIB::sysORID.1 = OID: IF-MIB::ifMIB
SNMPv2-MIB::sysORID.2 = OID: SNMPv2-MIB::snmpMIB
SNMPv2-MIB::sysORID.3 = OID: TCP-MIB::tcpMIB
SNMPv2-MIB::sysORID.4 = OID: IP-MIB::ip
SNMPv2-MIB::sysORID.5 = OID: UDP-MIB::udpMIB
Added to Solaris 10

slide 57:
... Unanswered Questions
disk I/O by process. easily.
• network I/O by process.
short-lived process analysis. easily.
interrupt driver on-CPU time
So what else couldn't you answer on older
Solaris?

slide 58:
End of Chapter 1
Chapter 1 – Solaris 9 Performance Tools
Chapter 2 – Introducing DTrace
Chapter 3 – Command Line DTrace
Chapter 4 – DTrace one-liners
Chapter 5 – DTrace Mentality 1
Chapter 6 – Providers
Chapter 7 – The D Language
Chapter 8 – Advanced Scripting
Chapter 9 – The DTraceToolkit
Chapter 10 – DTrace Mentality 2

slide 59:
Chapter 2
Introducing DTrace
What DTrace is
● What role DTrace plays
● A one-liner Demonstration
● DTrace Scripting
● DTrace resources

slide 60:
DTrace
Dynamic Tracing
Solaris 10 & OpenSolaris
Difficult to fully explain! We will use,
a) features
b) what it is like
c) what is “DTrace”
d) when to use it
e) demonstrations

slide 61:
DTrace Features
A framework for performance observability
and debugging in real-time
• Examines from user space to the kernel,
user-land functions and instructions
• library calls and instructions
• system calls
• kernel functions
• device driver functions
... from the same tool
• Is safe to use in production

slide 62:
DTrace Features
Can examine applications without restarting
them
• Has low impact when running, and zero
impact when not
• Dynamically inserts trace points into the
kernel and running applications, called
probes
• Can trace over 30,000 kernel probes

slide 63:
DTrace Features
Can trace as many application probes as it
finds functions and instructions (possibly
millions)
• Can trace system boot activity – before init!
• Provides a C-like language for writing
custom scripts
• Has solved countless long-term
performance issue mysteries – often easily
• One of the most significant additions to the
field of Operating Systems

slide 64:
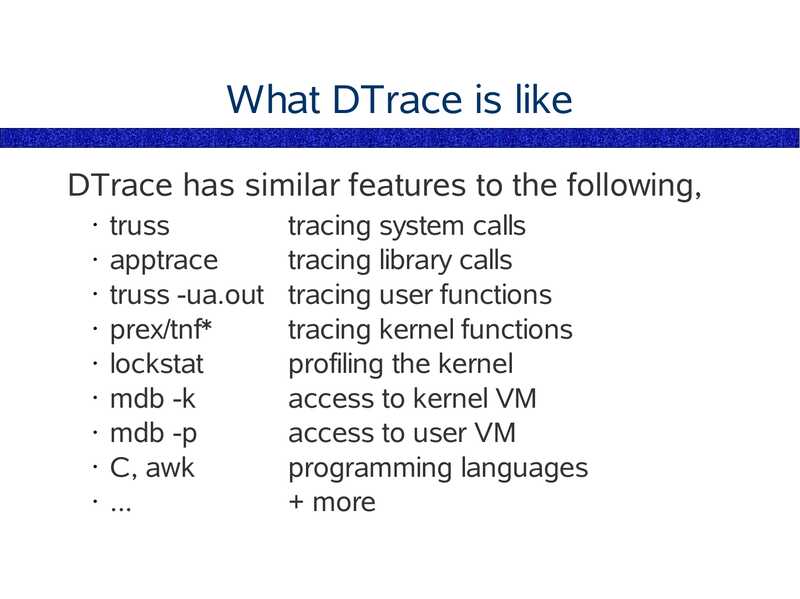
What DTrace is like
DTrace has similar features to the following,
truss
• apptrace
• truss -ua.out
• prex/tnf*
• lockstat
• mdb -k
• mdb -p
• C, awk
• ...
tracing system calls
tracing library calls
tracing user functions
tracing kernel functions
profiling the kernel
access to kernel VM
access to user VM
programming languages
+ more

slide 65:
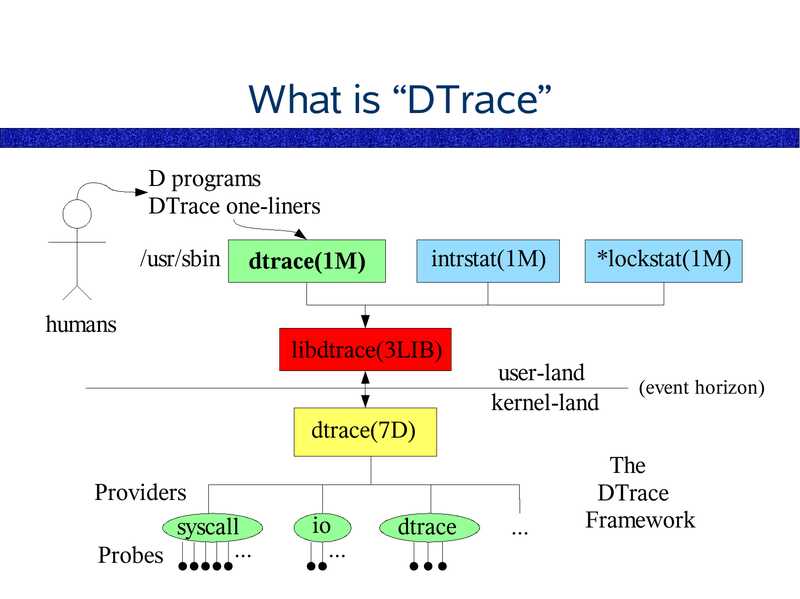
What is “DTrace”
D programs
DTrace one-liners
/usr/sbin
intrstat(1M)
dtrace(1M)
humans
libdtrace(3LIB)
*lockstat(1M)
user-land
kernel-land
(event horizon)
dtrace(7D)
Providers
syscall
Probes
dtrace
The
DTrace
Framework

slide 66:
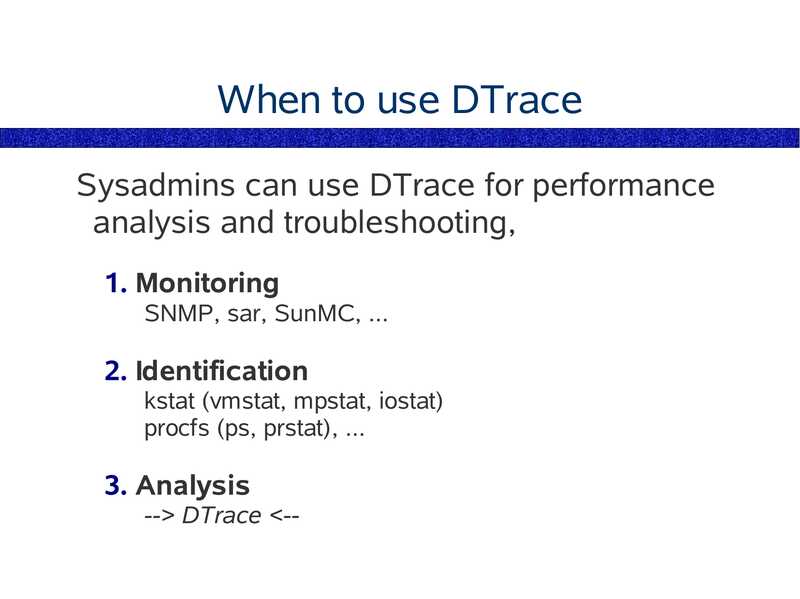
When to use DTrace
Sysadmins can use DTrace for performance
analysis and troubleshooting,
1. Monitoring
SNMP, sar, SunMC, ...
2. Identification
kstat (vmstat, mpstat, iostat)
procfs (ps, prstat), ...
3. Analysis
-->gt; DTrace
slide 67:
When to use DTrace
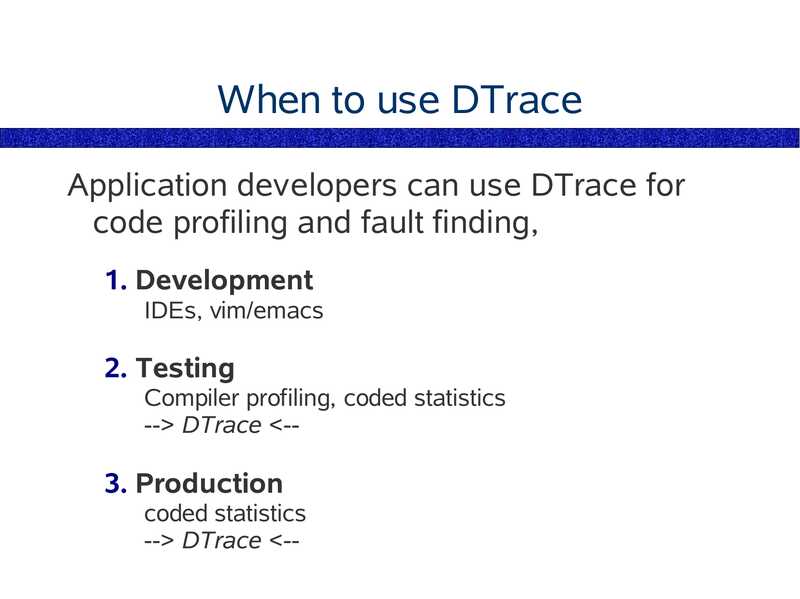
Application developers can use DTrace for
code profiling and fault finding,
1. Development
IDEs, vim/emacs
2. Testing
Compiler profiling, coded statistics
-->gt; DTrace gt; DTrace
slide 68:
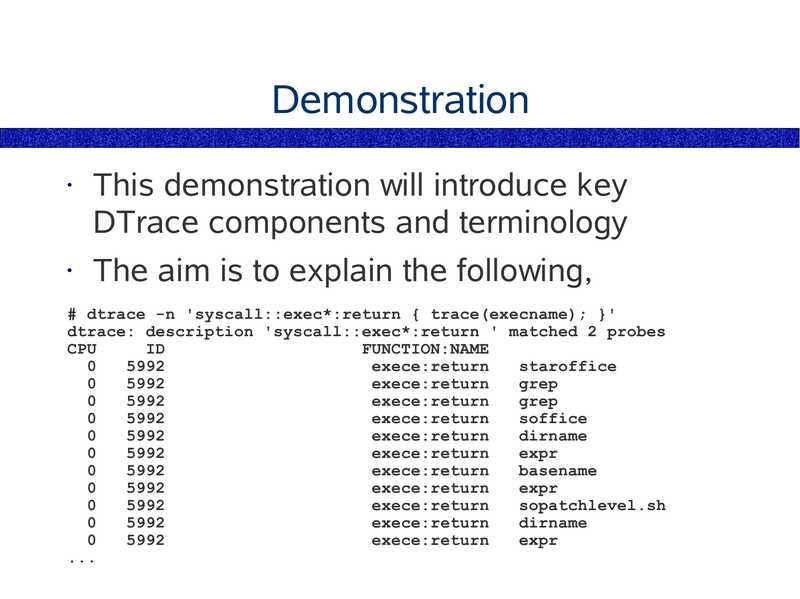
Demonstration
This demonstration will introduce key
DTrace components and terminology
The aim is to explain the following,
# dtrace -n 'syscall::exec*:return { trace(execname); }'
dtrace: description 'syscall::exec*:return ' matched 2 probes
CPU
FUNCTION:NAME
exece:return
staroffice
exece:return
grep
exece:return
grep
exece:return
soffice
exece:return
dirname
exece:return
expr
exece:return
basename
exece:return
expr
exece:return
sopatchlevel.sh
exece:return
dirname
exece:return
expr

slide 69:
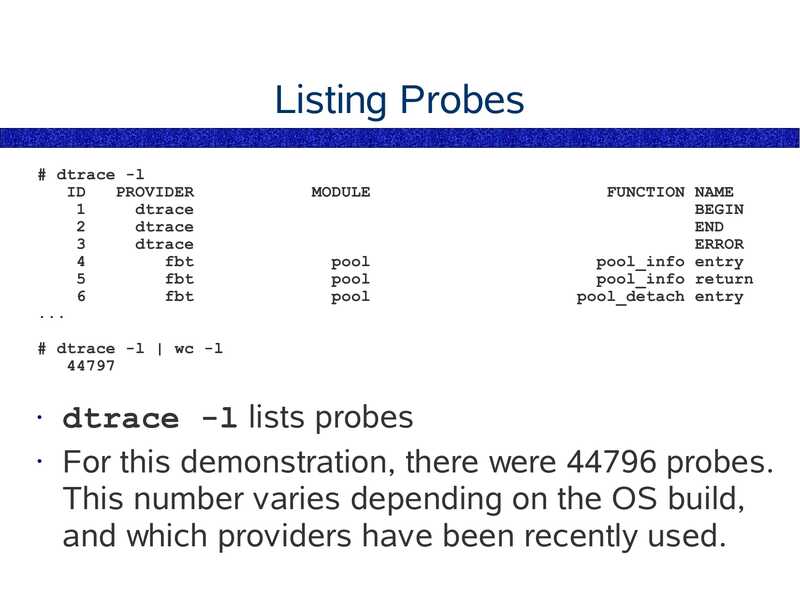
Listing Probes
# dtrace -l
PROVIDER
dtrace
dtrace
dtrace
fbt
fbt
fbt
MODULE
pool
pool
pool
FUNCTION NAME
BEGIN
END
ERROR
pool_info entry
pool_info return
pool_detach entry
# dtrace -l | wc -l
dtrace -l lists probes
• For this demonstration, there were 44796 probes.
This number varies depending on the OS build,
and which providers have been recently used.

slide 70:
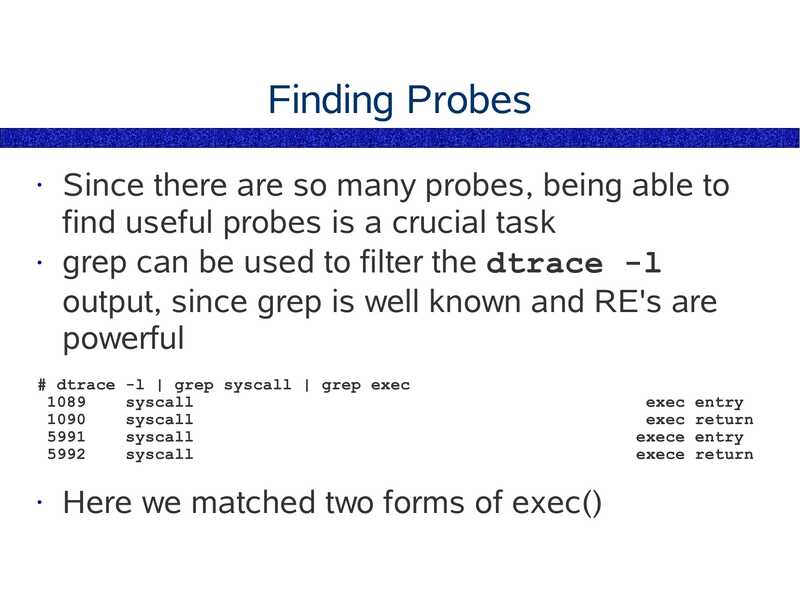
Finding Probes
Since there are so many probes, being able to
find useful probes is a crucial task
• grep can be used to filter the dtrace -l
output, since grep is well known and RE's are
powerful
# dtrace -l | grep syscall | grep exec
syscall
syscall
syscall
syscall
Here we matched two forms of exec()
exec entry
exec return
exece entry
exece return

slide 71:
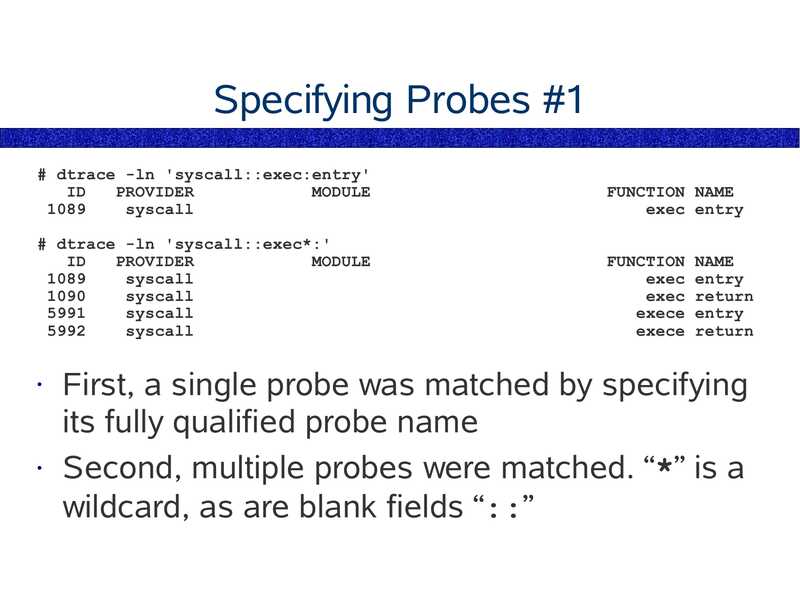
Specifying Probes #1
# dtrace -ln 'syscall::exec:entry'
PROVIDER
MODULE
syscall
FUNCTION NAME
exec entry
# dtrace -ln 'syscall::exec*:'
PROVIDER
MODULE
syscall
syscall
syscall
syscall
FUNCTION NAME
exec entry
exec return
exece entry
exece return
First, a single probe was matched by specifying
its fully qualified probe name
• Second, multiple probes were matched. “*” is a
wildcard, as are blank fields “::”

slide 72:
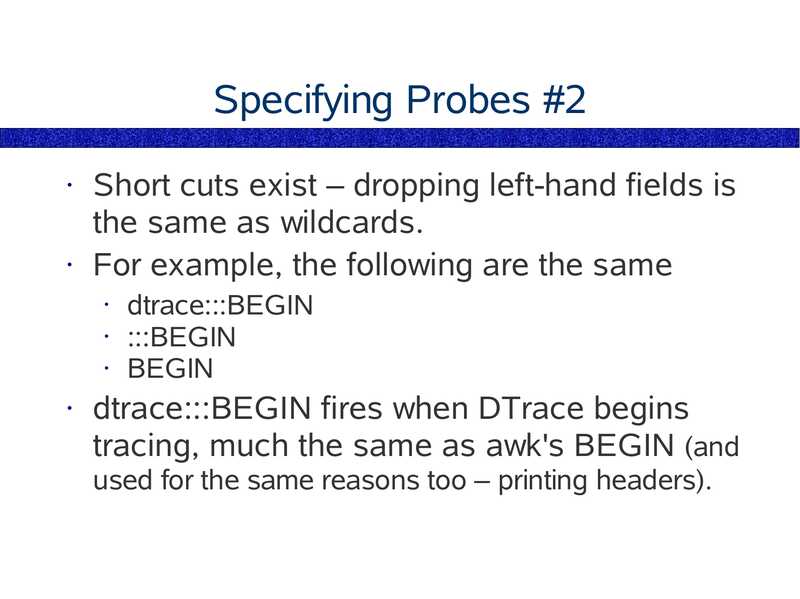
Specifying Probes #2
Short cuts exist – dropping left-hand fields is
the same as wildcards.
• For example, the following are the same
dtrace:::BEGIN
• :::BEGIN
• BEGIN
dtrace:::BEGIN fires when DTrace begins
tracing, much the same as awk's BEGIN (and
used for the same reasons too – printing headers).

slide 73:
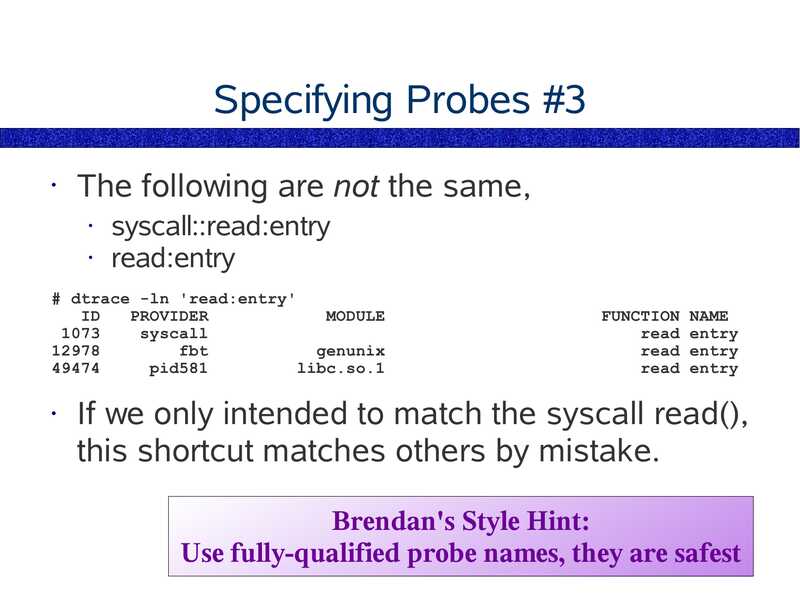
Specifying Probes #3
The following are not the same,
syscall::read:entry
• read:entry
# dtrace -ln 'read:entry'
PROVIDER
MODULE
syscall
fbt
genunix
pid581
libc.so.1
FUNCTION NAME
read entry
read entry
read entry
If we only intended to match the syscall read(),
this shortcut matches others by mistake.
Brendan's Style Hint:
Use fully-qualified probe names, they are safest

slide 74:
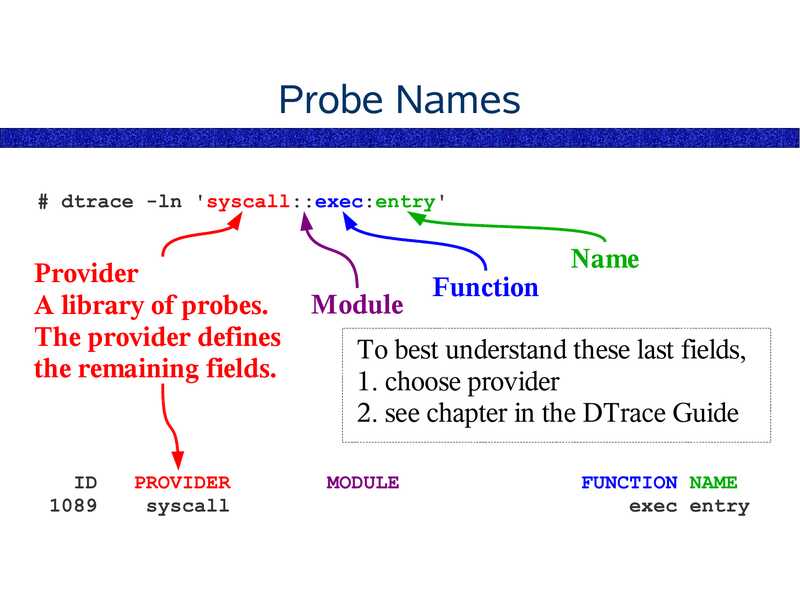
Probe Names
# dtrace -ln 'syscall::exec:entry'
Provider
A library of probes.
The provider defines
the remaining fields.
PROVIDER
syscall
Module
Function
Name
To best understand these last fields,
1. choose provider
2. see chapter in the DTrace Guide
MODULE
FUNCTION NAME
exec entry

slide 75:
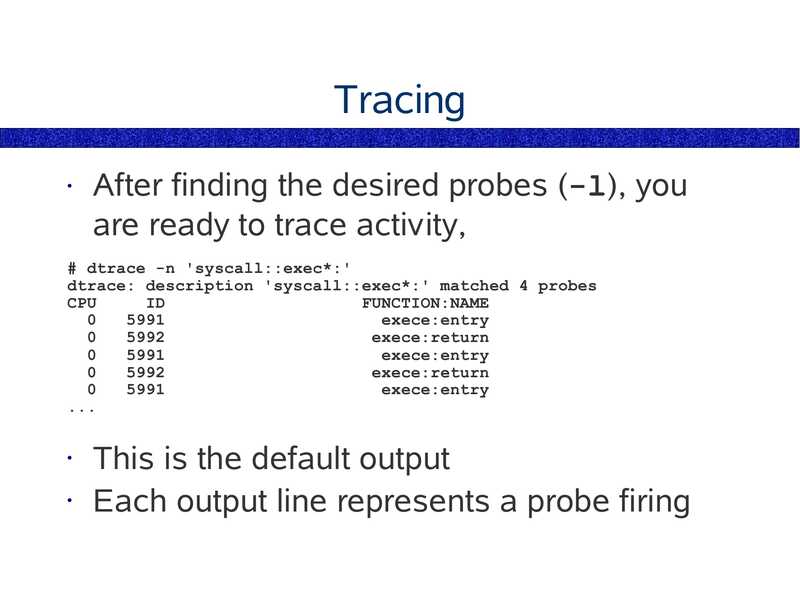
Tracing
After finding the desired probes (-l), you
are ready to trace activity,
# dtrace -n 'syscall::exec*:'
dtrace: description 'syscall::exec*:' matched 4 probes
CPU
FUNCTION:NAME
exece:entry
exece:return
exece:entry
exece:return
exece:entry
This is the default output
• Each output line represents a probe firing

slide 76:
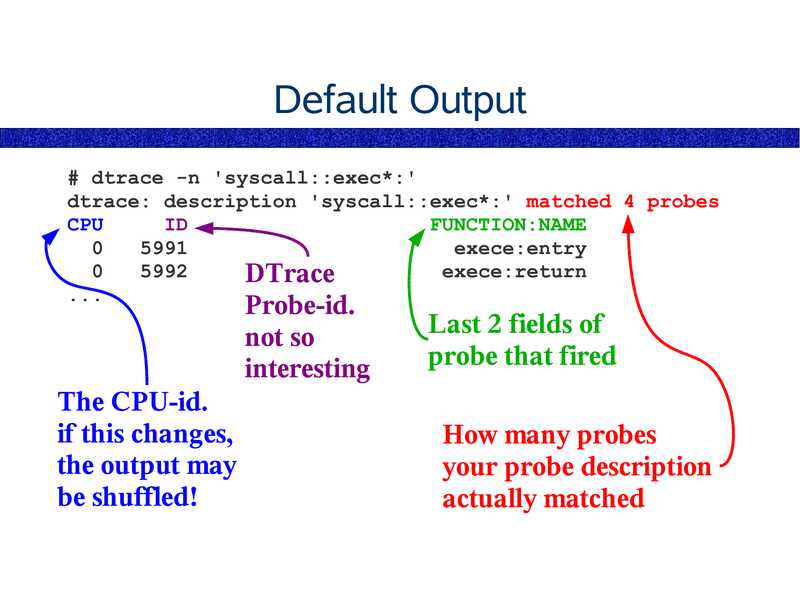
Default Output
# dtrace -n 'syscall::exec*:'
dtrace: description 'syscall::exec*:' matched 4 probes
CPU
FUNCTION:NAME
exece:entry
exece:return
DTrace
Probe-id.
not so
interesting
The CPU-id.
if this changes,
the output may
be shuffled!
Last 2 fields of
probe that fired
How many probes
your probe description
actually matched

slide 77:
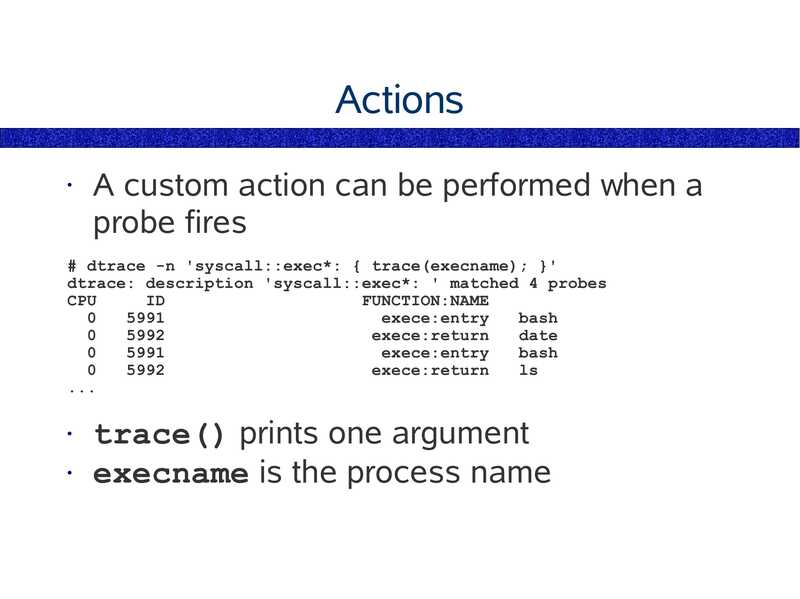
Actions
A custom action can be performed when a
probe fires
# dtrace -n 'syscall::exec*: { trace(execname); }'
dtrace: description 'syscall::exec*: ' matched 4 probes
CPU
FUNCTION:NAME
exece:entry
bash
exece:return
date
exece:entry
bash
exece:return
trace() prints one argument
• execname is the process name

slide 78:
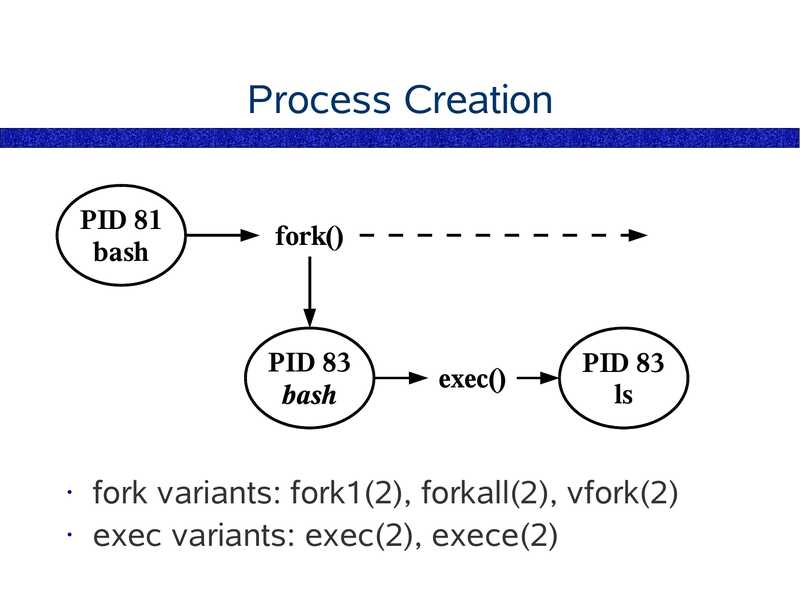
Process Creation
PID 81
bash
fork()
PID 83
bash
exec()
PID 83
fork variants: fork1(2), forkall(2), vfork(2)
• exec variants: exec(2), exece(2)

slide 79:
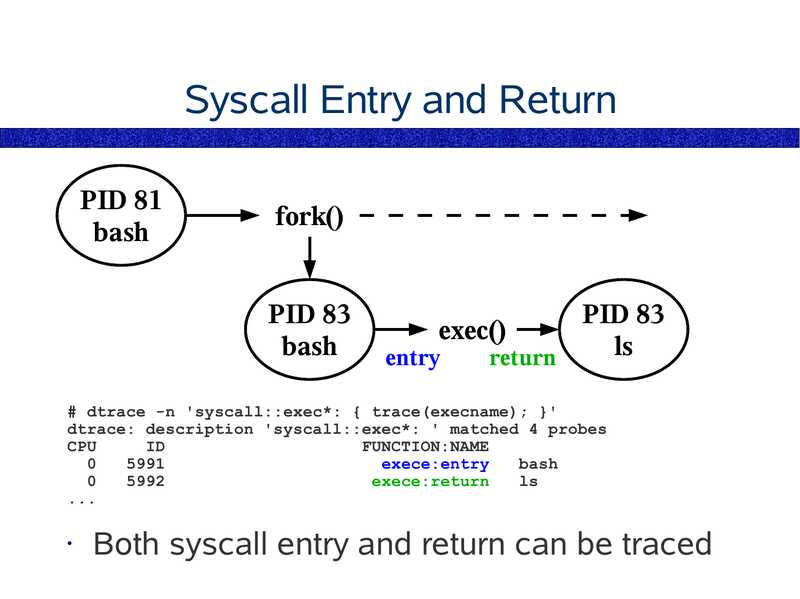
Syscall Entry and Return
PID 81
bash
fork()
PID 83
bash
PID 83
exec()
entry
return
# dtrace -n 'syscall::exec*: { trace(execname); }'
dtrace: description 'syscall::exec*: ' matched 4 probes
CPU
FUNCTION:NAME
exece:entry
bash
exece:return
Both syscall entry and return can be traced

slide 80:
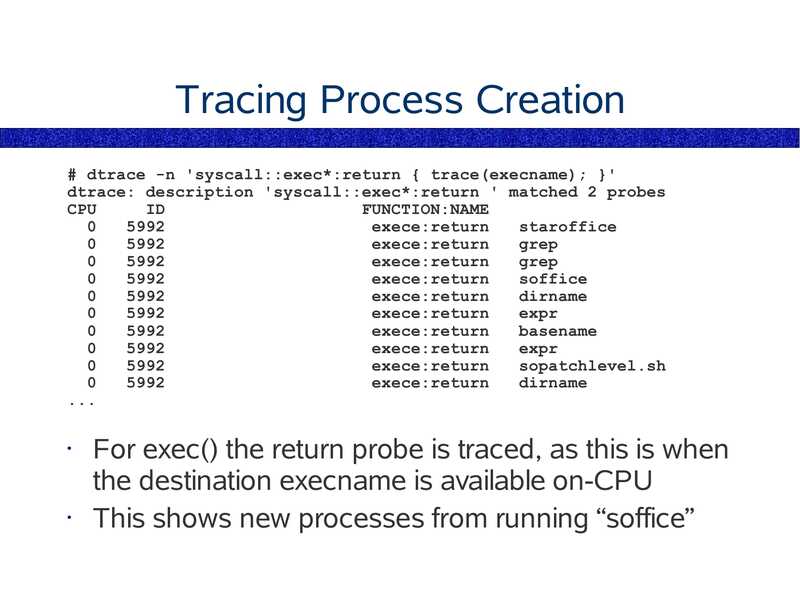
Tracing Process Creation
# dtrace -n 'syscall::exec*:return { trace(execname); }'
dtrace: description 'syscall::exec*:return ' matched 2 probes
CPU
FUNCTION:NAME
exece:return
staroffice
exece:return
grep
exece:return
grep
exece:return
soffice
exece:return
dirname
exece:return
expr
exece:return
basename
exece:return
expr
exece:return
sopatchlevel.sh
exece:return
dirname
For exec() the return probe is traced, as this is when
the destination execname is available on-CPU
This shows new processes from running “soffice”

slide 81:
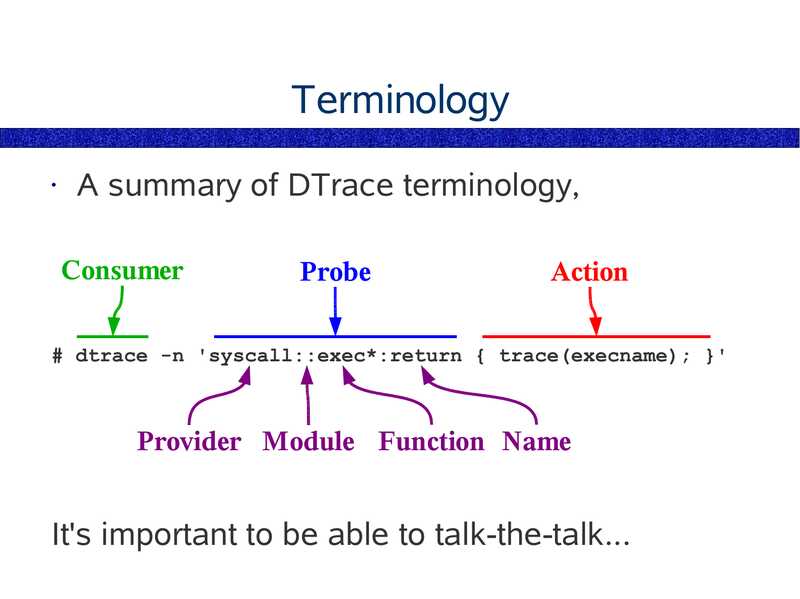
Terminology
A summary of DTrace terminology,
Consumer
Probe
Action
# dtrace -n 'syscall::exec*:return { trace(execname); }'
Provider Module Function Name
It's important to be able to talk-the-talk...

slide 82:
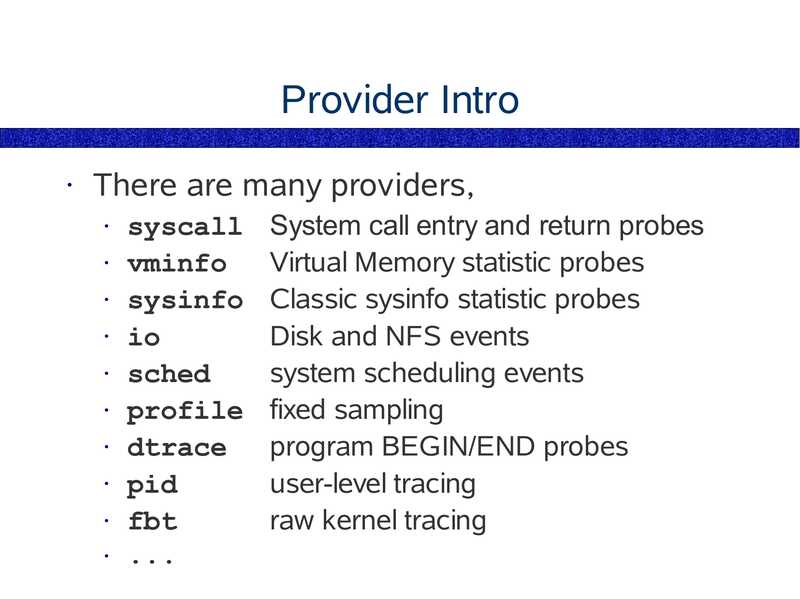
Provider Intro
There are many providers,
syscall
• vminfo
• sysinfo
• io
• sched
• profile
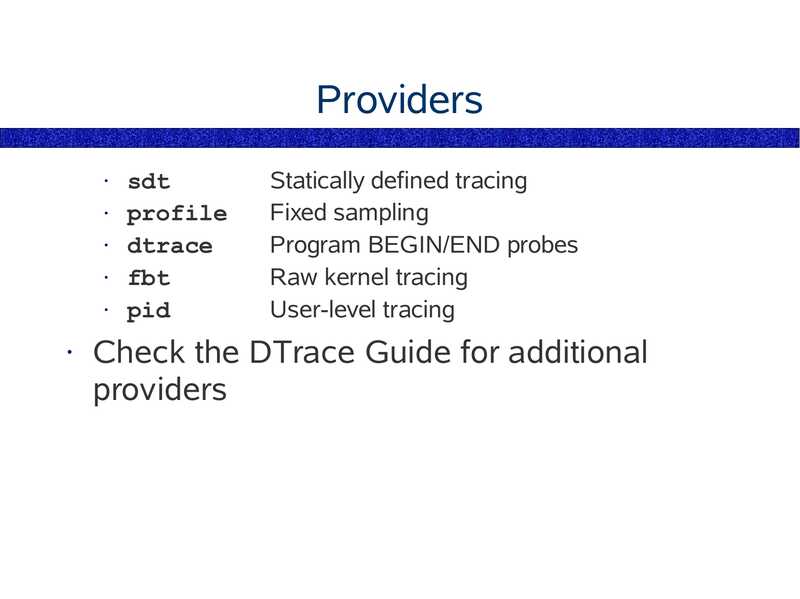
• dtrace
• pid
• fbt
• ...
System call entry and return probes
Virtual Memory statistic probes
Classic sysinfo statistic probes
Disk and NFS events
system scheduling events
fixed sampling
program BEGIN/END probes
user-level tracing
raw kernel tracing

slide 83:
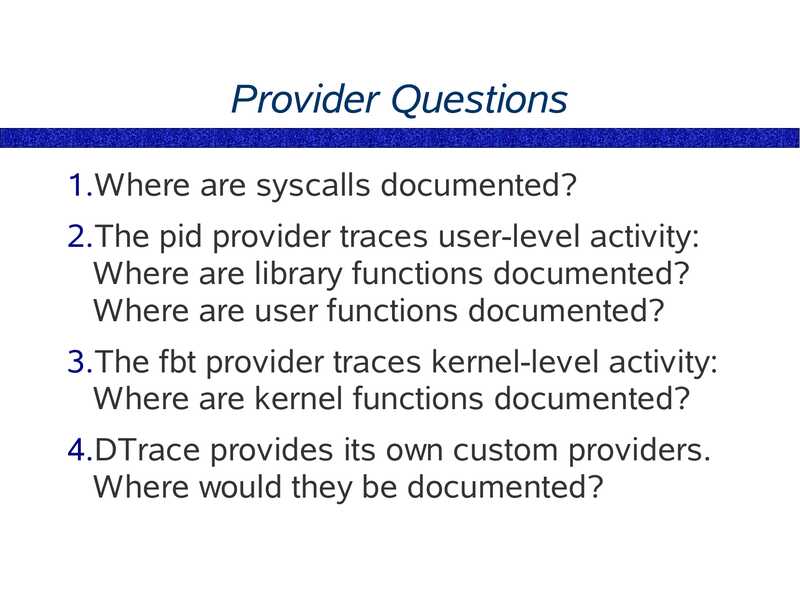
Provider Questions
1.Where are syscalls documented?
2.The pid provider traces user-level activity:
Where are library functions documented?
Where are user functions documented?
3.The fbt provider traces kernel-level activity:
Where are kernel functions documented?
4.DTrace provides its own custom providers.
Where would they be documented?

slide 84:
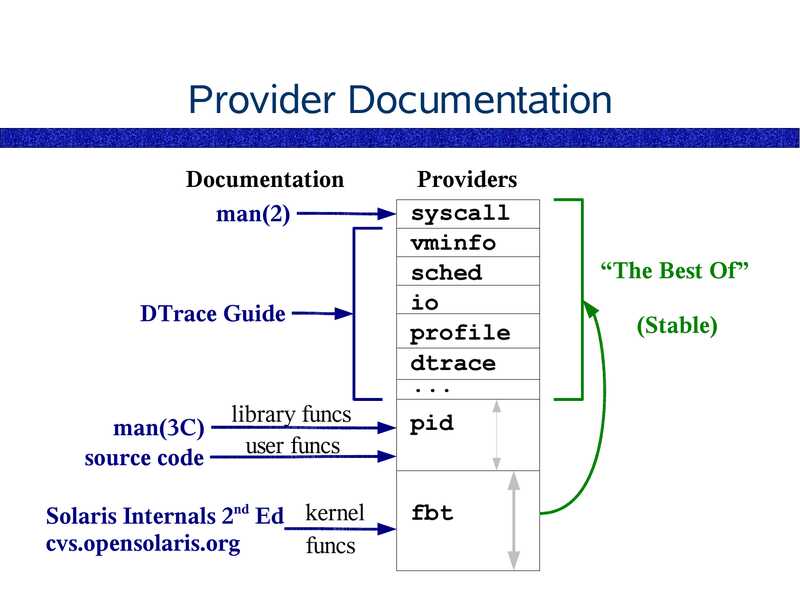
Provider Documentation
Documentation
man(2)
DTrace Guide
Providers
syscall
vminfo
sched
profile
dtrace
library funcs
user funcs
pid
Solaris Internals 2nd Ed kernel
cvs.opensolaris.org
funcs
fbt
man(3C)
source code
“The Best Of”
(Stable)

slide 85:
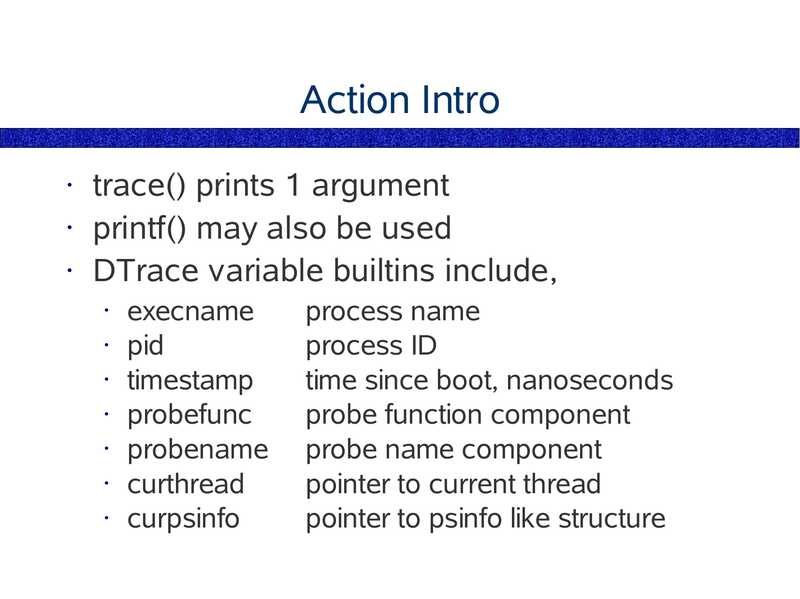
Action Intro
trace() prints 1 argument
• printf() may also be used
• DTrace variable builtins include,
execname
• pid
• timestamp
• probefunc
• probename
• curthread
• curpsinfo
process name
process ID
time since boot, nanoseconds
probe function component
probe name component
pointer to current thread
pointer to psinfo like structure

slide 86:
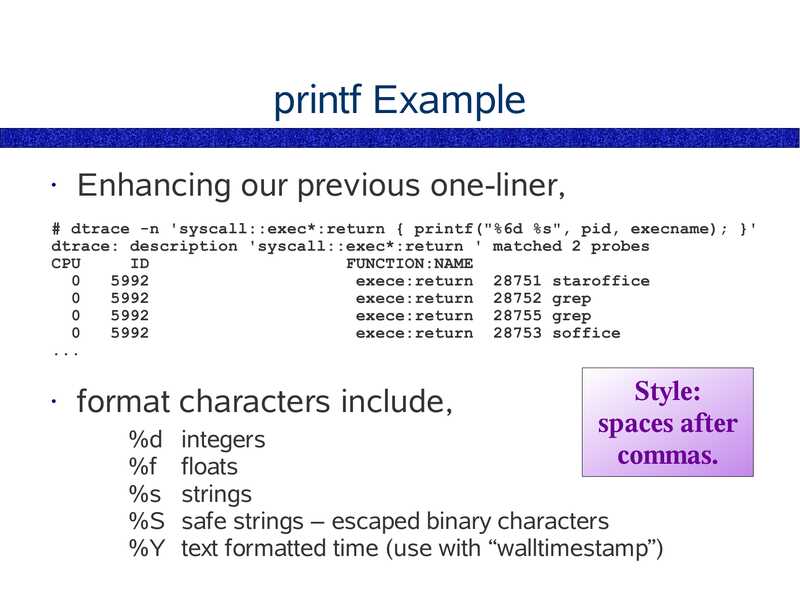
printf Example
Enhancing our previous one-liner,
# dtrace -n 'syscall::exec*:return { printf("%6d %s", pid, execname); }'
dtrace: description 'syscall::exec*:return ' matched 2 probes
CPU
FUNCTION:NAME
exece:return 28751 staroffice
exece:return 28752 grep
exece:return 28755 grep
exece:return 28753 soffice
format characters include,
Style:
spaces after
commas.
%d integers
%f floats
%s strings
%S safe strings – escaped binary characters
%Y text formatted time (use with “walltimestamp”)

slide 87:
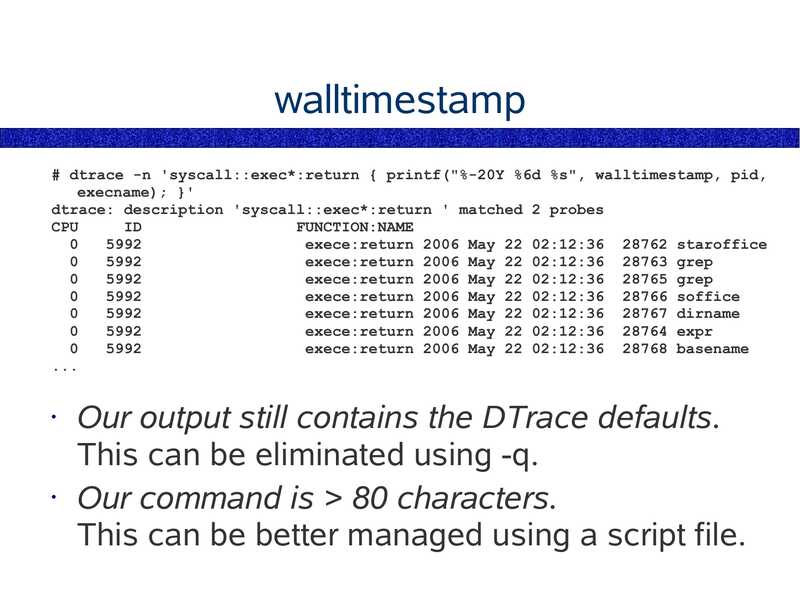
walltimestamp
# dtrace -n 'syscall::exec*:return { printf("%-20Y %6d %s", walltimestamp, pid,
execname); }'
dtrace: description 'syscall::exec*:return ' matched 2 probes
CPU
FUNCTION:NAME
exece:return 2006 May 22 02:12:36 28762 staroffice
exece:return 2006 May 22 02:12:36 28763 grep
exece:return 2006 May 22 02:12:36 28765 grep
exece:return 2006 May 22 02:12:36 28766 soffice
exece:return 2006 May 22 02:12:36 28767 dirname
exece:return 2006 May 22 02:12:36 28764 expr
exece:return 2006 May 22 02:12:36 28768 basename
Our output still contains the DTrace defaults.
This can be eliminated using -q.
• Our command is >gt; 80 characters.
This can be better managed using a script file.

slide 88:
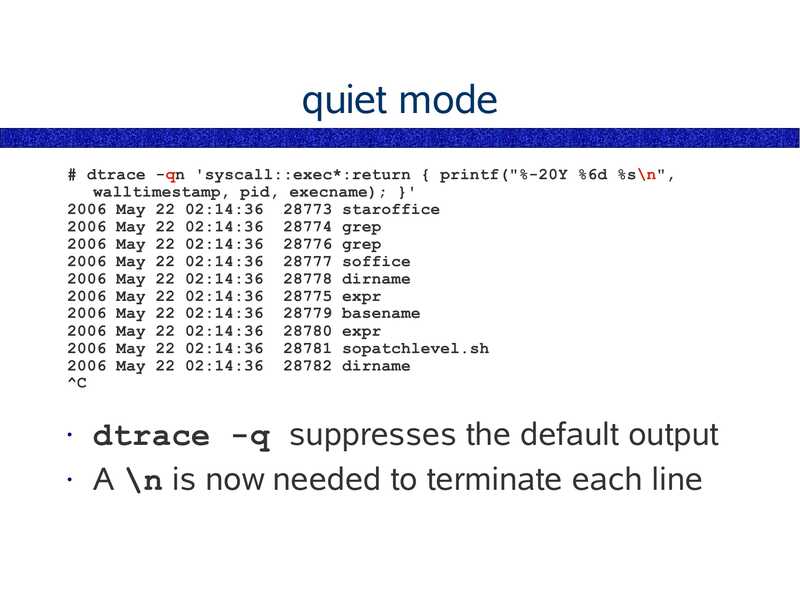
quiet mode
# dtrace -qn 'syscall::exec*:return { printf("%-20Y %6d %s\n",
walltimestamp, pid, execname); }'
2006 May 22 02:14:36 28773 staroffice
2006 May 22 02:14:36 28774 grep
2006 May 22 02:14:36 28776 grep
2006 May 22 02:14:36 28777 soffice
2006 May 22 02:14:36 28778 dirname
2006 May 22 02:14:36 28775 expr
2006 May 22 02:14:36 28779 basename
2006 May 22 02:14:36 28780 expr
2006 May 22 02:14:36 28781 sopatchlevel.sh
2006 May 22 02:14:36 28782 dirname
dtrace -q suppresses the default output
• A \n is now needed to terminate each line

slide 89:
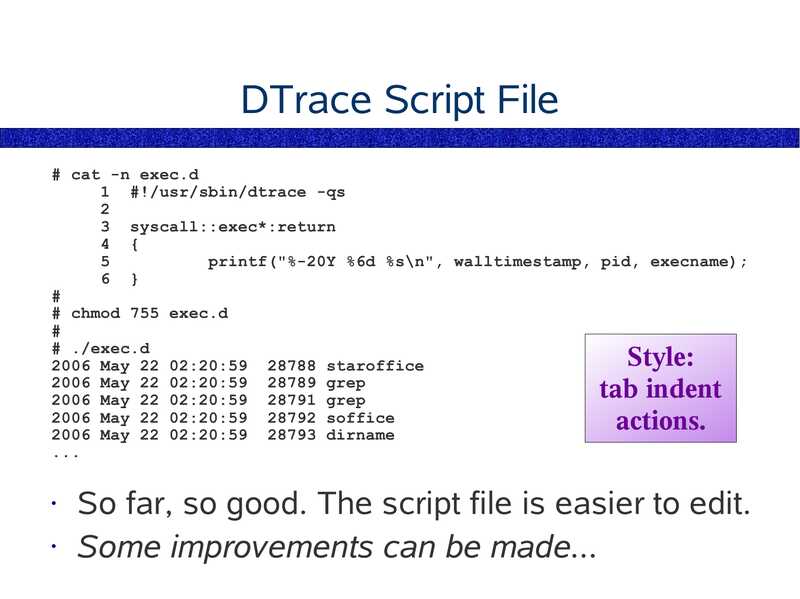
DTrace Script File
# cat -n exec.d
1 #!/usr/sbin/dtrace -qs
3 syscall::exec*:return
4 {
printf("%-20Y %6d %s\n", walltimestamp, pid, execname);
6 }
# chmod 755 exec.d
# ./exec.d
2006 May 22 02:20:59 28788 staroffice
2006 May 22 02:20:59 28789 grep
2006 May 22 02:20:59 28791 grep
2006 May 22 02:20:59 28792 soffice
2006 May 22 02:20:59 28793 dirname
Style:
tab indent
actions.
So far, so good. The script file is easier to edit.
• Some improvements can be made...

slide 90:
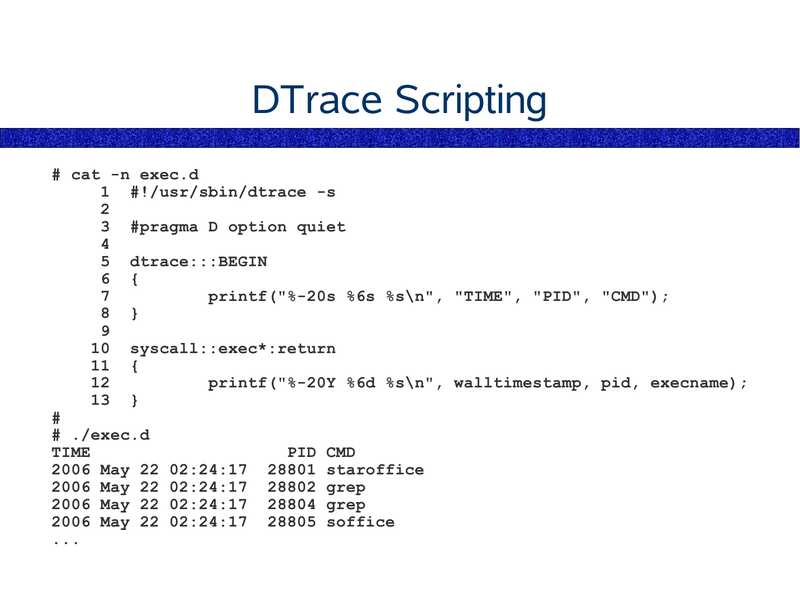
DTrace Scripting
# cat -n exec.d
1 #!/usr/sbin/dtrace -s
3 #pragma D option quiet
5 dtrace:::BEGIN
6 {
printf("%-20s %6s %s\n", "TIME", "PID", "CMD");
8 }
10 syscall::exec*:return
11 {
printf("%-20Y %6d %s\n", walltimestamp, pid, execname);
13 }
# ./exec.d
TIME
PID CMD
2006 May 22 02:24:17 28801 staroffice
2006 May 22 02:24:17 28802 grep
2006 May 22 02:24:17 28804 grep
2006 May 22 02:24:17 28805 soffice

slide 91:
DTrace Scripting
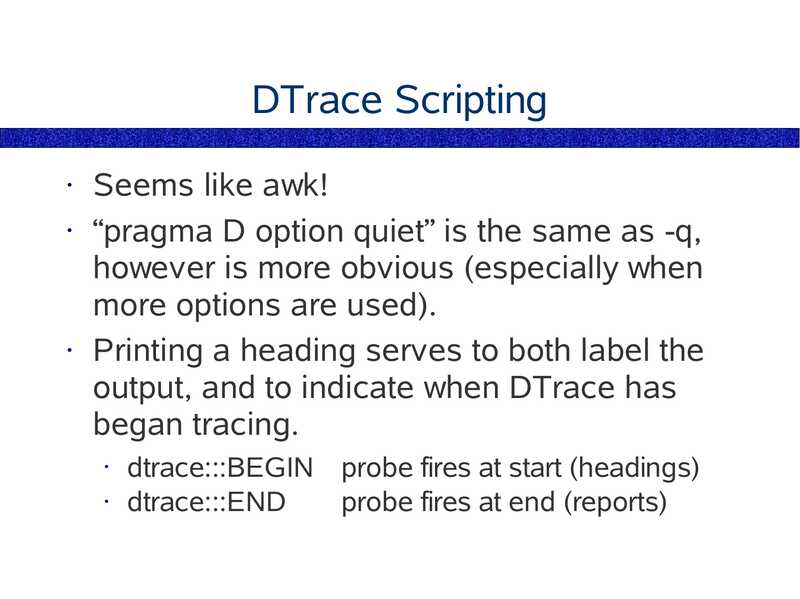
Seems like awk!
• “pragma D option quiet” is the same as -q,
however is more obvious (especially when
more options are used).
• Printing a heading serves to both label the
output, and to indicate when DTrace has
began tracing.
dtrace:::BEGIN probe fires at start (headings)
• dtrace:::END
probe fires at end (reports)

slide 92:
curpsinfo->gt;pr_psargs
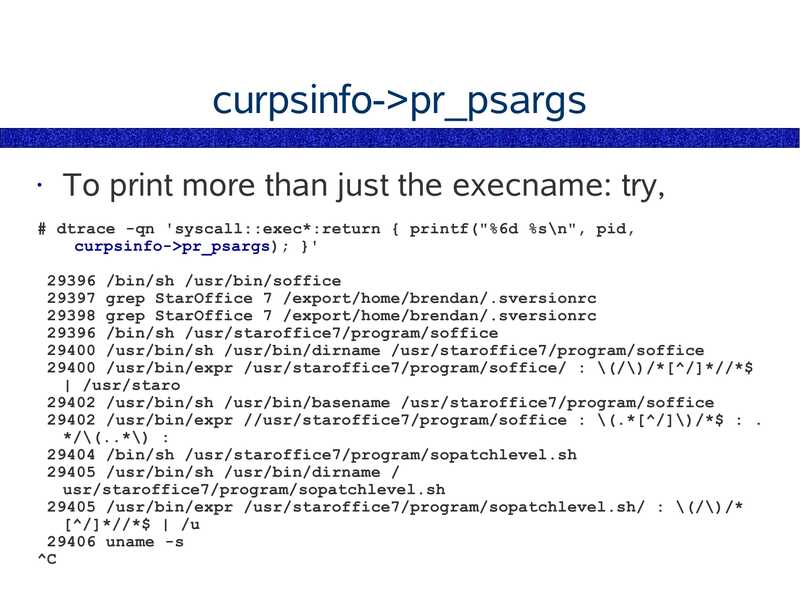
To print more than just the execname: try,
# dtrace -qn 'syscall::exec*:return { printf("%6d %s\n", pid,
curpsinfo->gt;pr_psargs); }'
29396 /bin/sh /usr/bin/soffice
29397 grep StarOffice 7 /export/home/brendan/.sversionrc
29398 grep StarOffice 7 /export/home/brendan/.sversionrc
29396 /bin/sh /usr/staroffice7/program/soffice
29400 /usr/bin/sh /usr/bin/dirname /usr/staroffice7/program/soffice
29400 /usr/bin/expr /usr/staroffice7/program/soffice/ : \(/\)/*[^/]*//*$
| /usr/staro
29402 /usr/bin/sh /usr/bin/basename /usr/staroffice7/program/soffice
29402 /usr/bin/expr //usr/staroffice7/program/soffice : \(.*[^/]\)/*$ : .
*/\(..*\) :
29404 /bin/sh /usr/staroffice7/program/sopatchlevel.sh
29405 /usr/bin/sh /usr/bin/dirname /
usr/staroffice7/program/sopatchlevel.sh
29405 /usr/bin/expr /usr/staroffice7/program/sopatchlevel.sh/ : \(/\)/*
[^/]*//*$ | /u
29406 uname -s

slide 93:
DTrace Resources
OpenSolaris DTrace Community
http://www.opensolaris.org/os/community/dtrace
DTrace Guide
http://docs.sun.com/app/docs/doc/817-6223
DTrace Tools
http://www.brendangregg.com/dtrace.html
Solaris Performance and Tools: DTrace and
MDB Techniques for Solaris 10 and
OpenSolaris. McDougall/Mauro/Gregg
ISBN: 0-13-156819-1

slide 94:
End of Chapter 2
Chapter 1 – Solaris 9 Performance Tools
Chapter 2 – Introducing DTrace
Chapter 3 – Command Line DTrace
Chapter 4 – DTrace one-liners
Chapter 5 – DTrace Mentality 1
Chapter 6 – Providers
Chapter 7 – The D Language
Chapter 8 – Advanced Scripting
Chapter 9 – The DTraceToolkit
Chapter 10 – DTrace Mentality 2

slide 95:
Chapter 3
Command Line DTrace
The syscall Provider
● Entry/Return Arguments
● Predicates
● Aggregations
● Stack tracing
● Intro to sysinfo Provider
● Intro to profile Provider

slide 96:
syscall Provider
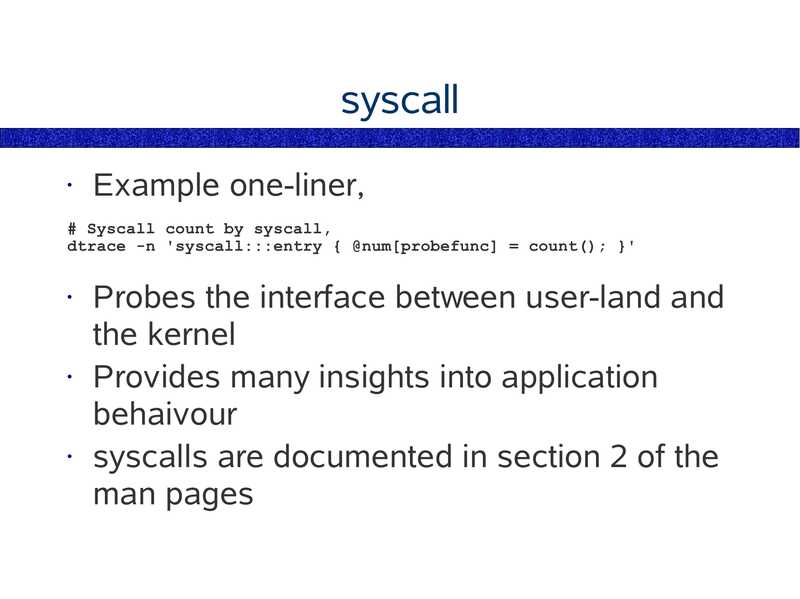
This provider traces syscall entry and
returns
• syscalls are the interface between user-land
and the kernel, and reflect much of an
applications behaviour
• syscalls are well documented – man(2)
• This provider is a great place to start
learning DTrace

slide 97:
Entry Arguments
The syscall entry arguments are available as
unsigned 64-bit ints, with the names: arg0,
arg1, arg2, ...
These arguments can be casted if need be
to the appropriate types. eg, (int)arg0
• Typed versions may be provided as args[0],
args[1], args[2], ...
Arguments are listed in the syscall's man
page

slide 98:
Entry Argument Examples
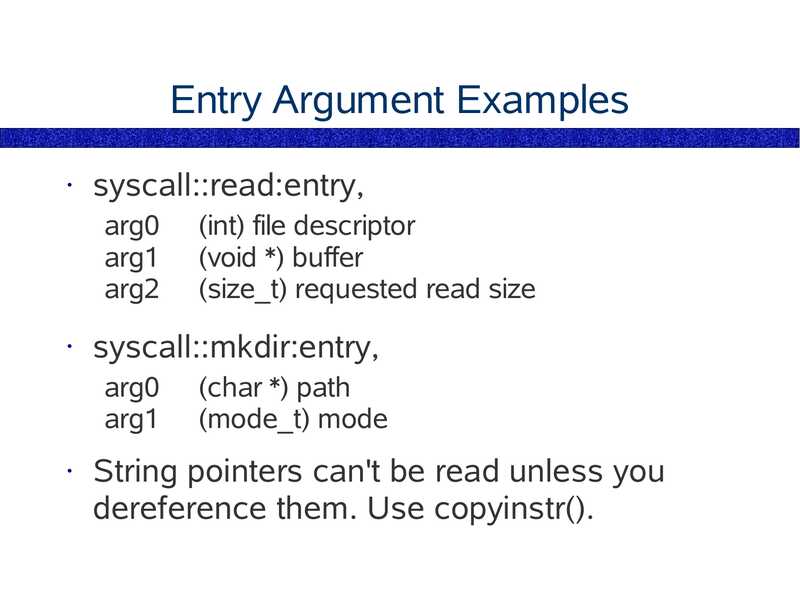
syscall::read:entry,
arg0
arg1
arg2
syscall::mkdir:entry,
arg0
arg1
(int) file descriptor
(void *) buffer
(size_t) requested read size
(char *) path
(mode_t) mode
String pointers can't be read unless you
dereference them. Use copyinstr().

slide 99:
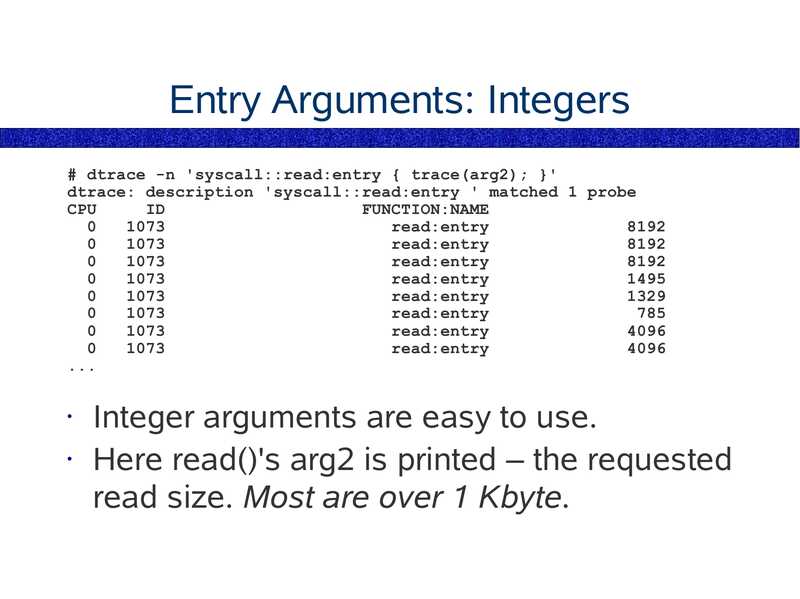
Entry Arguments: Integers
# dtrace -n 'syscall::read:entry { trace(arg2); }'
dtrace: description 'syscall::read:entry ' matched 1 probe
CPU
FUNCTION:NAME
read:entry
read:entry
read:entry
read:entry
read:entry
read:entry
read:entry
read:entry
Integer arguments are easy to use.
• Here read()'s arg2 is printed – the requested
read size. Most are over 1 Kbyte.

slide 100:
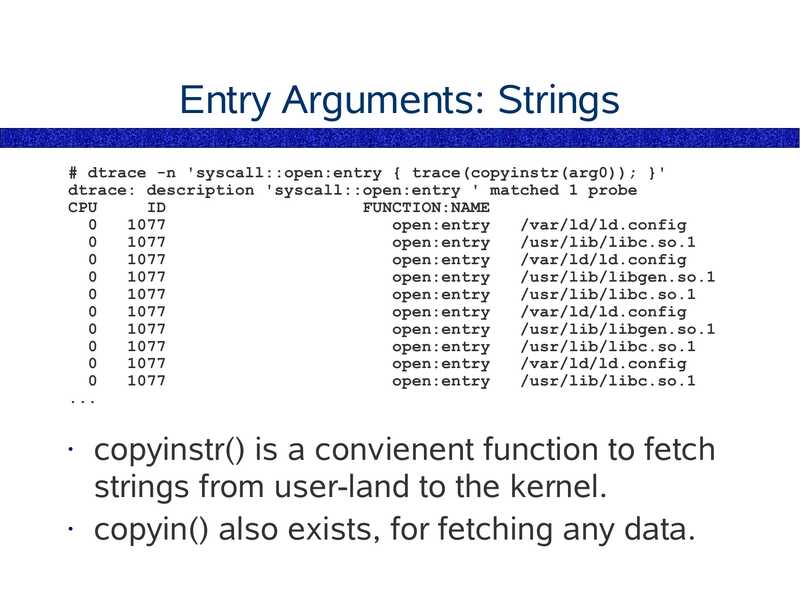
Entry Arguments: Strings
# dtrace -n 'syscall::open:entry { trace(copyinstr(arg0)); }'
dtrace: description 'syscall::open:entry ' matched 1 probe
CPU
FUNCTION:NAME
open:entry
/var/ld/ld.config
open:entry
/usr/lib/libc.so.1
open:entry
/var/ld/ld.config
open:entry
/usr/lib/libgen.so.1
open:entry
/usr/lib/libc.so.1
open:entry
/var/ld/ld.config
open:entry
/usr/lib/libgen.so.1
open:entry
/usr/lib/libc.so.1
open:entry
/var/ld/ld.config
open:entry
/usr/lib/libc.so.1
copyinstr() is a convienent function to fetch
strings from user-land to the kernel.
• copyin() also exists, for fetching any data.

slide 101:
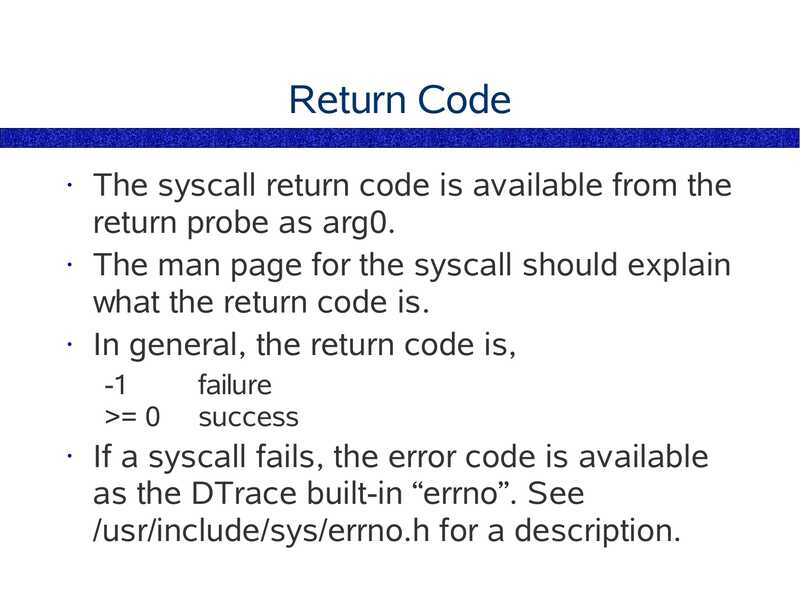
Return Code
The syscall return code is available from the
return probe as arg0.
• The man page for the syscall should explain
what the return code is.
• In general, the return code is,
>gt;= 0
failure
success
If a syscall fails, the error code is available
as the DTrace built-in “errno”. See
/usr/include/sys/errno.h for a description.

slide 102:
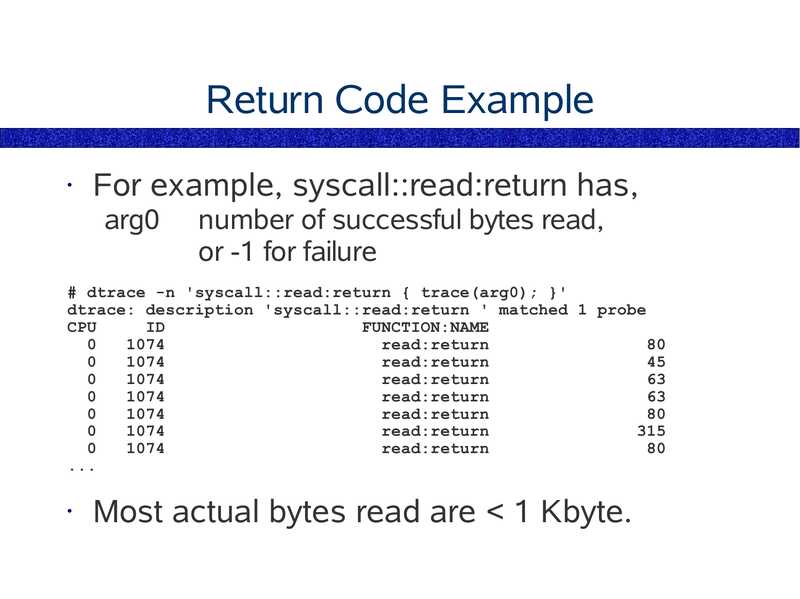
Return Code Example
For example, syscall::read:return has,
arg0
number of successful bytes read,
or -1 for failure
# dtrace -n 'syscall::read:return { trace(arg0); }'
dtrace: description 'syscall::read:return ' matched 1 probe
CPU
FUNCTION:NAME
read:return
read:return
read:return
read:return
read:return
read:return
read:return
Most actual bytes read are
slide 103:
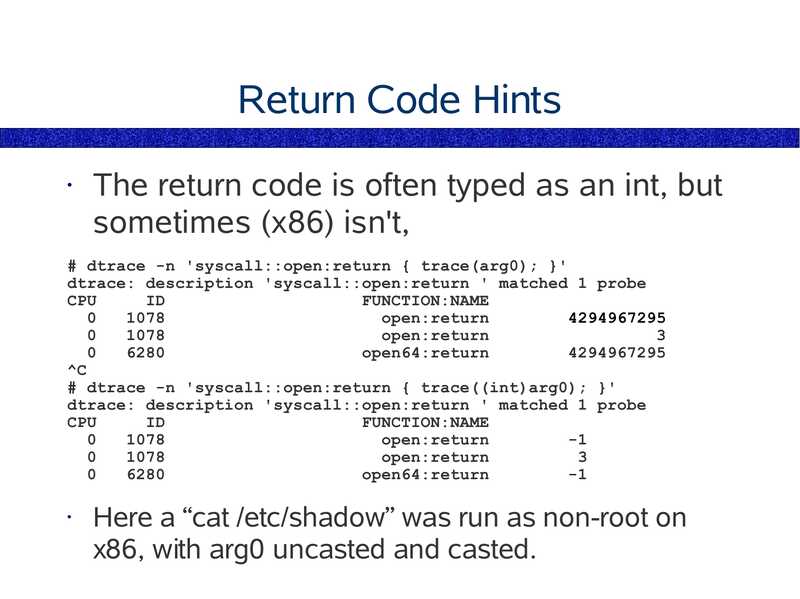
Return Code Hints
The return code is often typed as an int, but
sometimes (x86) isn't,
# dtrace -n 'syscall::open:return { trace(arg0); }'
dtrace: description 'syscall::open:return ' matched 1 probe
CPU
FUNCTION:NAME
open:return
open:return
open64:return
# dtrace -n 'syscall::open:return { trace((int)arg0); }'
dtrace: description 'syscall::open:return ' matched 1 probe
CPU
FUNCTION:NAME
open:return
open:return
open64:return
Here a “cat /etc/shadow” was run as non-root on
x86, with arg0 uncasted and casted.

slide 104:
Questions
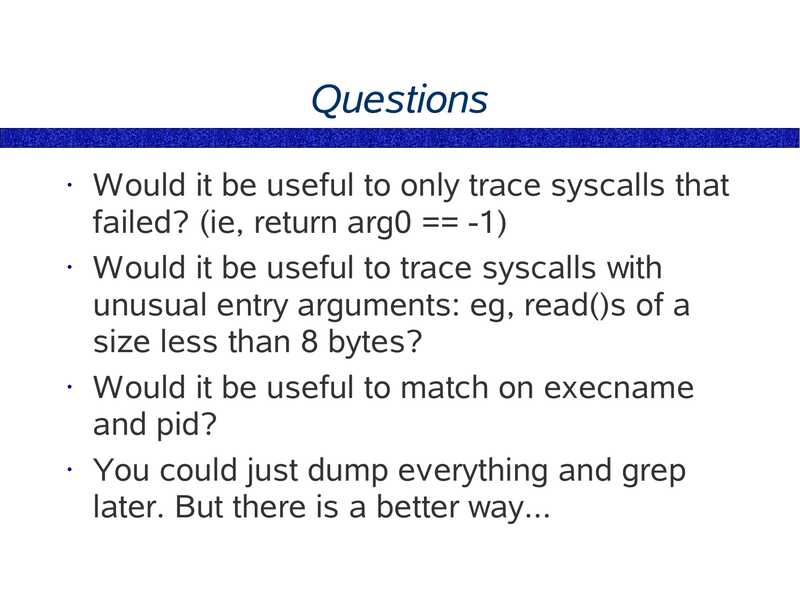
Would it be useful to only trace syscalls that
failed? (ie, return arg0 == -1)
• Would it be useful to trace syscalls with
unusual entry arguments: eg, read()s of a
size less than 8 bytes?
• Would it be useful to match on execname
and pid?
• You could just dump everything and grep
later. But there is a better way...

slide 105:
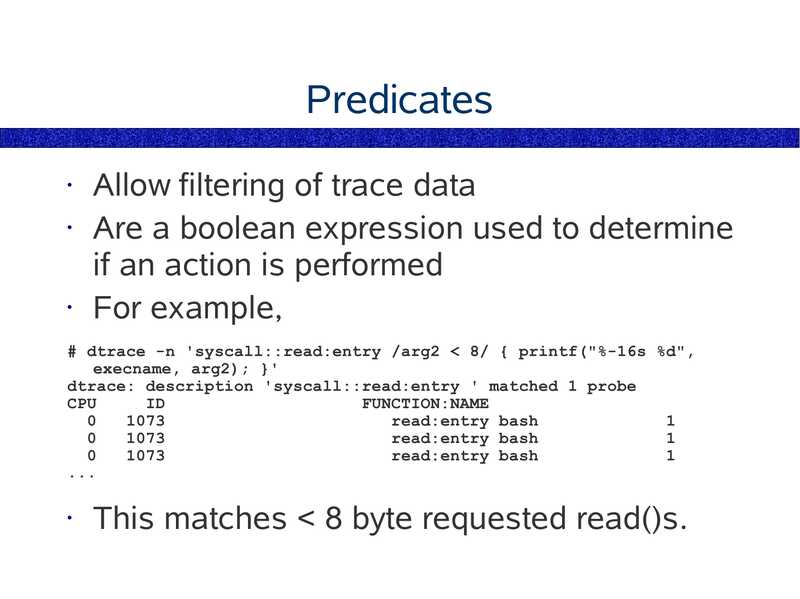
Predicates
Allow filtering of trace data
• Are a boolean expression used to determine
if an action is performed
• For example,
# dtrace -n 'syscall::read:entry /arg2
slide 106:
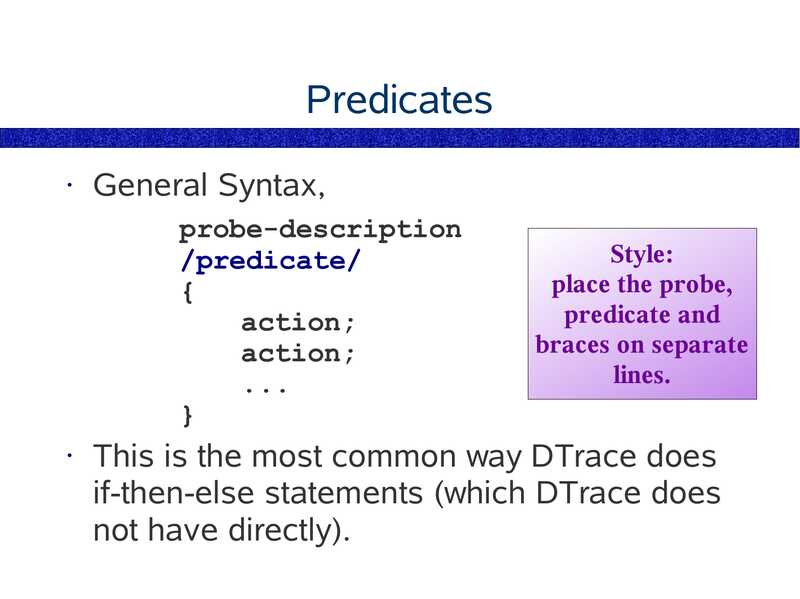
Predicates
General Syntax,
probe-description
/predicate/
action;
action;
Style:
place the probe,
predicate and
braces on separate
lines.
This is the most common way DTrace does
if-then-else statements (which DTrace does
not have directly).

slide 107:
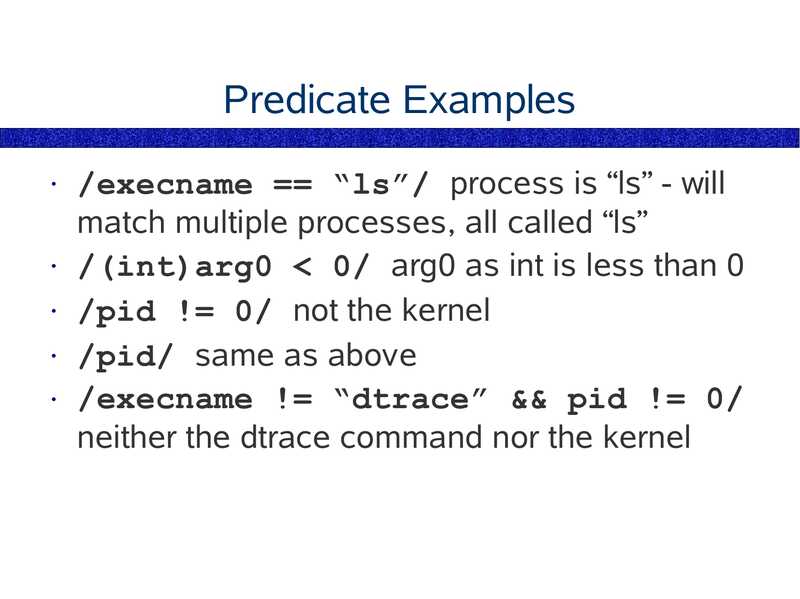
Predicate Examples
/execname == “ls”/ process is “ls” - will
match multiple processes, all called “ls”
• /(int)arg0
slide 108:
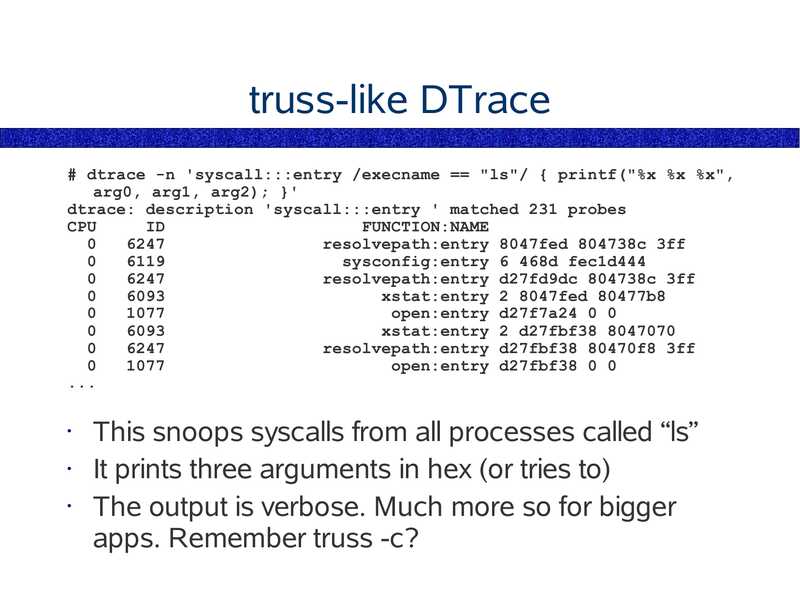
truss-like DTrace
# dtrace -n 'syscall:::entry /execname == "ls"/ { printf("%x %x %x",
arg0, arg1, arg2); }'
dtrace: description 'syscall:::entry ' matched 231 probes
CPU
FUNCTION:NAME
resolvepath:entry 8047fed 804738c 3ff
sysconfig:entry 6 468d fec1d444
resolvepath:entry d27fd9dc 804738c 3ff
xstat:entry 2 8047fed 80477b8
open:entry d27f7a24 0 0
xstat:entry 2 d27fbf38 8047070
resolvepath:entry d27fbf38 80470f8 3ff
open:entry d27fbf38 0 0
This snoops syscalls from all processes called “ls”
It prints three arguments in hex (or tries to)
The output is verbose. Much more so for bigger
apps. Remember truss -c?

slide 109:
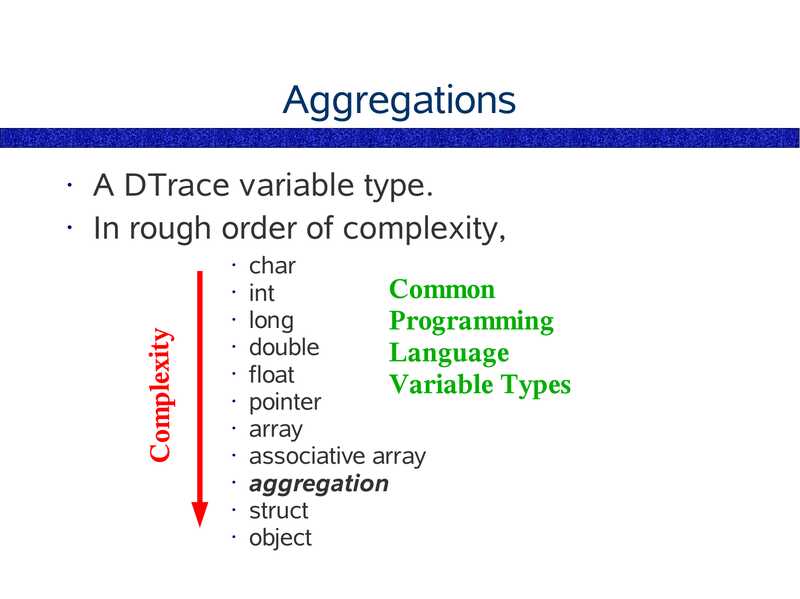
Aggregations
A DTrace variable type.
• In rough order of complexity,
char
• int
Common
• long
Programming
• double
Language
• float
Variable Types
• pointer
• array
• associative array
• aggregation
• struct
• object
Complexity

slide 110:
Why Aggregations First
Aggregations are introduced early because
we want you to use them as much as
possible!
• Their advantages are:
They summarise the data in often the most
appropriate way – providing the final report
• Aggregations are fast – they do not lock between
CPUs in the same way as other data types

slide 111:
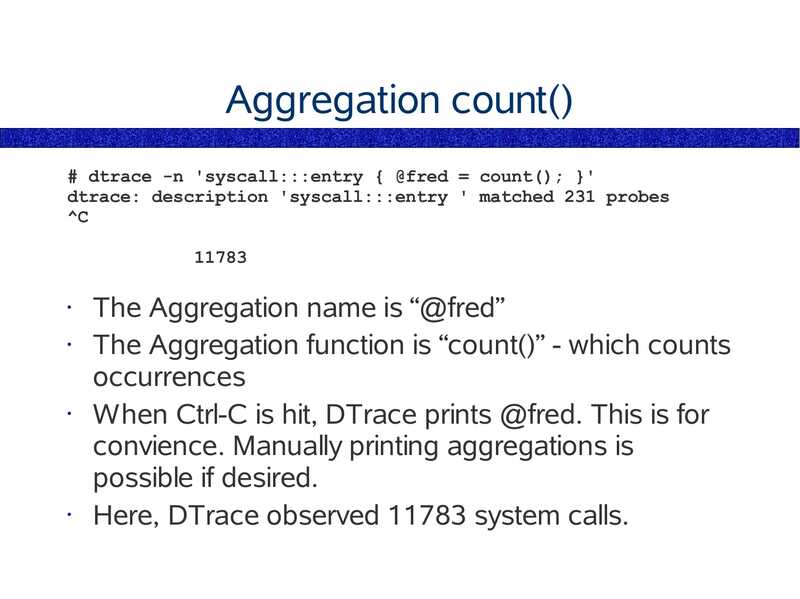
Aggregation count()
# dtrace -n 'syscall:::entry { @fred = count(); }'
dtrace: description 'syscall:::entry ' matched 231 probes
The Aggregation name is “@fred”
The Aggregation function is “count()” - which counts
occurrences
When Ctrl-C is hit, DTrace prints @fred. This is for
convience. Manually printing aggregations is
possible if desired.
Here, DTrace observed 11783 system calls.

slide 112:
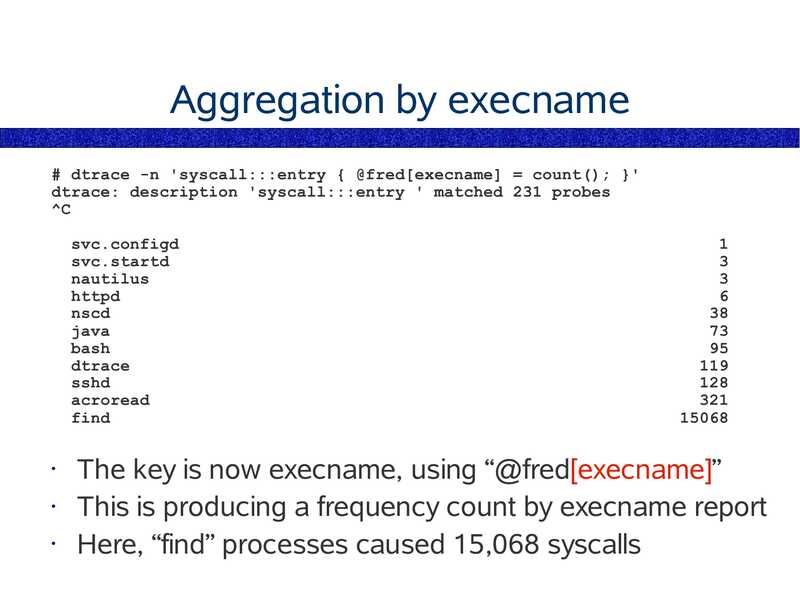
Aggregation by execname
# dtrace -n 'syscall:::entry { @fred[execname] = count(); }'
dtrace: description 'syscall:::entry ' matched 231 probes
svc.configd
svc.startd
nautilus
httpd
nscd
java
bash
dtrace
sshd
acroread
find
The key is now execname, using “@fred[execname]”
This is producing a frequency count by execname report
Here, “find” processes caused 15,068 syscalls

slide 113:
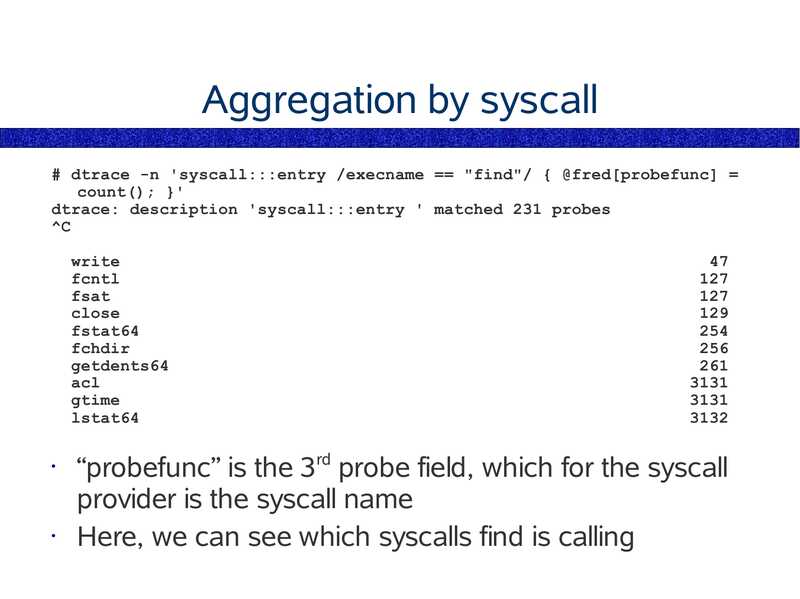
Aggregation by syscall
# dtrace -n 'syscall:::entry /execname == "find"/ { @fred[probefunc] =
count(); }'
dtrace: description 'syscall:::entry ' matched 231 probes
write
fcntl
fsat
close
fstat64
fchdir
getdents64
acl
gtime
lstat64
“probefunc” is the 3rd probe field, which for the syscall
provider is the syscall name
Here, we can see which syscalls find is calling

slide 114:
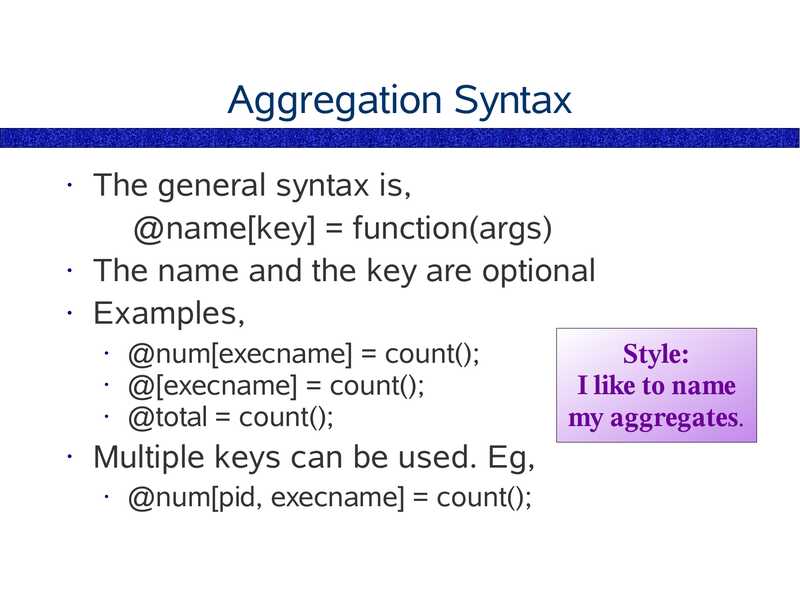
Aggregation Syntax
The general syntax is,
@name[key] = function(args)
• The name and the key are optional
• Examples,
@num[execname] = count();
• @[execname] = count();
• @total = count();
Multiple keys can be used. Eg,
@num[pid, execname] = count();
Style:
I like to name
my aggregates.

slide 115:
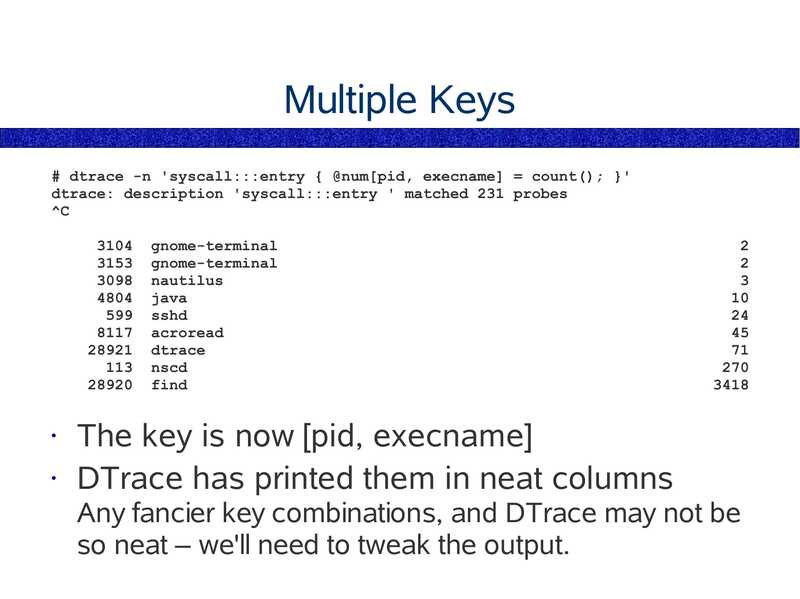
Multiple Keys
# dtrace -n 'syscall:::entry { @num[pid, execname] = count(); }'
dtrace: description 'syscall:::entry ' matched 231 probes
gnome-terminal
gnome-terminal
nautilus
java
sshd
acroread
dtrace
nscd
find
The key is now [pid, execname]
• DTrace has printed them in neat columns
Any fancier key combinations, and DTrace may not be
so neat – we'll need to tweak the output.

slide 116:
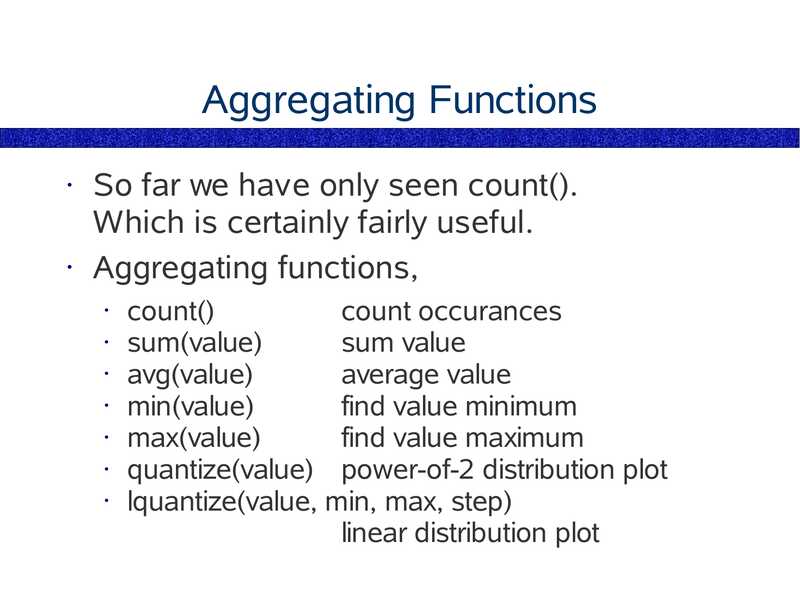
Aggregating Functions
So far we have only seen count().
Which is certainly fairly useful.
• Aggregating functions,
count()
count occurances
• sum(value)
sum value
• avg(value)
average value
• min(value)
find value minimum
• max(value)
find value maximum
• quantize(value)
power-of-2 distribution plot
• lquantize(value, min, max, step)
linear distribution plot

slide 117:
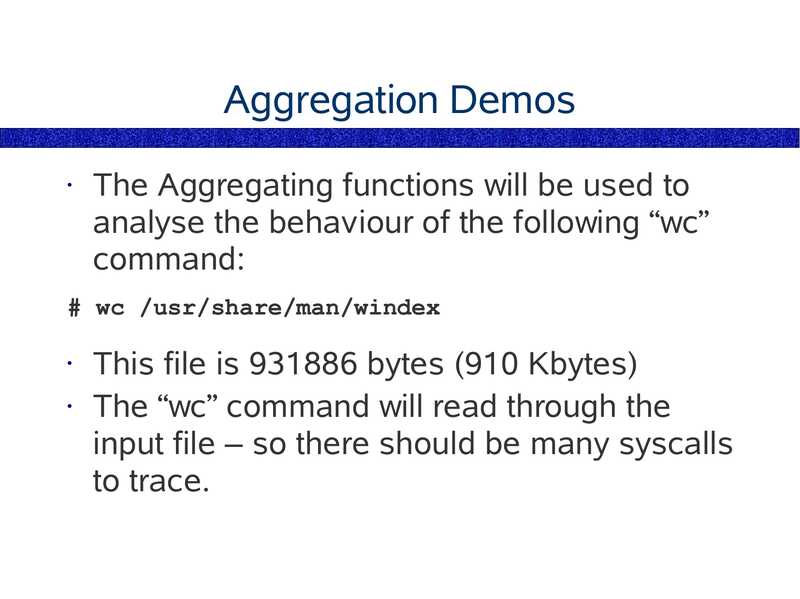
Aggregation Demos
The Aggregating functions will be used to
analyse the behaviour of the following “wc”
command:
# wc /usr/share/man/windex
This file is 931886 bytes (910 Kbytes)
• The “wc” command will read through the
input file – so there should be many syscalls
to trace.

slide 118:
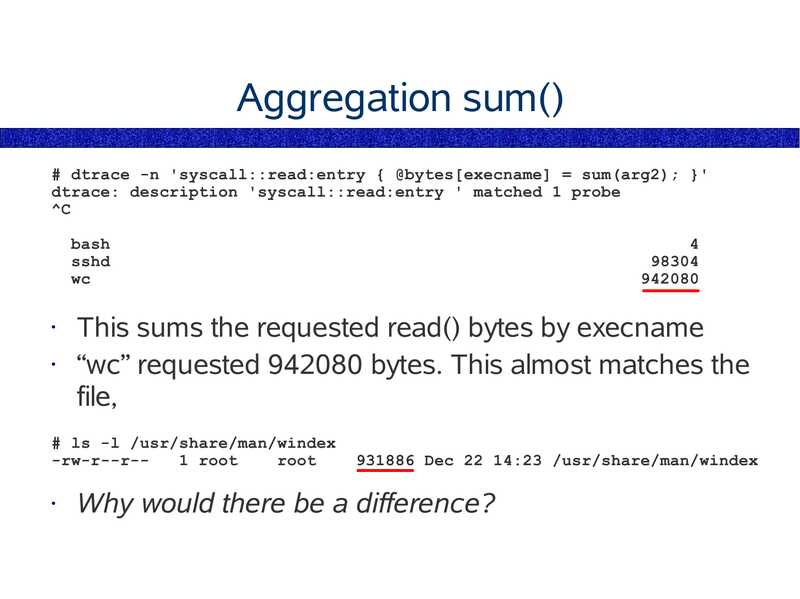
Aggregation sum()
# dtrace -n 'syscall::read:entry { @bytes[execname] = sum(arg2); }'
dtrace: description 'syscall::read:entry ' matched 1 probe
bash
sshd
This sums the requested read() bytes by execname
“wc” requested 942080 bytes. This almost matches the
file,
# ls -l /usr/share/man/windex
-rw-r--r-1 root
root
931886 Dec 22 14:23 /usr/share/man/windex
Why would there be a difference?

slide 119:
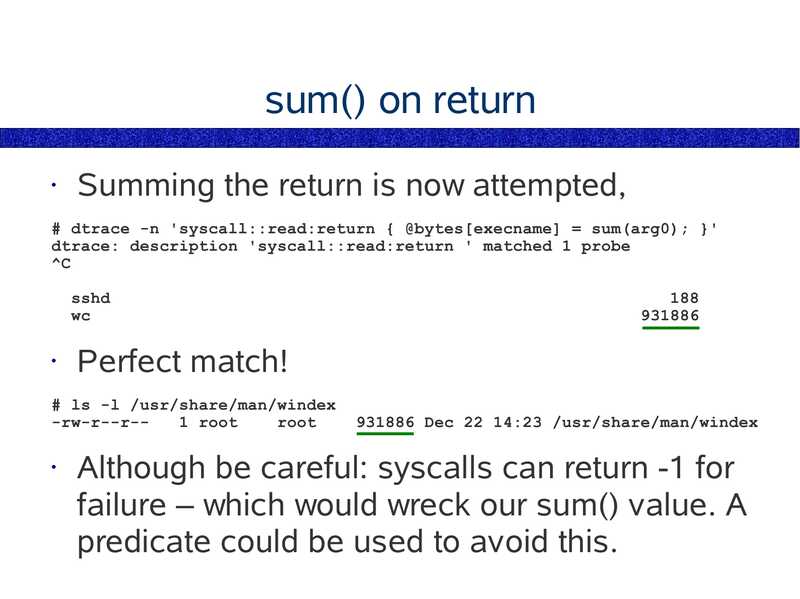
sum() on return
Summing the return is now attempted,
# dtrace -n 'syscall::read:return { @bytes[execname] = sum(arg0); }'
dtrace: description 'syscall::read:return ' matched 1 probe
sshd
Perfect match!
# ls -l /usr/share/man/windex
-rw-r--r-1 root
root
931886 Dec 22 14:23 /usr/share/man/windex
Although be careful: syscalls can return -1 for
failure – which would wreck our sum() value. A
predicate could be used to avoid this.

slide 120:
Questions
What would be the size of each read?
• How many reads would occur?

slide 121:
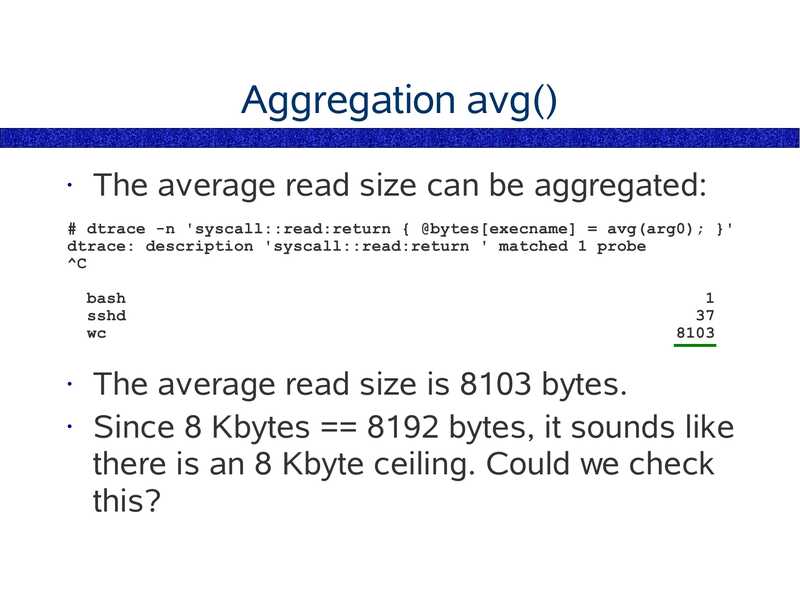
Aggregation avg()
The average read size can be aggregated:
# dtrace -n 'syscall::read:return { @bytes[execname] = avg(arg0); }'
dtrace: description 'syscall::read:return ' matched 1 probe
bash
sshd
The average read size is 8103 bytes.
• Since 8 Kbytes == 8192 bytes, it sounds like
there is an 8 Kbyte ceiling. Could we check
this?

slide 122:
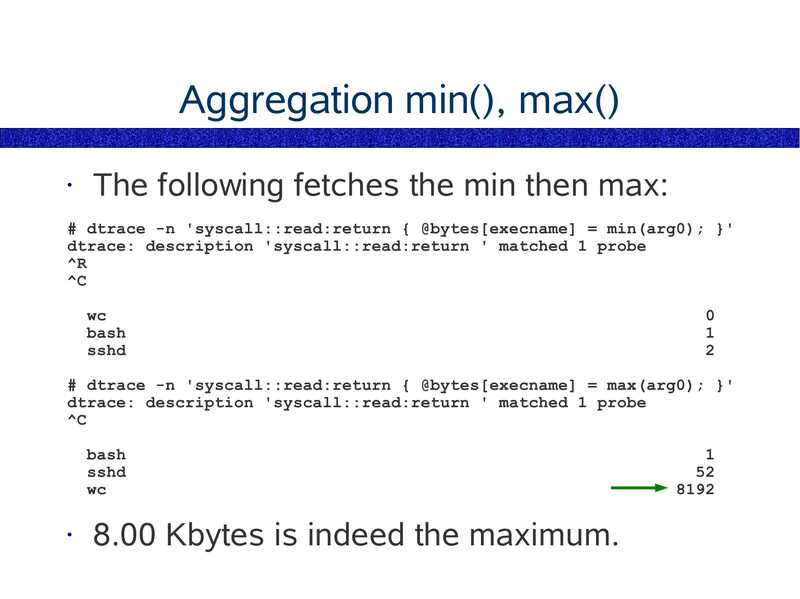
Aggregation min(), max()
The following fetches the min then max:
# dtrace -n 'syscall::read:return { @bytes[execname] = min(arg0); }'
dtrace: description 'syscall::read:return ' matched 1 probe
bash
sshd
# dtrace -n 'syscall::read:return { @bytes[execname] = max(arg0); }'
dtrace: description 'syscall::read:return ' matched 1 probe
bash
sshd
8.00 Kbytes is indeed the maximum.

slide 123:
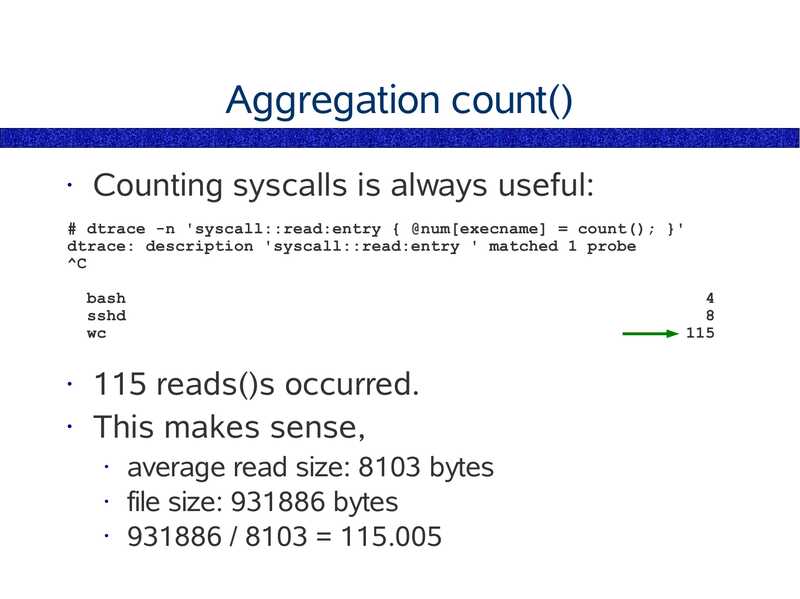
Aggregation count()
Counting syscalls is always useful:
# dtrace -n 'syscall::read:entry { @num[execname] = count(); }'
dtrace: description 'syscall::read:entry ' matched 1 probe
bash
sshd
115 reads()s occurred.
• This makes sense,
average read size: 8103 bytes
• file size: 931886 bytes
• 931886 / 8103 = 115.005

slide 124:
Aggregations so far
By running,
count()
• sum()
• min(), max()
• avg()
we have learnt much about the behaviour of
the wc command.
• Similar knowledge can be gained much
more quickly using quantize().

slide 125:
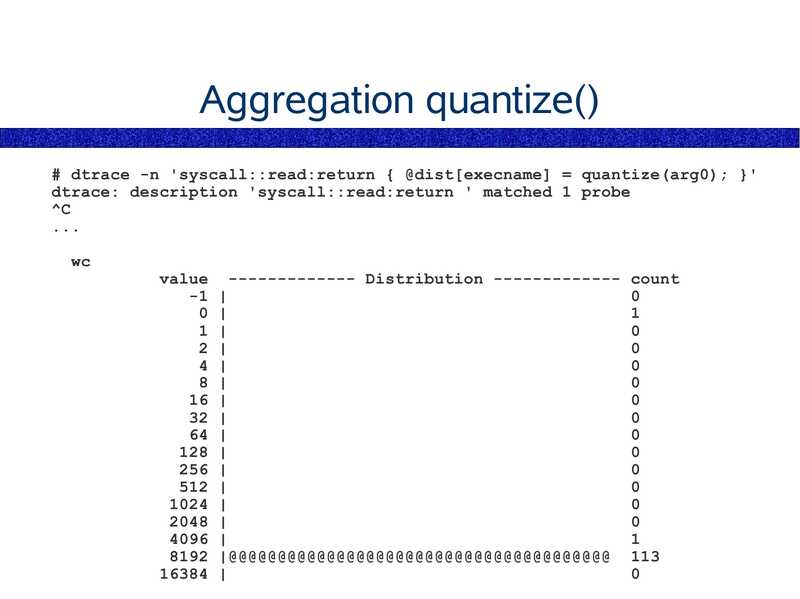
Aggregation quantize()
# dtrace -n 'syscall::read:return { @dist[execname] = quantize(arg0); }'
dtrace: description 'syscall::read:return ' matched 1 probe
value ------------- Distribution ------------- count
-1 |
0 |
1 |
2 |
4 |
8 |
16 |
32 |
64 |
128 |
256 |
512 |
1024 |
2048 |
4096 |
8192 |@@@@@@@@@@@@@@@@@@@@@@@@@@@@@@@@@@@@@@@ 113
16384 |

slide 126:
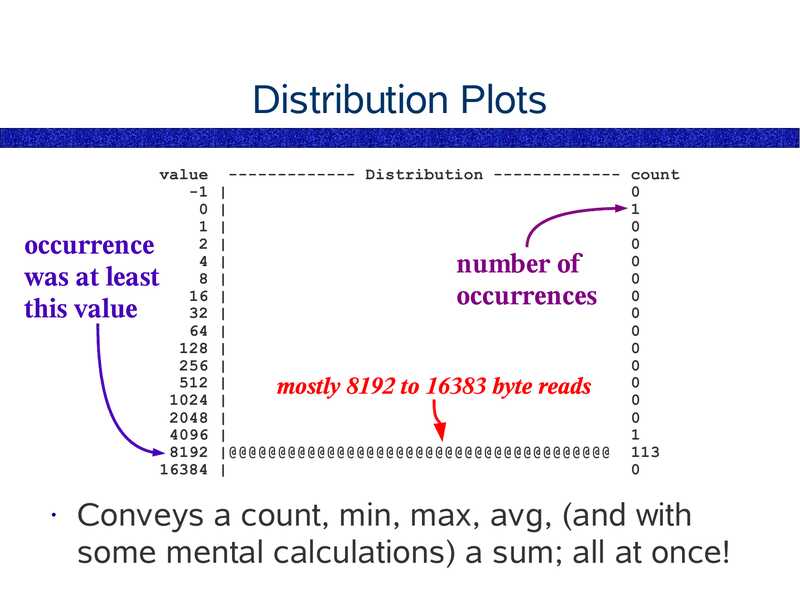
Distribution Plots
value ------------- Distribution ------------- count
-1 |
0 |
1 |
2 |
4 |
8 |
16 |
32 |
64 |
128 |
256 |
512 |
mostly
byte
reads
1024 |
2048 |
4096 |
8192 |@@@@@@@@@@@@@@@@@@@@@@@@@@@@@@@@@@@@@@@ 113
16384 |
occurrence
was at least
this value
number of
occurrences
Conveys a count, min, max, avg, (and with
some mental calculations) a sum; all at once!

slide 127:
Aggregation lquantize()
When power-of-2 distributions are not
suitable, lquantize provides linear
customisable distributions.
• The arguments are,
lquantize(value, min, max, step)

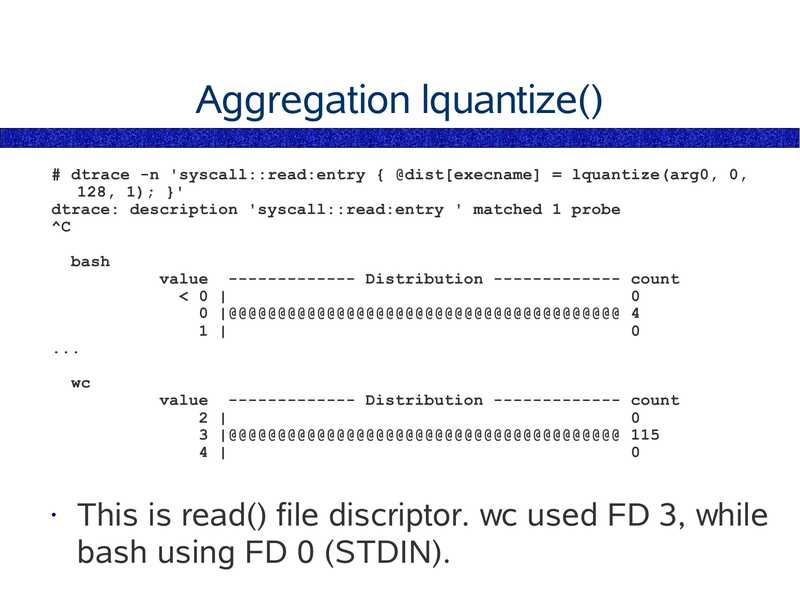
slide 128:
Aggregation lquantize()
# dtrace -n 'syscall::read:entry { @dist[execname] = lquantize(arg0, 0,
128, 1); }'
dtrace: description 'syscall::read:entry ' matched 1 probe
bash
value ------------- Distribution ------------- count

slide 129:
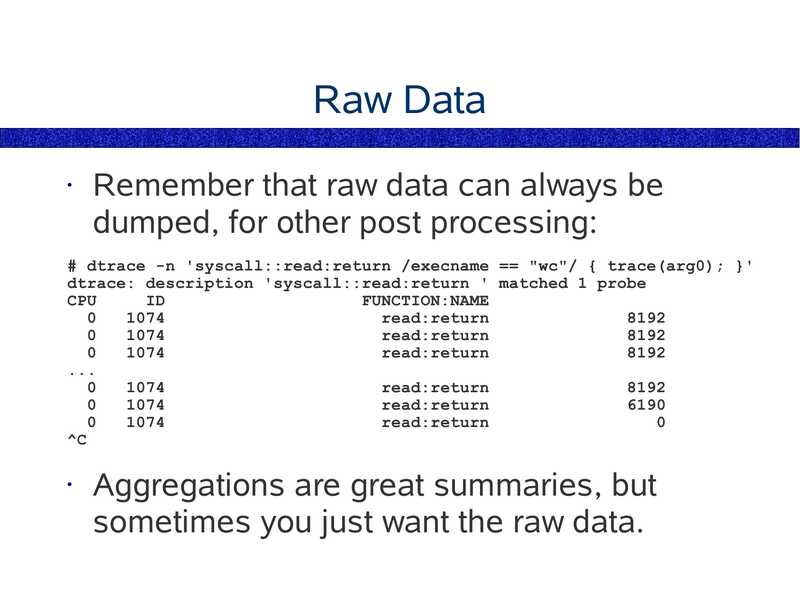
Raw Data
Remember that raw data can always be
dumped, for other post processing:
# dtrace -n 'syscall::read:return /execname == "wc"/ { trace(arg0); }'
dtrace: description 'syscall::read:return ' matched 1 probe
CPU
FUNCTION:NAME
read:return
read:return
read:return
read:return
read:return
read:return
Aggregations are great summaries, but
sometimes you just want the raw data.

slide 130:
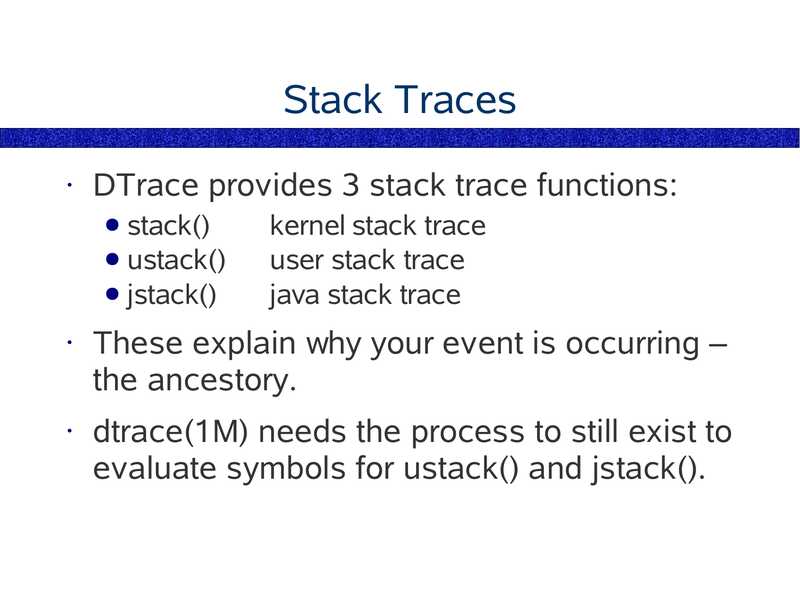
Stack Traces
DTrace provides 3 stack trace functions:
● stack()
● ustack()
● jstack()
kernel stack trace
user stack trace
java stack trace
These explain why your event is occurring –
the ancestory.
dtrace(1M) needs the process to still exist to
evaluate symbols for ustack() and jstack().

slide 131:
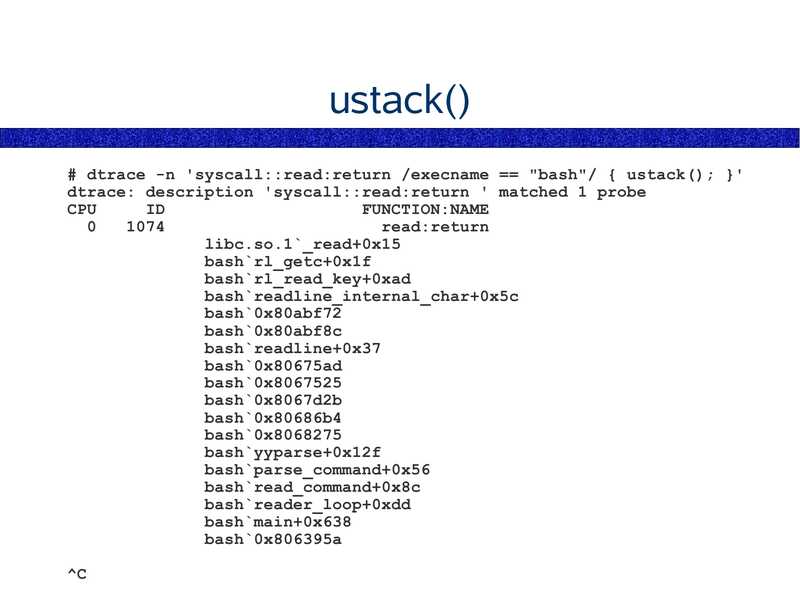
ustack()
# dtrace -n 'syscall::read:return /execname == "bash"/ { ustack(); }'
dtrace: description 'syscall::read:return ' matched 1 probe
CPU
FUNCTION:NAME
read:return
libc.so.1`_read+0x15
bash`rl_getc+0x1f
bash`rl_read_key+0xad
bash`readline_internal_char+0x5c
bash`0x80abf72
bash`0x80abf8c
bash`readline+0x37
bash`0x80675ad
bash`0x8067525
bash`0x8067d2b
bash`0x80686b4
bash`0x8068275
bash`yyparse+0x12f
bash`parse_command+0x56
bash`read_command+0x8c
bash`reader_loop+0xdd
bash`main+0x638
bash`0x806395a

slide 132:
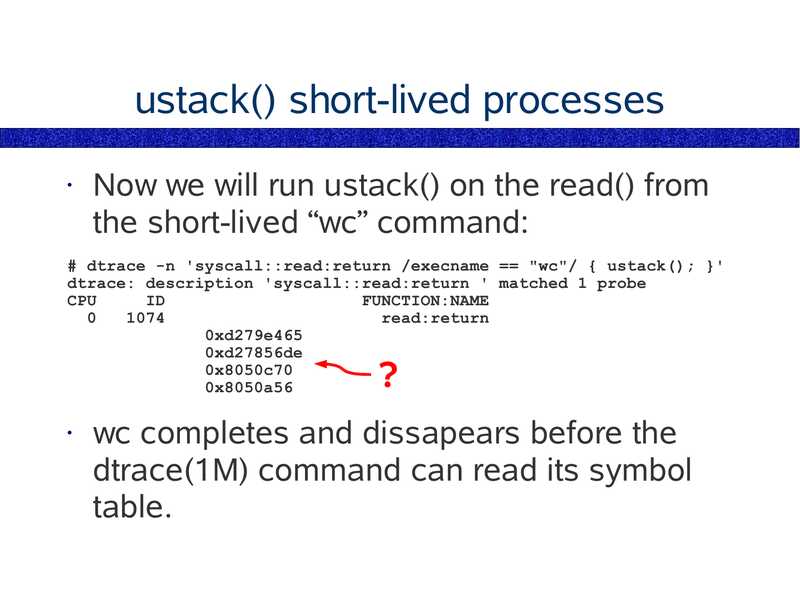
ustack() short-lived processes
Now we will run ustack() on the read() from
the short-lived “wc” command:
# dtrace -n 'syscall::read:return /execname == "wc"/ { ustack(); }'
dtrace: description 'syscall::read:return ' matched 1 probe
CPU
FUNCTION:NAME
read:return
0xd279e465
0xd27856de
0x8050c70
0x8050a56
wc completes and dissapears before the
dtrace(1M) command can read its symbol
table.

slide 133:
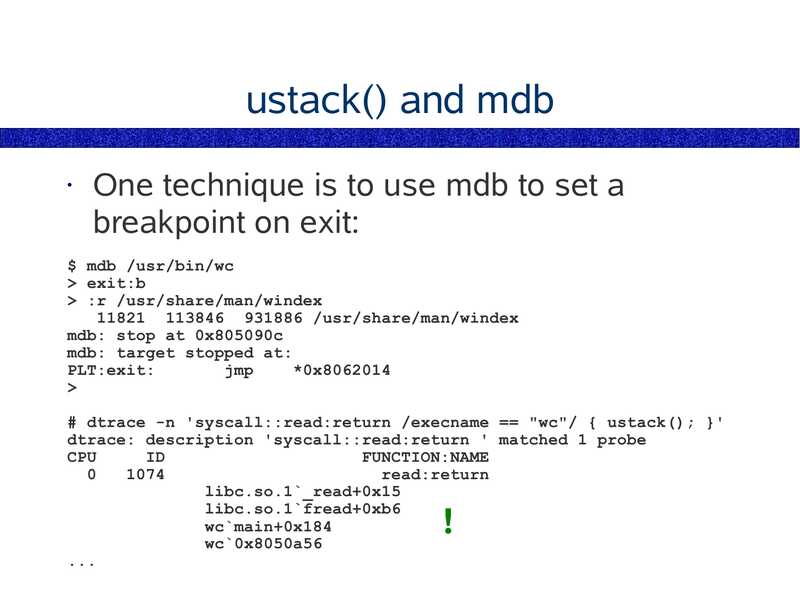
ustack() and mdb
One technique is to use mdb to set a
breakpoint on exit:
$ mdb /usr/bin/wc
>gt; exit:b
>gt; :r /usr/share/man/windex
11821 113846 931886 /usr/share/man/windex
mdb: stop at 0x805090c
mdb: target stopped at:
PLT:exit:
jmp
*0x8062014
>gt;
# dtrace -n 'syscall::read:return /execname == "wc"/ { ustack(); }'
dtrace: description 'syscall::read:return ' matched 1 probe
CPU
FUNCTION:NAME
read:return
libc.so.1`_read+0x15
libc.so.1`fread+0xb6
wc`main+0x184
wc`0x8050a56

slide 134:
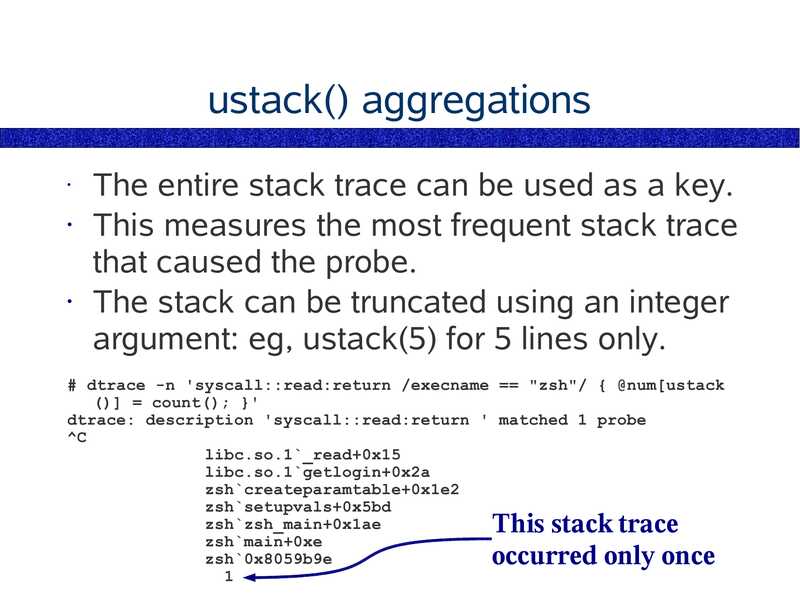
ustack() aggregations
The entire stack trace can be used as a key.
• This measures the most frequent stack trace
that caused the probe.
• The stack can be truncated using an integer
argument: eg, ustack(5) for 5 lines only.
# dtrace -n 'syscall::read:return /execname == "zsh"/ { @num[ustack
()] = count(); }'
dtrace: description 'syscall::read:return ' matched 1 probe
libc.so.1`_read+0x15
libc.so.1`getlogin+0x2a
zsh`createparamtable+0x1e2
zsh`setupvals+0x5bd
zsh`zsh_main+0x1ae
zsh`main+0xe
zsh`0x8059b9e
This stack trace
occurred only once

slide 135:
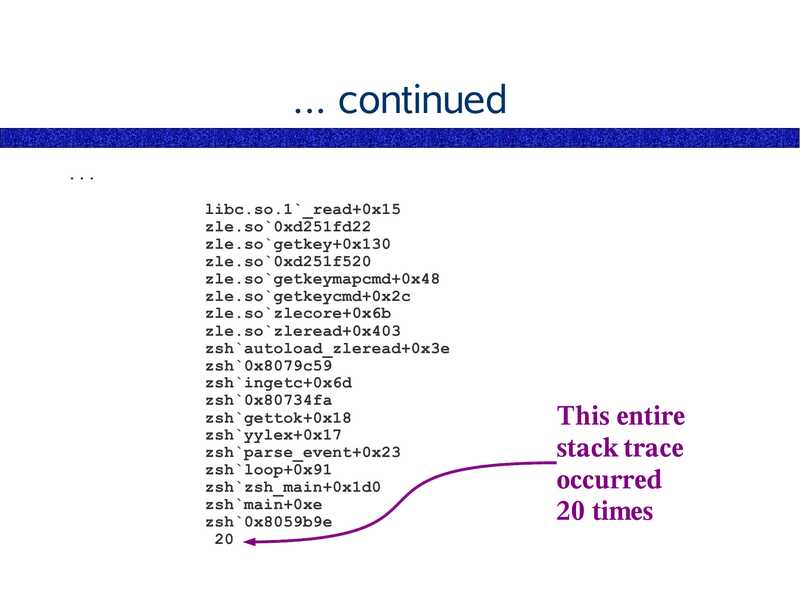
... continued
libc.so.1`_read+0x15
zle.so`0xd251fd22
zle.so`getkey+0x130
zle.so`0xd251f520
zle.so`getkeymapcmd+0x48
zle.so`getkeycmd+0x2c
zle.so`zlecore+0x6b
zle.so`zleread+0x403
zsh`autoload_zleread+0x3e
zsh`0x8079c59
zsh`ingetc+0x6d
zsh`0x80734fa
zsh`gettok+0x18
zsh`yylex+0x17
zsh`parse_event+0x23
zsh`loop+0x91
zsh`zsh_main+0x1d0
zsh`main+0xe
zsh`0x8059b9e
This entire
stack trace
occurred
20 times

slide 136:
Back to the Syscall Provider
So far we have just used the syscall provider
• There are some difficulties to be aware of:
when tracing writes – be aware that there is
write(), writev(), pwrite(), pwrite64()
• when tracing reads – be aware that there is
read(), readv(), pread(), pread64()
There is also readlink() - for symlinks
• other variants exist. open(), open64()...
readv() and writev() cause problems –
fetching the size from an iovec isn't easy

slide 137:
sysinfo Provider Intro
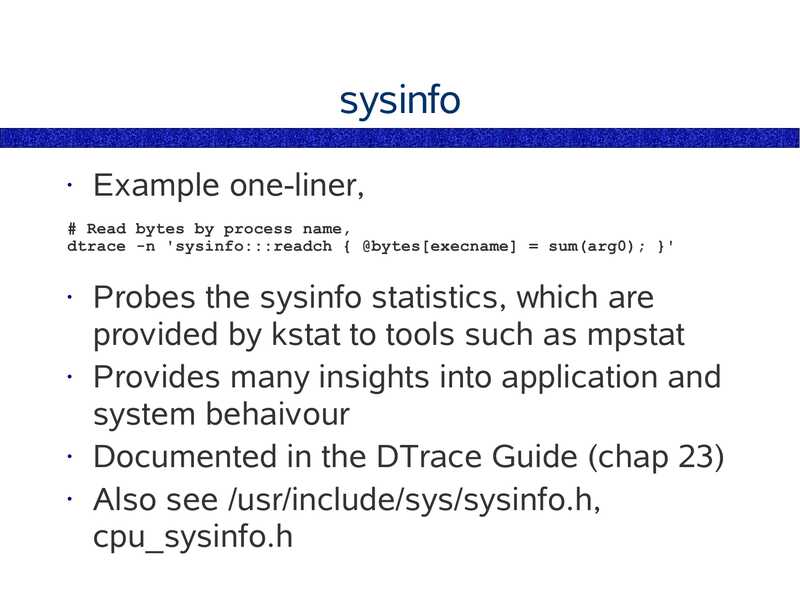
sysinfo provides probes that trace regular
system activity
• sysinfo:::readch traces all the read variants,
and provides the successful bytes read as
arg0
• sysinfo:::writech traces all the write variants,
and provides the successful bytes written as
arg0
• Don't need to worry about syscall return of -1

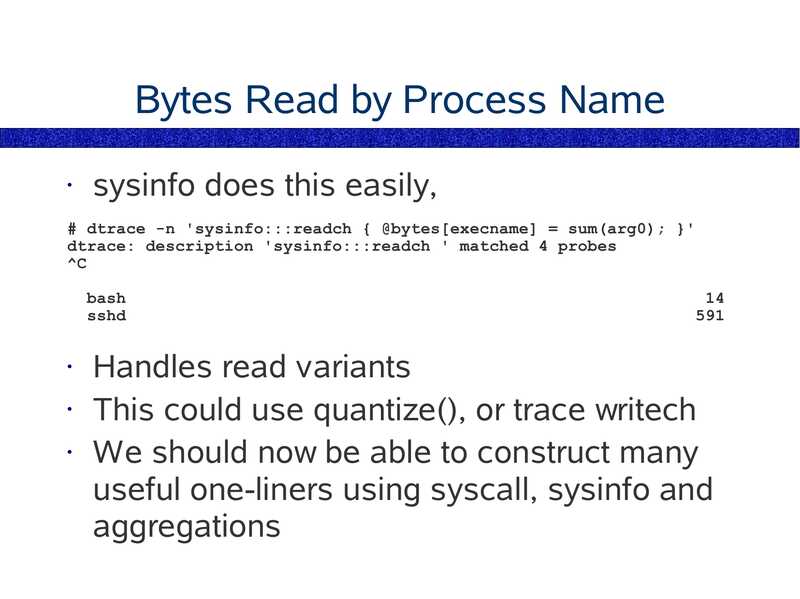
slide 138:
Bytes Read by Process Name
sysinfo does this easily,
# dtrace -n 'sysinfo:::readch { @bytes[execname] = sum(arg0); }'
dtrace: description 'sysinfo:::readch ' matched 4 probes
bash
sshd
Handles read variants
• This could use quantize(), or trace writech
• We should now be able to construct many
useful one-liners using syscall, sysinfo and
aggregations

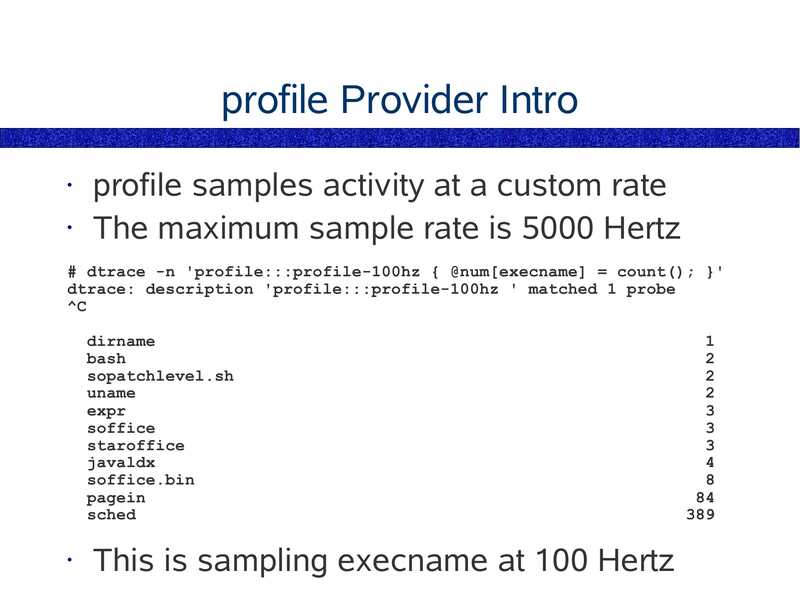
slide 139:
profile Provider Intro
profile samples activity at a custom rate
• The maximum sample rate is 5000 Hertz
# dtrace -n 'profile:::profile-100hz { @num[execname] = count(); }'
dtrace: description 'profile:::profile-100hz ' matched 1 probe
dirname
bash
sopatchlevel.sh
uname
expr
soffice
staroffice
javaldx
soffice.bin
pagein
sched
This is sampling execname at 100 Hertz

slide 140:
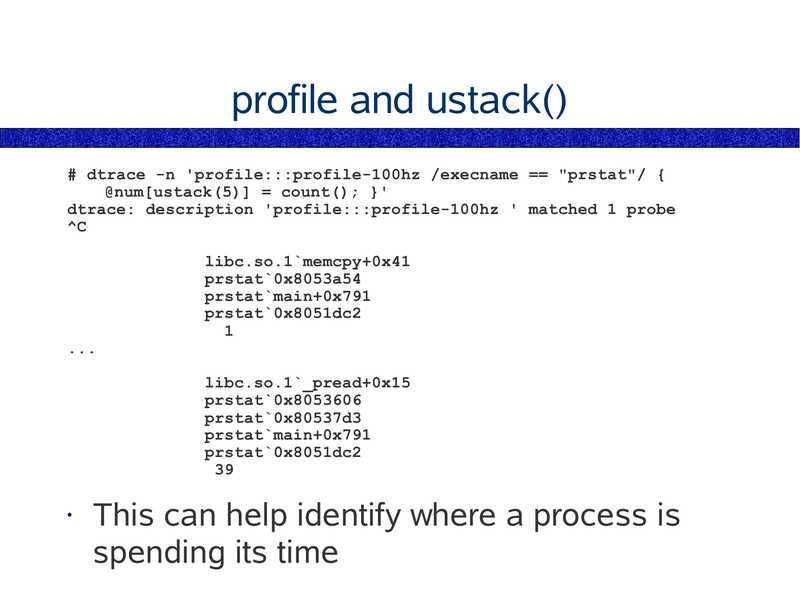
profile and ustack()
# dtrace -n 'profile:::profile-100hz /execname == "prstat"/ {
@num[ustack(5)] = count(); }'
dtrace: description 'profile:::profile-100hz ' matched 1 probe
libc.so.1`memcpy+0x41
prstat`0x8053a54
prstat`main+0x791
prstat`0x8051dc2
libc.so.1`_pread+0x15
prstat`0x8053606
prstat`0x80537d3
prstat`main+0x791
prstat`0x8051dc2
This can help identify where a process is
spending its time

slide 141:
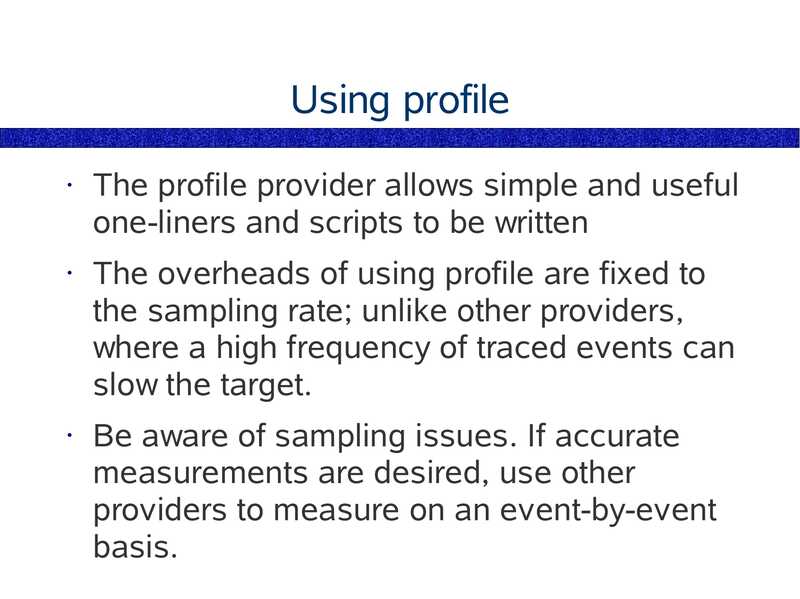
Using profile
The profile provider allows simple and useful
one-liners and scripts to be written
The overheads of using profile are fixed to
the sampling rate; unlike other providers,
where a high frequency of traced events can
slow the target.
Be aware of sampling issues. If accurate
measurements are desired, use other
providers to measure on an event-by-event
basis.

slide 142:
End of Chapter 3
Chapter 1 – Solaris 9 Performance Tools
Chapter 2 – Introducing DTrace
Chapter 3 – Command Line DTrace
Chapter 4 – DTrace one-liners
Chapter 5 – DTrace Mentality 1
Chapter 6 – Providers
Chapter 7 – The D Language
Chapter 8 – Advanced Scripting
Chapter 9 – The DTraceToolkit
Chapter 10 – DTrace Mentality 2

slide 143:
Chapter 4
DTrace one-liners
List useful one-liners
● Discuss when to use them

slide 144:
One-Liners Are Great
Remember “handy one-liners for sed”?
• One-liners can provide simple solutions to
common problems
• One-liners may not need the same arduous
approval procedures that scripts may require
• Someone once emailed me to say:
thanks for the DTraceToolkit. I got as far as the
one-liners, and found I could do everything I
needed to.
(so much for writing 100+ scripts!)

slide 145:
Useful One-Liners
The DTrace one-liners list is kept in the
DTraceToolkit under Docs/oneliners.txt
(http://www.opensolaris.org/os/community/dtrace/dtracetoolkit)
So far we have covered enough DTrace
syntax to understand most of them.
Many probes they use will be new, but
readily understandable in such a practical
context.
I will demonstrate many of these live...

slide 146:
One-liners #1
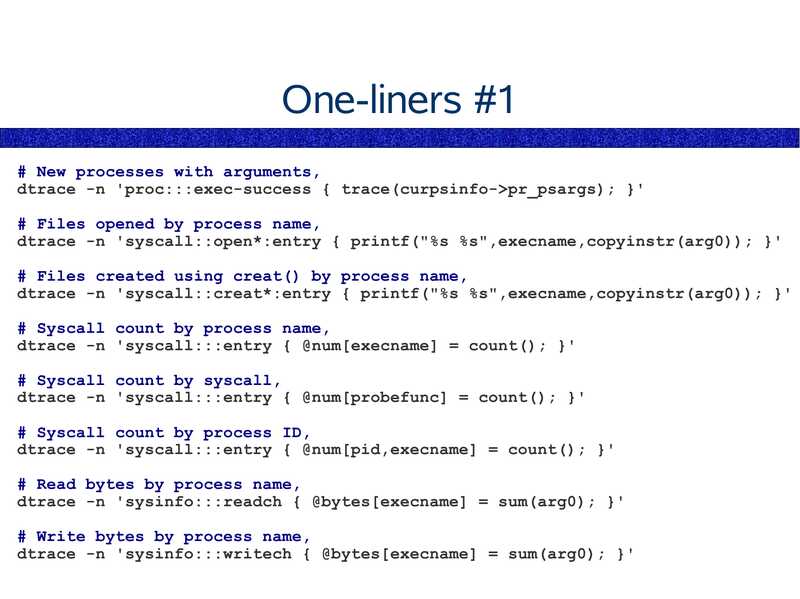
# New processes with arguments,
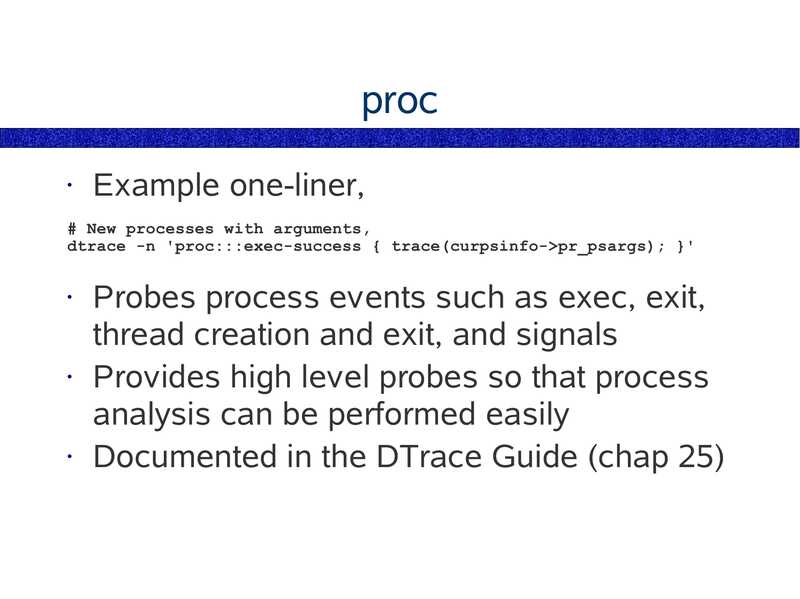
dtrace -n 'proc:::exec-success { trace(curpsinfo->gt;pr_psargs); }'
# Files opened by process name,
dtrace -n 'syscall::open*:entry { printf("%s %s",execname,copyinstr(arg0)); }'
# Files created using creat() by process name,
dtrace -n 'syscall::creat*:entry { printf("%s %s",execname,copyinstr(arg0)); }'
# Syscall count by process name,
dtrace -n 'syscall:::entry { @num[execname] = count(); }'
# Syscall count by syscall,
dtrace -n 'syscall:::entry { @num[probefunc] = count(); }'
# Syscall count by process ID,
dtrace -n 'syscall:::entry { @num[pid,execname] = count(); }'
# Read bytes by process name,
dtrace -n 'sysinfo:::readch { @bytes[execname] = sum(arg0); }'
# Write bytes by process name,
dtrace -n 'sysinfo:::writech { @bytes[execname] = sum(arg0); }'

slide 147:
One-liners #2
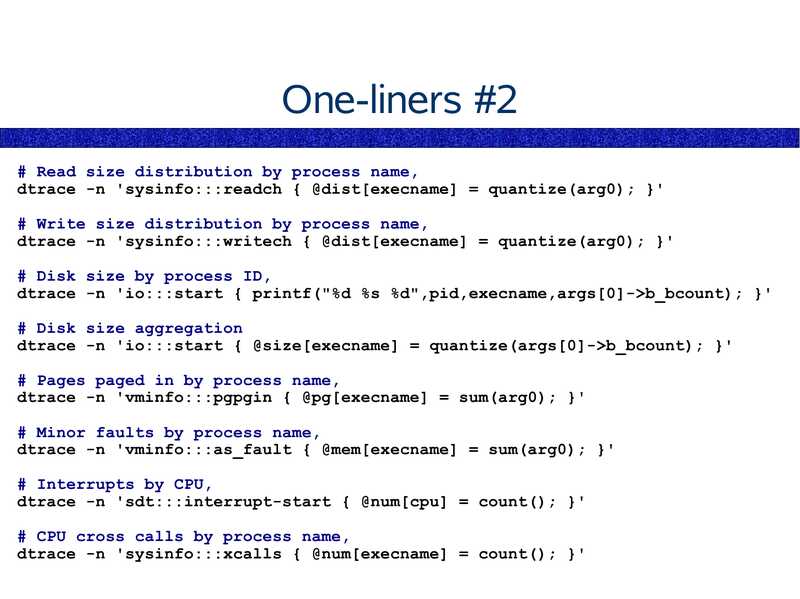
# Read size distribution by process name,
dtrace -n 'sysinfo:::readch { @dist[execname] = quantize(arg0); }'
# Write size distribution by process name,
dtrace -n 'sysinfo:::writech { @dist[execname] = quantize(arg0); }'
# Disk size by process ID,
dtrace -n 'io:::start { printf("%d %s %d",pid,execname,args[0]->gt;b_bcount); }'
# Disk size aggregation
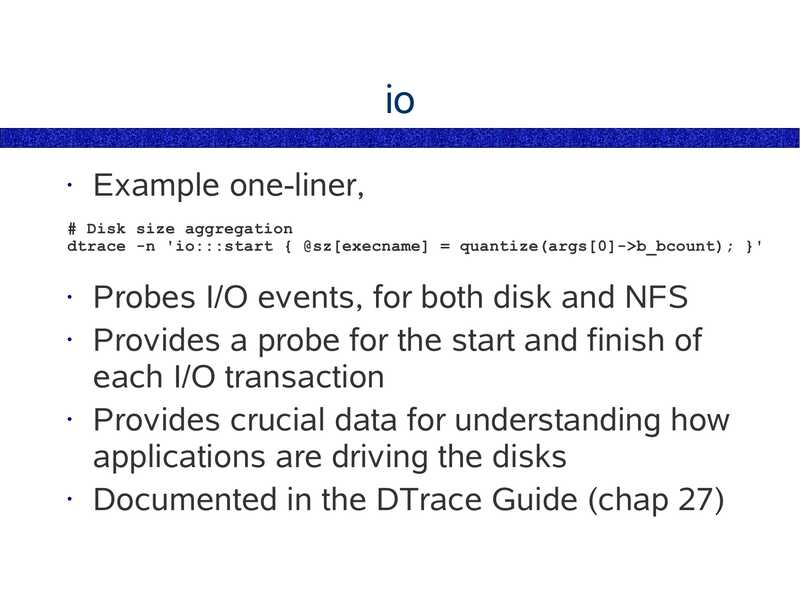
dtrace -n 'io:::start { @size[execname] = quantize(args[0]->gt;b_bcount); }'
# Pages paged in by process name,
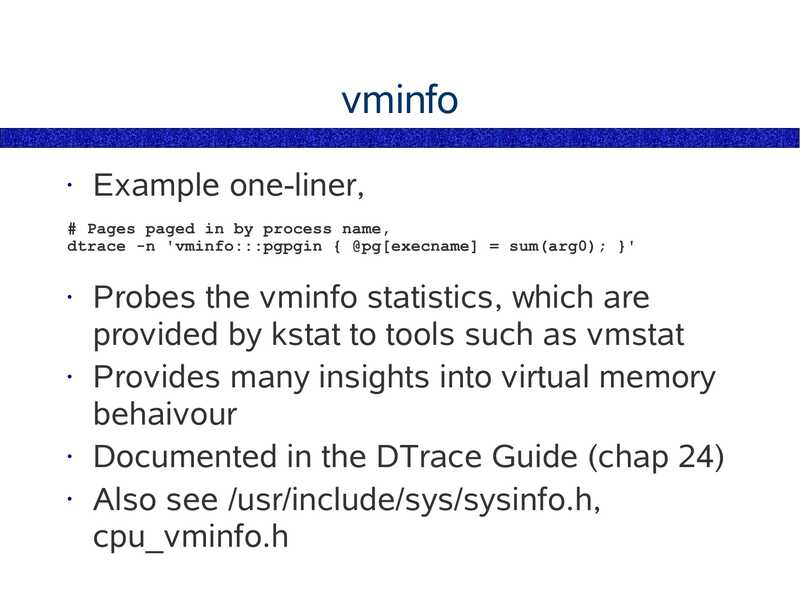
dtrace -n 'vminfo:::pgpgin { @pg[execname] = sum(arg0); }'
# Minor faults by process name,
dtrace -n 'vminfo:::as_fault { @mem[execname] = sum(arg0); }'
# Interrupts by CPU,
dtrace -n 'sdt:::interrupt-start { @num[cpu] = count(); }'
# CPU cross calls by process name,
dtrace -n 'sysinfo:::xcalls { @num[execname] = count(); }'

slide 148:
One-liners #3
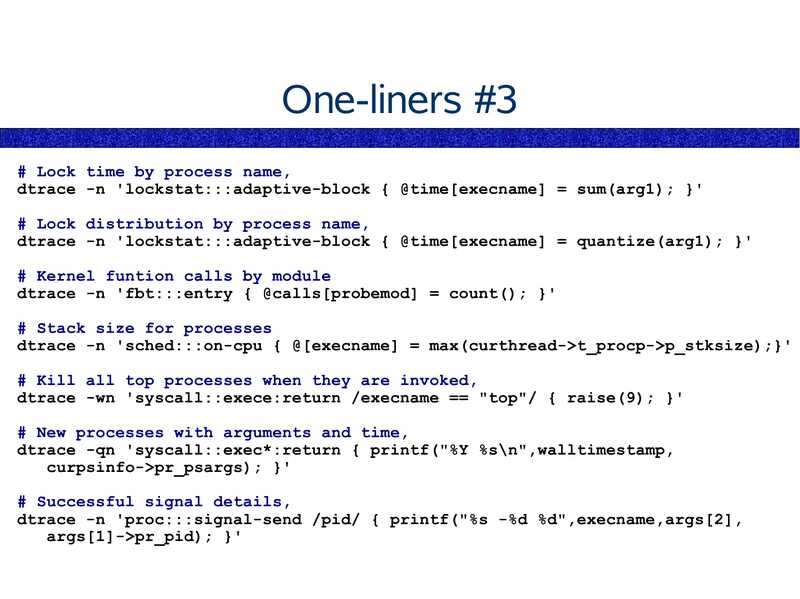
# Lock time by process name,
dtrace -n 'lockstat:::adaptive-block { @time[execname] = sum(arg1); }'
# Lock distribution by process name,
dtrace -n 'lockstat:::adaptive-block { @time[execname] = quantize(arg1); }'
# Kernel funtion calls by module
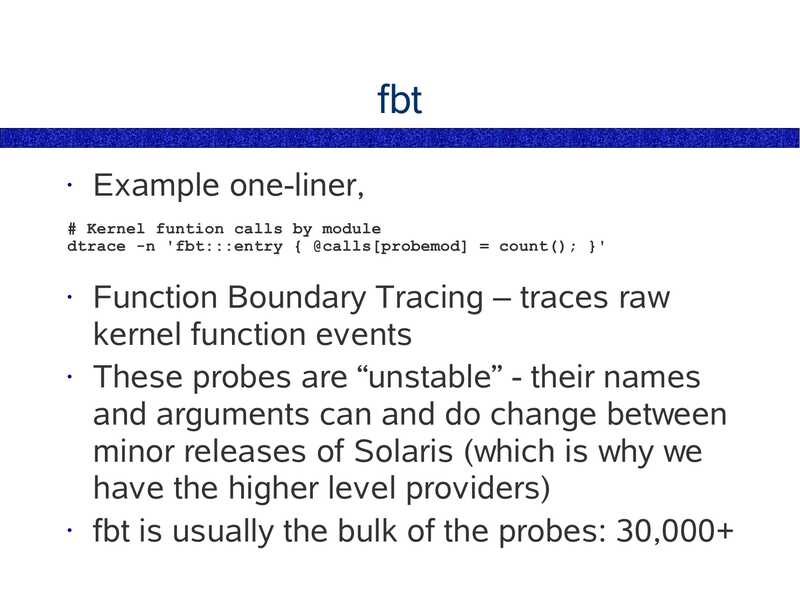
dtrace -n 'fbt:::entry { @calls[probemod] = count(); }'
# Stack size for processes
dtrace -n 'sched:::on-cpu { @[execname] = max(curthread->gt;t_procp->gt;p_stksize);}'
# Kill all top processes when they are invoked,
dtrace -wn 'syscall::exece:return /execname == "top"/ { raise(9); }'
# New processes with arguments and time,
dtrace -qn 'syscall::exec*:return { printf("%Y %s\n",walltimestamp,
curpsinfo->gt;pr_psargs); }'
# Successful signal details,
dtrace -n 'proc:::signal-send /pid/ { printf("%s -%d %d",execname,args[2],
args[1]->gt;pr_pid); }'

slide 149:
End of Chapter 4
Chapter 1 – Solaris 9 Performance Tools
Chapter 2 – Introducing DTrace
Chapter 3 – Command Line DTrace
Chapter 4 – DTrace one-liners
Chapter 5 – DTrace Mentality 1
Chapter 6 – Providers
Chapter 7 – The D Language
Chapter 8 – Advanced Scripting
Chapter 9 – The DTraceToolkit
Chapter 10 – DTrace Mentality 2

slide 150:
Chapter 5
DTrace Mentality 1
Approach Strategies
● Thinking in DTrace

slide 151:
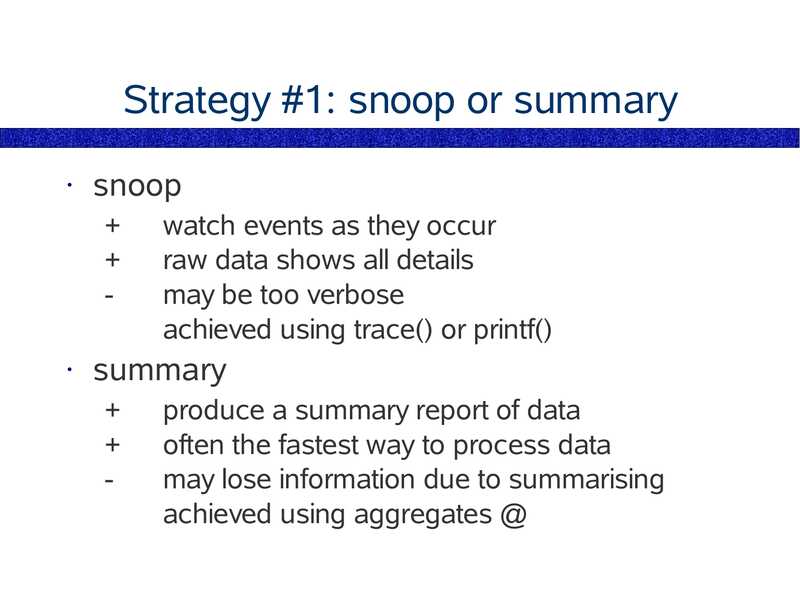
Strategy #1: snoop or summary
snoop
watch events as they occur
raw data shows all details
may be too verbose
achieved using trace() or printf()
summary
produce a summary report of data
often the fastest way to process data
may lose information due to summarising
achieved using aggregates @

slide 152:
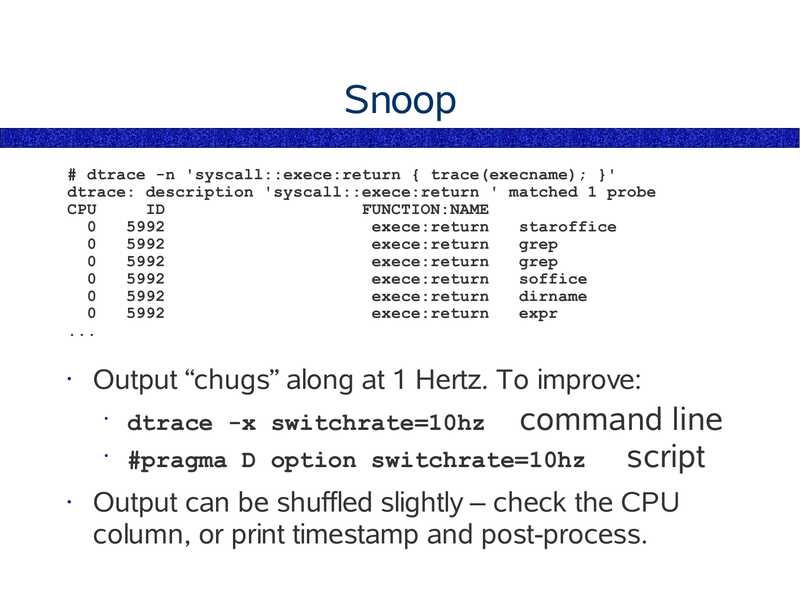
Snoop
# dtrace -n 'syscall::exece:return { trace(execname); }'
dtrace: description 'syscall::exece:return ' matched 1 probe
CPU
FUNCTION:NAME
exece:return
staroffice
exece:return
grep
exece:return
grep
exece:return
soffice
exece:return
dirname
exece:return
expr
Output “chugs” along at 1 Hertz. To improve:
command line
#pragma D option switchrate=10hz
script
dtrace -x switchrate=10hz
Output can be shuffled slightly – check the CPU
column, or print timestamp and post-process.

slide 153:
Summary
# dtrace -n 'syscall::exece:return { @num[execname] = count(); }'
dtrace: description 'syscall::exece:return ' matched 1 probe
soffice.bin
pagein
javaldx
basename
sopatchlevel.sh
soffice
staroffice
dirname
grep
expr
uname
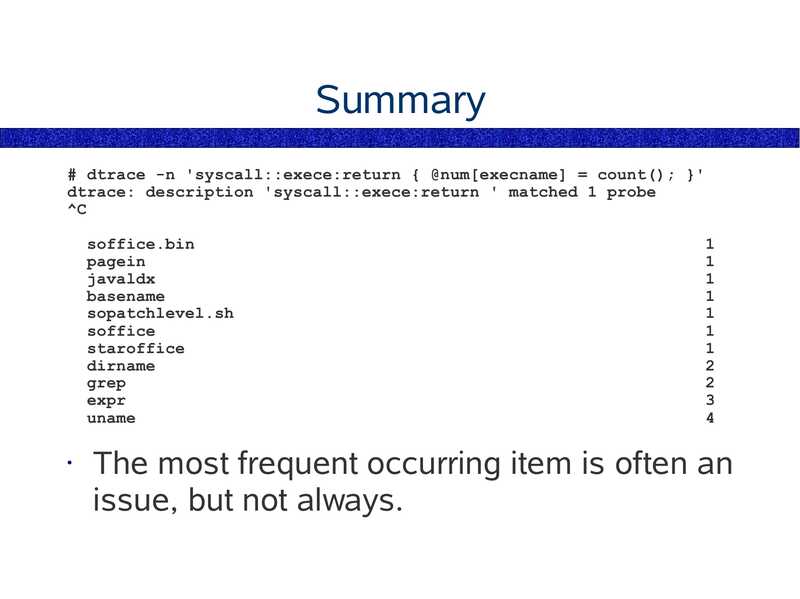
The most frequent occurring item is often an
issue, but not always.

slide 154:
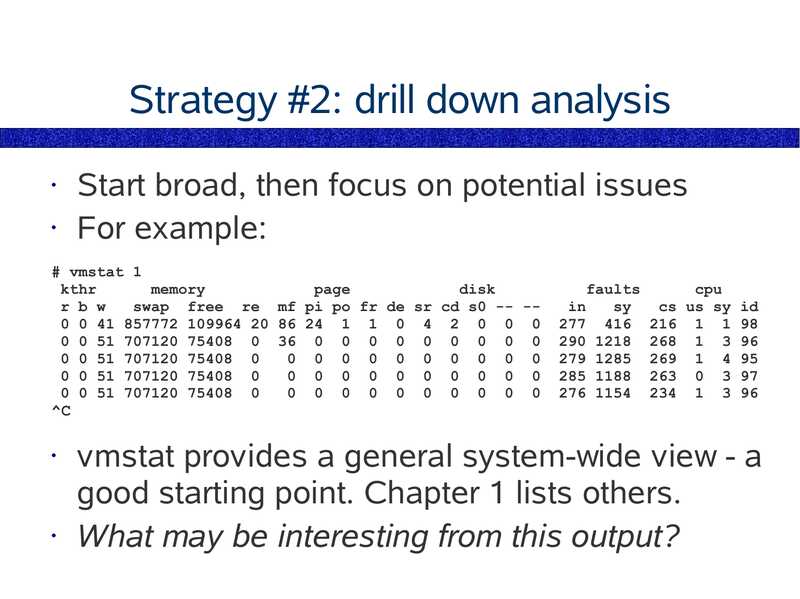
Strategy #2: drill down analysis
Start broad, then focus on potential issues
• For example:
# vmstat 1
kthr
memory
page
disk
r b w
swap free re mf pi po fr de sr cd s0 -- -0 0 41 857772 109964 20 86 24 1 1 0 4 2 0 0 0
0 0 51 707120 75408 0 36 0 0 0 0 0 0 0 0 0
0 0 51 707120 75408 0
0 0 0 0 0 0 0 0 0 0
0 0 51 707120 75408 0
0 0 0 0 0 0 0 0 0 0
0 0 51 707120 75408 0
0 0 0 0 0 0 0 0 0 0
faults
cpu
cs us sy id
277 416 216 1 1 98
290 1218 268 1 3 96
279 1285 269 1 4 95
285 1188 263 0 3 97
276 1154 234 1 3 96
vmstat provides a general system-wide view - a
good starting point. Chapter 1 lists others.
• What may be interesting from this output?

slide 155:
drill down analysis
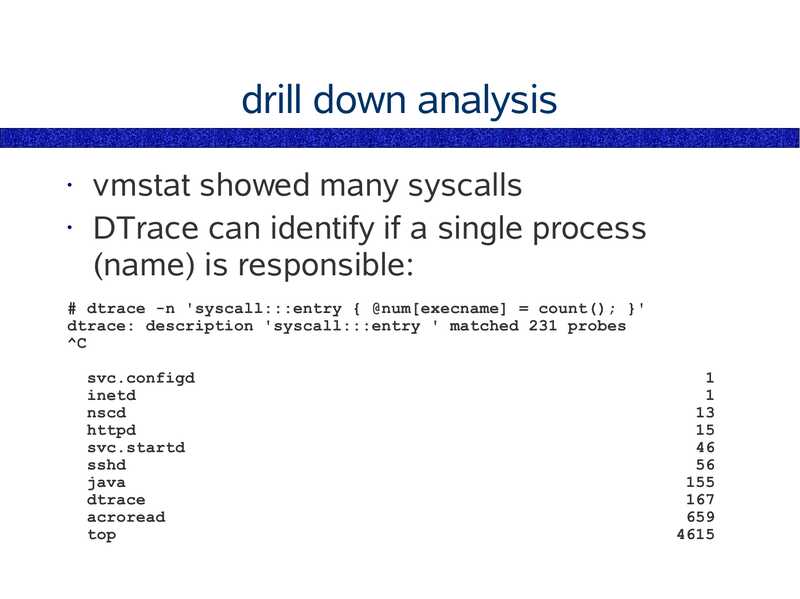
vmstat showed many syscalls
• DTrace can identify if a single process
(name) is responsible:
# dtrace -n 'syscall:::entry { @num[execname] = count(); }'
dtrace: description 'syscall:::entry ' matched 231 probes
svc.configd
inetd
nscd
httpd
svc.startd
sshd
java
dtrace
acroread
top

slide 156:
drill down analysis
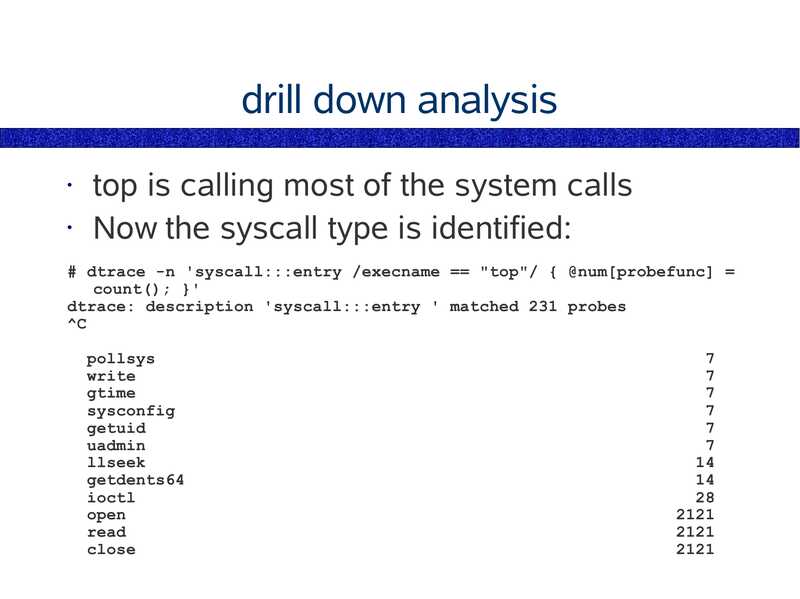
top is calling most of the system calls
• Now the syscall type is identified:
# dtrace -n 'syscall:::entry /execname == "top"/ { @num[probefunc] =
count(); }'
dtrace: description 'syscall:::entry ' matched 231 probes
pollsys
write
gtime
sysconfig
getuid
uadmin
llseek
getdents64
ioctl
open
read
close

slide 157:
drill down analysis
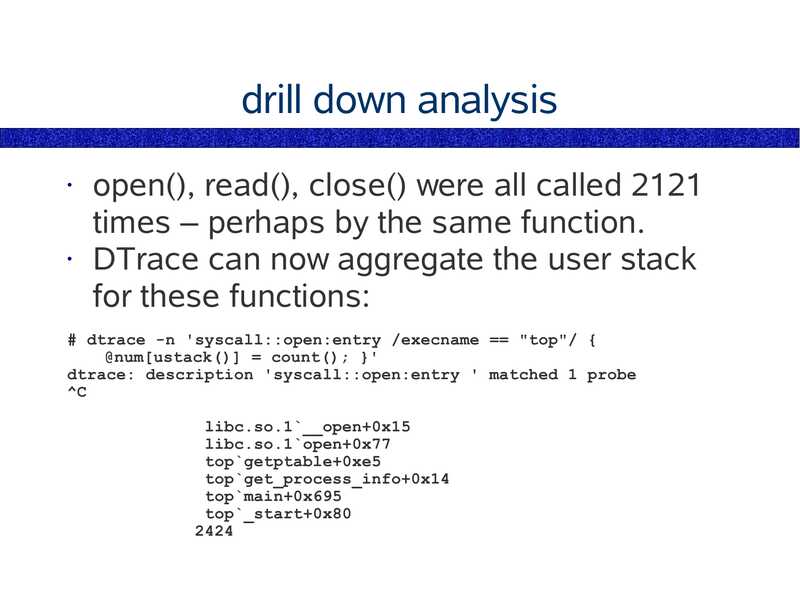
open(), read(), close() were all called 2121
times – perhaps by the same function.
• DTrace can now aggregate the user stack
for these functions:
# dtrace -n 'syscall::open:entry /execname == "top"/ {
@num[ustack()] = count(); }'
dtrace: description 'syscall::open:entry ' matched 1 probe
libc.so.1`__open+0x15
libc.so.1`open+0x77
top`getptable+0xe5
top`get_process_info+0x14
top`main+0x695
top`_start+0x80

slide 158:
drill down analysis
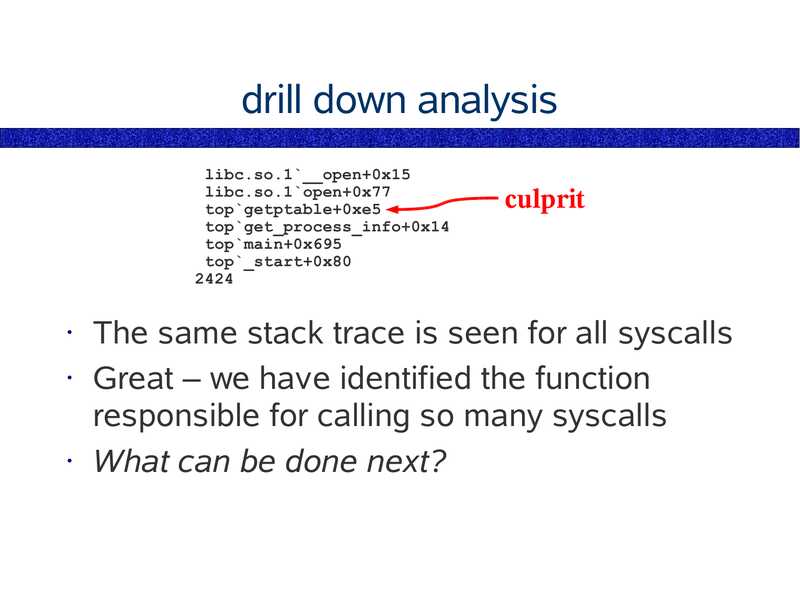
libc.so.1`__open+0x15
libc.so.1`open+0x77
top`getptable+0xe5
top`get_process_info+0x14
top`main+0x695
top`_start+0x80
culprit
The same stack trace is seen for all syscalls
• Great – we have identified the function
responsible for calling so many syscalls
• What can be done next?

slide 159:
further drill down analysis
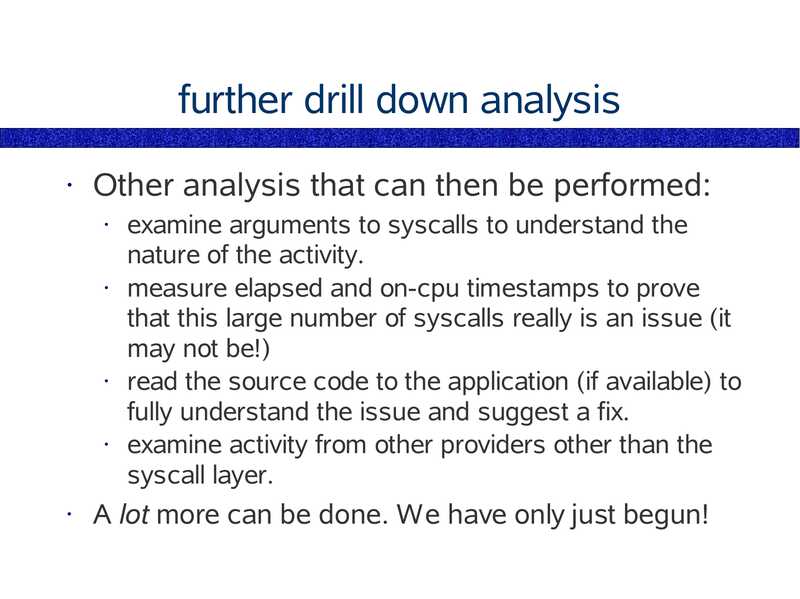
Other analysis that can then be performed:
examine arguments to syscalls to understand the
nature of the activity.
measure elapsed and on-cpu timestamps to prove
that this large number of syscalls really is an issue (it
may not be!)
read the source code to the application (if available) to
fully understand the issue and suggest a fix.
examine activity from other providers other than the
syscall layer.
A lot more can be done. We have only just begun!

slide 160:
Strategy #3: frequency count
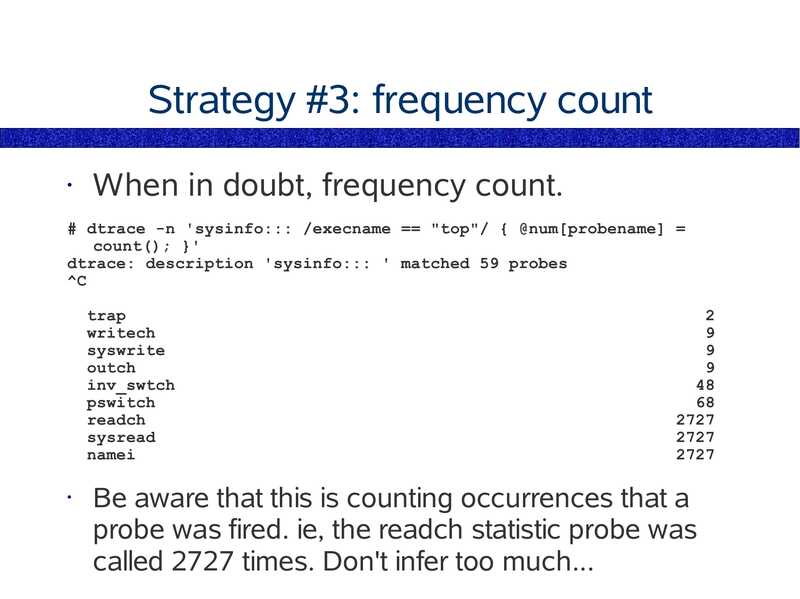
When in doubt, frequency count.
# dtrace -n 'sysinfo::: /execname == "top"/ { @num[probename] =
count(); }'
dtrace: description 'sysinfo::: ' matched 59 probes
trap
writech
syswrite
outch
inv_swtch
pswitch
readch
sysread
namei
Be aware that this is counting occurrences that a
probe was fired. ie, the readch statistic probe was
called 2727 times. Don't infer too much...

slide 161:
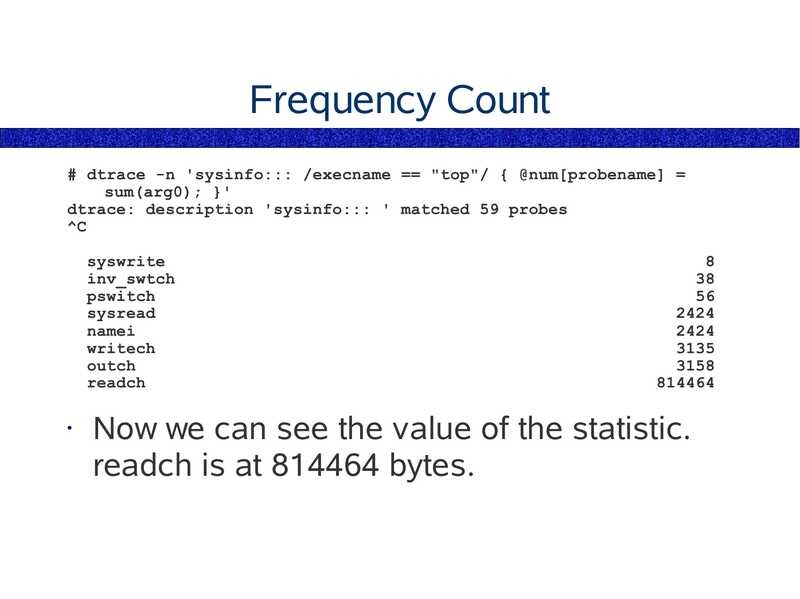
Frequency Count
# dtrace -n 'sysinfo::: /execname == "top"/ { @num[probename] =
sum(arg0); }'
dtrace: description 'sysinfo::: ' matched 59 probes
syswrite
inv_swtch
pswitch
sysread
namei
writech
outch
readch
Now we can see the value of the statistic.
readch is at 814464 bytes.

slide 162:
Frequency Count
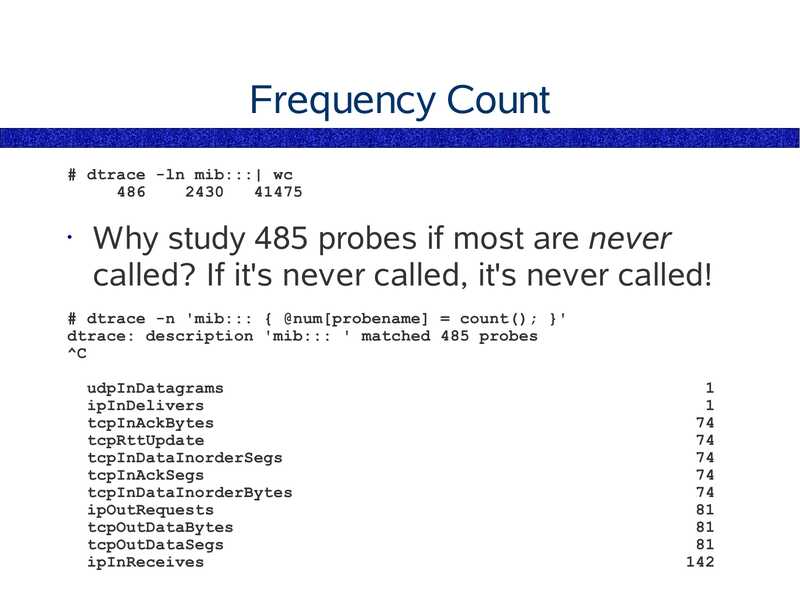
# dtrace -ln mib:::| wc
Why study 485 probes if most are never
called? If it's never called, it's never called!
# dtrace -n 'mib::: { @num[probename] = count(); }'
dtrace: description 'mib::: ' matched 485 probes
udpInDatagrams
ipInDelivers
tcpInAckBytes
tcpRttUpdate
tcpInDataInorderSegs
tcpInAckSegs
tcpInDataInorderBytes
ipOutRequests
tcpOutDataBytes
tcpOutDataSegs
ipInReceives

slide 163:
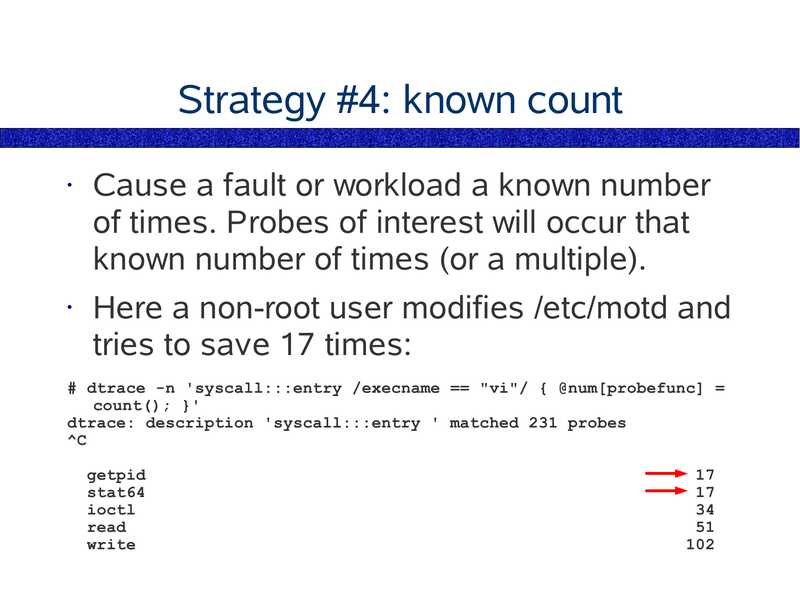
Strategy #4: known count
Cause a fault or workload a known number
of times. Probes of interest will occur that
known number of times (or a multiple).
Here a non-root user modifies /etc/motd and
tries to save 17 times:
# dtrace -n 'syscall:::entry /execname == "vi"/ { @num[probefunc] =
count(); }'
dtrace: description 'syscall:::entry ' matched 231 probes
getpid
stat64
ioctl
read
write

slide 164:
Yellow Pig
I like to create 17 events, as 17 is not a
commonly occurring number, and is more
likely to be related to your test. A similar
moderately sized prime would be 23.
• The number of eyelashes on a yellow pig is
supposedly 17
• Hence, the “Yellow Pig number” is 17
• “Yellow Pig Day” is July 17th, celebrated by
mathematicians
• (I'm not making this up - try google!)

slide 165:
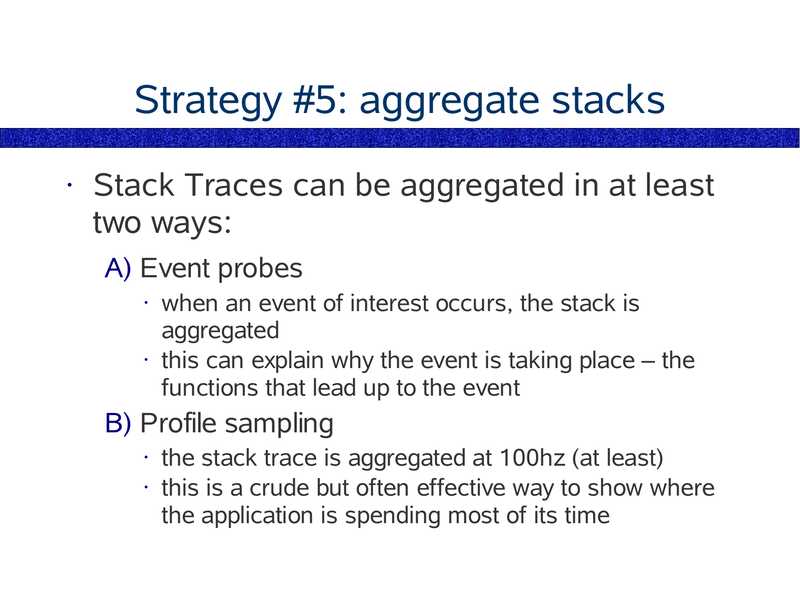
Strategy #5: aggregate stacks
Stack Traces can be aggregated in at least
two ways:
A) Event probes
when an event of interest occurs, the stack is
aggregated
• this can explain why the event is taking place – the
functions that lead up to the event
B) Profile sampling
the stack trace is aggregated at 100hz (at least)
• this is a crude but often effective way to show where
the application is spending most of its time

slide 166:
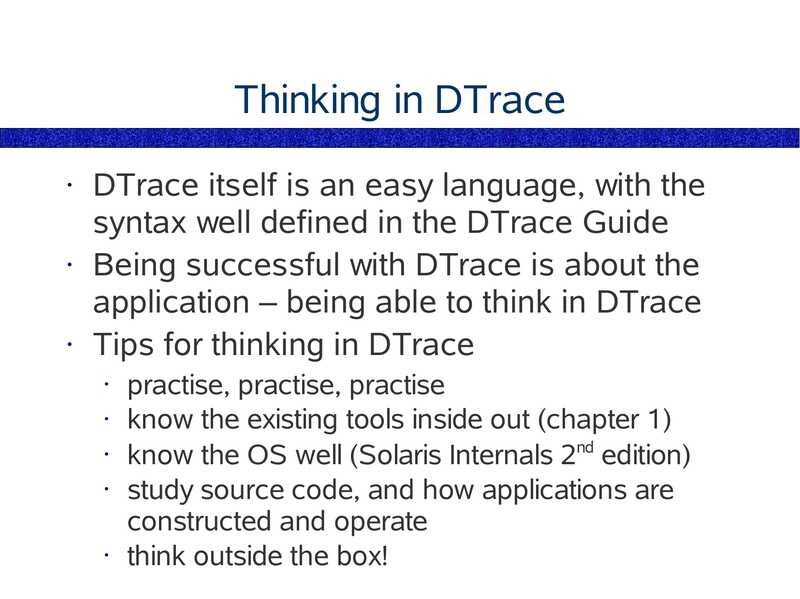
Thinking in DTrace
DTrace itself is an easy language, with the
syntax well defined in the DTrace Guide
• Being successful with DTrace is about the
application – being able to think in DTrace
• Tips for thinking in DTrace
practise, practise, practise
• know the existing tools inside out (chapter 1)
• know the OS well (Solaris Internals 2nd edition)
• study source code, and how applications are
constructed and operate
• think outside the box!

slide 167:
End of Chapter 5
Chapter 1 – Solaris 9 Performance Tools
Chapter 2 – Introducing DTrace
Chapter 3 – Command Line DTrace
Chapter 4 – DTrace one-liners
Chapter 5 – DTrace Mentality 1
Chapter 6 – Providers
Chapter 7 – The D Language
Chapter 8 – Advanced Scripting
Chapter 9 – The DTraceToolkit
Chapter 10 – DTrace Mentality 2

slide 168:
Chapter 6
Providers
Provider Guide
● Using fbt
● Using pid

slide 169:
Providers
syscall
System call entry and return probes
sysinfo
Classic sysinfo statistic probes
vminfo
Virtual Memory statistic probes
Disk and NFS events
proc
Process events such as creation
sched
System scheduling events
lockstat Kernel synchronisation lock events
plockstat User synchronisation lock events
mib
MIB statistic updates
fasttrap User location tracing
fpuinfo
SPARC FPU simulation events

slide 170:
Providers
sdt
profile
dtrace
fbt
pid
Statically defined tracing
Fixed sampling
Program BEGIN/END probes
Raw kernel tracing
User-level tracing
Check the DTrace Guide for additional
providers

slide 171:
syscall
Example one-liner,
# Syscall count by syscall,
dtrace -n 'syscall:::entry { @num[probefunc] = count(); }'
Probes the interface between user-land and
the kernel
• Provides many insights into application
behaivour
• syscalls are documented in section 2 of the
man pages

slide 172:
sysinfo
Example one-liner,
# Read bytes by process name,
dtrace -n 'sysinfo:::readch { @bytes[execname] = sum(arg0); }'
Probes the sysinfo statistics, which are
provided by kstat to tools such as mpstat
• Provides many insights into application and
system behaivour
• Documented in the DTrace Guide (chap 23)
• Also see /usr/include/sys/sysinfo.h,
cpu_sysinfo.h

slide 173:
vminfo
Example one-liner,
# Pages paged in by process name,
dtrace -n 'vminfo:::pgpgin { @pg[execname] = sum(arg0); }'
Probes the vminfo statistics, which are
provided by kstat to tools such as vmstat
• Provides many insights into virtual memory
behaivour
• Documented in the DTrace Guide (chap 24)
• Also see /usr/include/sys/sysinfo.h,
cpu_vminfo.h

slide 174:
Example one-liner,
# Disk size aggregation
dtrace -n 'io:::start { @sz[execname] = quantize(args[0]->gt;b_bcount); }'
Probes I/O events, for both disk and NFS
• Provides a probe for the start and finish of
each I/O transaction
• Provides crucial data for understanding how
applications are driving the disks
• Documented in the DTrace Guide (chap 27)

slide 175:
proc
Example one-liner,
# New processes with arguments,
dtrace -n 'proc:::exec-success { trace(curpsinfo->gt;pr_psargs); }'
Probes process events such as exec, exit,
thread creation and exit, and signals
• Provides high level probes so that process
analysis can be performed easily
• Documented in the DTrace Guide (chap 25)

slide 176:
sched
Example one-liner,
# Times the schedular begins to run a thread,
dtrace -n 'sched:::on-cpu { @on[execname] = count(); }'
Probes thread scheduling events
• Provides high level probes so that schedular
analysis can be performed easily
• Documented in the DTrace Guide (chap 26)
• Also see Solaris Internals 2nd edition

slide 177:
fbt
Example one-liner,
# Kernel funtion calls by module
dtrace -n 'fbt:::entry { @calls[probemod] = count(); }'
Function Boundary Tracing – traces raw
kernel function events
• These probes are “unstable” - their names
and arguments can and do change between
minor releases of Solaris (which is why we
have the higher level providers)
• fbt is usually the bulk of the probes: 30,000+

slide 178:
fbt
Since fbt can trace the entire kernel,
observing just about any kernel behaviour is
possible
• Enabling all fbt probes (30,000+) will slow
the kernel noticeably. Be selective
• Documentation for the fbt probes (which is
really documentation for the kernel) is in:
The DTrace Guide (chap 20)
● Solaris Internals 2nd edition
● cvs.opensolaris.org

slide 179:
pid
Example one-liner,
# Trace user-level function entries,
dtrace -n 'pid$target:a.out::entry' -c 'some_command'
The pid provider runs a command (-c cmd),
or traces a particular process (-p PID).
• The pid provider can:
trace user functions
● trace user instructions
● trace library functions
● trace library instructions
The pid provider can create millions of probes

slide 180:
pid:::
The provider name is,
pidPID
Where PID is the target to trace
• pid81
Trace PID 81
• pid$target
Trace the target of -c or -p
The full syntax is,
pidPID:segment:function:name
segment is the name of the mapping. eg,
libc.so.1 (or “libc”) a library
• a.out
the binary
function is the function name. eg, “main”
• name is either: entry, return, or an instruction
address

slide 181:
pid demonstrations
user functions,
# dtrace -n 'pid$target:a.out::entry' -c 'ping mars'
dtrace: description 'pid$target:a.out::entry' matched 16 probes
mars is alive
dtrace: pid 29890 has exited
CPU
FUNCTION:NAME
0 39187
__fsr:entry
0 39188
main:entry
0 39191
send_scheduled_probe:entry
0 39198
set_IPv4_options:entry
0 39190
schedule_sigalrm:entry
0 39199
check_reply:entry
0 39195
seq_match:entry
0 39191
send_scheduled_probe:entry

slide 182:
pid demonstrations
user instructions,
# dtrace -n 'pid$target:a.out:set_IPv4_options:' -c 'ping mars'
dtrace: description 'pid$target:a.out:set_IPv4_options:' matched 169 probes
mars is alive
dtrace: pid 29900 has exited
CPU
FUNCTION:NAME
set_IPv4_options:entry
set_IPv4_options:0
set_IPv4_options:1
set_IPv4_options:3
set_IPv4_options:6
set_IPv4_options:7
set_IPv4_options:8
set_IPv4_options:9
set_IPv4_options:10
set_IPv4_options:12
set_IPv4_options:19
set_IPv4_options:1b
set_IPv4_options:1f
set_IPv4_options:15d
set_IPv4_options:15e
set_IPv4_options:15f
set_IPv4_options:160
set_IPv4_options:162
set_IPv4_options:163
set_IPv4_options:return

slide 183:
pid demonstrations
library functions,
# dtrace -n 'pid$target:::entry' -c 'ping mars'
dtrace: description 'pid$target:::entry' matched 5318 probes
mars is alive
dtrace: pid 29905 has exited
CPU
FUNCTION:NAME
0 39320
call_array:entry
0 39321
call_init:entry
0 39352
leave:entry
0 39351
fmap_setup:entry
0 39596
munmap:entry
0 39296
rt_bind_clear:entry
0 39287
_rt_bind_clear:entry
0 39294
rt_mutex_unlock:entry
0 39289
_rt_null:entry
0 39296
rt_bind_clear:entry
0 39287
_rt_bind_clear:entry
0 65195
libc_init:entry
0 63314
atexit:entry
0 64852
lmalloc:entry

slide 184:
pid demonstrations
library instructions,
# dtrace -n 'pid$target:libc:getpid:' -c 'ping mars'
dtrace: description 'pid$target:libc:getpid:' matched 9 probes
mars is alive
dtrace: pid 29914 has exited
CPU
FUNCTION:NAME
0 39188
getpid:entry
0 39189
getpid:0
0 39190
getpid:5
0 39191
getpid:6
0 39192
getpid:b
0 39193
getpid:d
0 39194
getpid:13
0 39195
getpid:15
0 39187
getpid:return
0 39188
getpid:entry
0 39189
getpid:0
0 39190
getpid:5
0 39191
getpid:6

slide 185:
End of Chapter 6
Chapter 1 – Solaris 9 Performance Tools
Chapter 2 – Introducing DTrace
Chapter 3 – Command Line DTrace
Chapter 4 – DTrace one-liners
Chapter 5 – DTrace Mentality 1
Chapter 6 – Providers
Chapter 7 – The D Language
Chapter 8 – Advanced Scripting
Chapter 9 – The DTraceToolkit
Chapter 10 – DTrace Mentality 2

slide 186:
Chapter 7
The D Language
Comments
● Variable Types
● Macros
● Script Options
● Pragmas

slide 187:
Comments
The D language is related to the C
programming language. This includes
comment syntax:
/* this is a one line comment */
* This is a
* block comment.

slide 188:
Variable Types
DTrace tries to figure out the variable type
on first declaration
• Variable types can be predeclared
• Types include:
integer
● string
● pointer
● associative array
● aggregate
● thread-local
● clause-local

slide 189:
Integers
Using integers:
int mycount;
● mycount = 1;
● mycount++;
● /mycount >gt; 10/
declaration
declaration / setting
increment by 1
testing in a predicate
A declaration of the form “int mycount;” must
be placed outside of any action block. They
are usually placed at the top of the program.

slide 190:
Strings
Using strings:
string name;
● name = “Fred Nurke”;
● /name == “Fred”/
● name = 0;
declaration
declaration / setting
predicate testing
memory cleanup
Strings are null terminated
• printf() supports,
%s string format
• %S
safe string format (escapes odd chars)

slide 191:
Pointers
Used in the same way as C programming
• DTrace can walk most structures without
casting (eg, vnode_t, proc_t, ...)
• Special builtins,
curthread
● curpsinfo
pointer to the on-cpu thread
poniter to a psinfo like structure
Eg,
curpsinfo->gt;pr_psargs
80 char arg list
● curthread->gt;t_procp->gt;p_lwpcnt
# of LWPs

slide 192:
Associative Arrays
Also known as “hashed arrays”, or
“key/value arrays”
Using associative arrays:
string name[int];
● name[3] = “Fred”;
● /name[3] == “Fred”/
● name[3] = 0;
● name[“sd0”, 1] = 4;
decleration
decleration / setting
predicate testing
memory cleanup
two key array
Try to use aggregates instead

slide 193:
Aggregates
Discussed in Chapter 3
• Using Aggregates:
@name[keys] = func();
setting
● printa(“%s... %@d”, @name);
printing
● trunc(@name);
clearing
● trunc(@name, size);
truncating to size
● clear(@name);
clearing values
● normalize(@name, n);
dividing by n
Aggregates perform well, and produce great reports

slide 194:
Thread-local
A variable stored private to each thread.
• Using thread-local:
self->gt;start = timestamp;
setting
● self int start;
declaration
● /self->gt;start >gt; 0/
predicates
● self->gt;start = 0;
memory cleanup
Thread-local variables are crucial, and are
used heavily when scripting in DTrace.

slide 195:
Clause-local
A temporary variable for calculations within
an action clause
• Using clause-local:
this->gt;delta = 5;
● this int delta;
setting
declaration
These are used to improve performance,
rather than using global integers or strings
that require lock overheads between CPUs
• Only use these within one action

slide 196:
Kernel Variables
Any symbol from the kernel can be read,
along with its struct members
• Example kernel variables:
`freemem
● `utsname.nodename
free mem in pages
hostname
Often only the source code can explain what
these really are
• Module variables can also be read (prefix
with the module name)

slide 197:
Macro Variables
DTrace provides some useful macro
variables for scripting:
$1, $2, ...
arguments to script as ints
● $$1, $$2, ... arguments to script as strings
● $pid
PID of dtrace(1M)
● $uid
real UID of dtrace(1M)
● $target
PID target of dtrace (-c or -p)
For the argument variables to assume
default values (0 or “”), use:
#pragma D option defaultargs

slide 198:
Script Options
When writing complex scripts, it can be
useful for them to process options. Eg:
# ./DTraceToolkit-0.96/dvmstat -h
USAGE: dvmstat [-h] { -p PID | -n name | command }
-p PID
# examine this PID
-n name
# examine this process name
eg,
dvmstat -p 1871
# examine PID 1871
dvmstat -n tar
# examine processes called "tar"
dvmstat df -h
# run and examine "df -h"
Currently this is best achieved by embedding the
DTrace script in a shell script, and using the shell's
getopts function. Be careful to write neatly and follow
programming best practices – such scripts get
messy fast.

slide 199:
Pragmas
These change the behaviour of DTrace, and
often an alternative to command line options
• Useful pragmas:
#pragma D option quiet
● #pragma D option switchrate=10hz
● #pragma D option bufsize=16m
● #pragma D option flowindent
● #pragma D option destructive
Others are listed in the DTrace Guide
(chapter 16)

slide 200:
Destructive Actions
These do more than just read data:
stop()
● raise(sig)
● chill(ns)
● system(cmd)
freeze the current process
send this sig to the current PID
pause for nanoseconds
run this shell command
copyout(buf, addr, bytes)
copy this
data to user-land
Use extreme caution when using destructive
actions

slide 201:
End of Chapter 7
Chapter 1 – Solaris 9 Performance Tools
Chapter 2 – Introducing DTrace
Chapter 3 – Command Line DTrace
Chapter 4 – DTrace one-liners
Chapter 5 – DTrace Mentality 1
Chapter 6 – Providers
Chapter 7 – The D Language
Chapter 8 – Advanced Scripting
Chapter 9 – The DTraceToolkit
Chapter 10 – DTrace Mentality 2

slide 202:
Chapter 8
Advanced Scripting
Step through an example script
● Discuss script internals

slide 203:
Example: shortlived.d
The following is from the DTraceToolkit:
# ./shortlived.d
Tracing... Hit Ctrl-C to stop.
short lived processes:
0.924 secs
total sample duration:
4.308 secs
Total time by process name,
soffice
3 ms
sopatchlevel.sh
10 ms
grep
14 ms
uname
24 ms
javaldx
33 ms
expr
36 ms
soffice.bin
93 ms
pagein
696 ms
Total time by PPID,
30 ms
93 ms
786 ms

slide 204:
shortlived.d
shortlived.d calculates CPU time consumed
by short-lived processes (processes that
began and ended while DTrace was tracing).
• A common performance issue is short-lived
processes hogging the CPU, which can be
difficult to identify using traditional tools
such as prstat.
• It is useful to discuss the entire internals of
this script, from comments to code.

slide 205:
shortlived.d
#!/usr/sbin/dtrace -qs
* shortlived.d - determine time spent by short lived processes.
Written in DTrace (Solaris 10 3/05).
* 27-May-2006, ver 0.94
* USAGE:
shortlived.d
# wait, then hit Ctrl-C
* Applications that run many short lived processes can cause load
* on the system that is difficult to identify - the processes
* aren't sampled in time by programs such as prstat. This program
* illustrates how much time was spent processing those extra
* processes, and a table of process name by total times for each.
* SEE ALSO: execsnoop
* Notes:
* - The measurements are minimum values, not all of the overheads
caused by process generation and destruction are measured (DTrace
can do so, but the script would become seriously complex).
* - The summary values are accurate, the by program and by PPID values
are usually slightly smaller due to rounding errors.

slide 206:
shortlived.d
* COPYRIGHT: Copyright (c) 2005, 2006 Brendan Gregg.
* CDDL HEADER START
* The contents of this file are subject to the terms of the
* Common Development and Distribution License, Version 1.0 only
* (the "License"). You may not use this file except in compliance
* with the License.
* You can obtain a copy of the license at Docs/cddl1.txt
* or http://www.opensolaris.org/os/licensing.
* See the License for the specific language governing permissions
* and limitations under the License.
* CDDL HEADER END
* 22-Apr-2005 Brendan Gregg
Created this.

slide 207:
shortlived.d
* Start
dtrace:::BEGIN
/* save start time */
start = timestamp;
/* this is time spent on shortlived processes */
procs = 0;
/* print header */
printf("Tracing... Hit Ctrl-C to stop.\n");

slide 208:
shortlived.d
* Measure parent fork time
syscall::*fork*:entry
/* save start of fork */
self->gt;fork = vtimestamp;
syscall::*fork*:return
/arg0 != 0 && self->gt;fork/
/* record on-CPU time for the fork syscall */
procs += vtimestamp - self->gt;fork;
self->gt;fork = 0;
* Measure child processes time

slide 209:
shortlived.d
syscall::*fork*:return
/arg0 == 0/
/* save start of child process */
self->gt;start = vtimestamp;
/* memory cleanup */
self->gt;fork = 0;
proc:::exit
/self->gt;start/
/* record on-CPU time for process execution */
this->gt;oncpu = vtimestamp - self->gt;start;
procs += this->gt;oncpu;
/* sum on-CPU by process name and ppid */
@Times_exec[execname] = sum(this->gt;oncpu/1000000);
@Times_ppid[ppid] = sum(this->gt;oncpu/1000000);
/* memory cleanup */
self->gt;start = 0;

slide 210:
shortlived.d
* Print report
dtrace:::END
this->gt;total = timestamp - start;
printf("short lived processes: %6d.%03d secs\n",
procs/1000000000, (procs%1000000000)/1000000);
printf("total sample duration: %6d.%03d secs\n",
this->gt;total/1000000000, (this->gt;total%1000000000)/1000000);
printf("\nTotal time by process name,\n");
printa("%18s %@12d ms\n", @Times_exec);
printf("\nTotal time by PPID,\n");
printa("%18d %@12d ms\n", @Times_ppid);

slide 211:
End of Chapter 8
Chapter 1 – Solaris 9 Performance Tools
Chapter 2 – Introducing DTrace
Chapter 3 – Command Line DTrace
Chapter 4 – DTrace one-liners
Chapter 5 – DTrace Mentality 1
Chapter 6 – Providers
Chapter 7 – The D Language
Chapter 8 – Advanced Scripting
Chapter 9 – The DTraceToolkit
Chapter 10 – DTrace Mentality 2

slide 212:
Chapter 9
The DTraceToolkit
Introduce the DTraceToolkit
● Explain Layout
● A Recipe For Getting Started

slide 213:
DTraceToolkit
http://www.opensolaris.org/os/community/dtrace/dtracetoolkit
http://www.brendangregg.com/dtrace.html
Version 0.96 contains over 100 scripts
• Freeware (CDDL)
• Serves to:
● Provide tools to analyse to common problems
● Provide numerous demonstrations of
programming in D
● Promote DTrace
Written for Solaris 10 3/05 as much as possible

slide 214:
Main Parts
The DTraceToolkit is currently 3 main parts:
The Scripts
● Man Pages
● Examples
Man
Docs/Examples
There is a man page for every script, and an
example file for every script.
• It took considerable time to write 100+ man
pages – so please read them!
• The example files are often more useful
than the man pages

slide 215:
Installation
Isn't required – the scripts can be run
immediately after extraction
• If desired, an install script has been
provided. It prompts for install options, and
defaults to installing under /opt/DTT
# ./install
DTraceToolkit Installation
--------------------------DTraceToolkit version 0.96, 24-Apr-2006
hit Ctrl-C any time you wish to quit.
Enter target directory for installation [/opt/DTT]:

slide 216:
Script Layout
The scripts are positioned in a hierarchy: the
most useful are in the top directory, and
others are in meaningful subdirectories
• The “Bin” directory contains symlinks to all
the scripts
DTraceToolkit-0.96# ls -F
Apps/
Guide
Bin/
Kernel/
Cpu/
License@
Disk/
Locks/
Docs/
Man/
Extra/
Mem/
FS/
Net/
Proc/
README@
System/
User/
Version
Zones/
dappprof*
dapptrace*
dexplorer*
dtruss*
dvmstat*
errinfo*
execsnoop*
install*
iosnoop*
iotop*
opensnoop*
procsystime*
rwsnoop*
rwtop*

slide 217:
The Scripts
If they end in .d, they are pure DTrace. See
the man page or try reading their header.
• If they don't end in .d, they are wrapped in
shell or Perl. See their man page and try
running them with -h.
• If they begin with,
● Tracing...
Hit Ctrl-C to end.
they are tracing events
● Sampling... Hit Ctrl-C to end.
they are sampling events using the profile provider

slide 218:
The Man Pages
Man Pages can be read using,
# MANPATH=$MANPATH:/opt/DTT/Man
# or wherever
# man iosnoop
Reformatting page. Please Wait... done
USER COMMANDS
NAME
iosnoop(1m)
iosnoop - snoop I/O events as they occur. Uses DTrace.
SYNOPSIS
iosnoop [-a|-A|-Deghinostv] [-d device]
mount_point] [-n name] [-p PID]
[-f
filename]
[-m
DESCRIPTION
iosnoop prints I/O events as they happen, with useful
details such as UID, PID, block number, size, filename, etc.
This is useful to determine the process responsible for
using the disks, as well as details on what activity the
process is requesting. Behaviour such as random or sequential I/O can be observed by reading the block numbers.

slide 219:
The Example Files
Read using,
# more Docs/Examples/bitesize_example.txt
In this example, bitesize.d was run for several seconds then Ctrl-C was hit.
As bitesize.d runs it records how processes on the system are accessing the
disks - in particular the size of the I/O operation. It is usually desirable
for processes to be requesting large I/O operations rather than taking many
small "bites".
The final report highlights how processes performed. The find command mostly
read 1K blocks while the tar command was reading large blocks - both as
expected.
# bitesize.d
Tracing... Hit Ctrl-C to end.
PID
CMD
-bash\0
value ------------- Distribution ------------- count
512 |
1024 |@@@@@@@@@@@@@@@@@@@@@@@@@@

slide 220:
Script Subdirectories
So far there is,
Bin/
Apps/
Cpu/
Disk/
Extra/
Kernel/
Locks/
Mem/
Net/
Proc/
System/
User/
Zones/
Symlinks to the scripts
Application specific scripts
Scripts for CPU analysis
Scripts for disk I/O analysis
Misc scripts
Scripts for kernel analysis
Scripts for lock analysis
Scripts for memory analysis
Scripts for network analysis
Scripts for process analysis
Scripts for system analysis
Scripts for user based activity analysis
Scripts for analysis by zone
Remember to check the top-level scripts first

slide 221:
DTraceToolkit Recipe
Running the following scripts in this order
has proved a useful recipe:
1)execsnoop
2)iosnoop
3)opensnoop
4)errinfo
5)procsystime
6)rwtop
7)iotop
8)dvmstat
9)Disk/bitesize.d

slide 222:
dexplorer
This exists to capture DTrace data in the
most broad possible way
• It creates a tar file containing the output from
numerous DTrace commands
• If you only had 5 minutes to “DTrace” a
server, dexplorer may be the best tool to run
– it creates many files for later offline
analysis
• A html-iser for dexplorer has yet to be written
(it won't be hard to do)

slide 223:
Behind the DTraceToolkit
The DTraceToolkit is a product of much
testing – far more time has gone into testing
the scripts than actually writing them
• The scripts need to be tested on:
● SPARC and x86
● Solaris 10 3/05, Solaris 10 1/06, ...
● Different builds of OpenSolaris (makes a huge
difference for any fbt based scripts)
● All possible workloads
If a script's output is 99% correct, is that
“correct”?

slide 224:
Testing
A script's output that is incorrect 1% of the time, is
incorrect.
Imagine a “ps -ef” that has 1 bad line out of every 100.
Only in some cases is this acceptable – where the data
is clearly marked as an estimation.
For example, prstat's “SIZE” and “RSS” are not 100%
accurate, but they are still useful estimates as we are
aware that they are estimates.

slide 225:
End of Chapter 9
Chapter 1 – Solaris 9 Performance Tools
Chapter 2 – Introducing DTrace
Chapter 3 – Command Line DTrace
Chapter 4 – DTrace one-liners
Chapter 5 – DTrace Mentality 1
Chapter 6 – Providers
Chapter 7 – The D Language
Chapter 8 – Advanced Scripting
Chapter 9 – The DTraceToolkit
Chapter 10 – DTrace Mentality 2

slide 226:
Chapter 10
DTrace Mentality 2
More DTrace Strategies

slide 227:
Strategy #6: Elapsed Time
Elapsed time is the calculated using,
start = timestamp;
elapsed = timestamp - start;
Elapsed time explains why an application is
experiencing slow response times
• Elapsed time includes disk I/O times,
network I/O times, scheduling latency, ...
• Elapsed times can be measured at the
application, treating the OS as a black box

slide 228:
Measuring Times
Some difficulties when measuring these:
Knowing what is the start probe and what is the
end probe.
● If you are lucky, the provider will already have it as
:entry and :return, or :start and :done.
● If you are unlucky, you will need to find the probes
from what is available. Try a previous strategy –
“known count”.
Associating the start probe to the end probe
● If you are lucky, they will be in the same thread and
you can use a thread-local variable. Eg, self->gt;start
● If you are unlucky, you'll need associative arrays and
some other ID as the key.

slide 229:
Strategy #7: On-CPU Time
On-CPU time is the calculated using,
start = vtimestamp;
oncpu = vtimestamp - start;
On-CPU time explains why the CPUs are
busy
• On-CPU time excludes disk I/O times,
network I/O times, scheduling latency, ...

slide 230:
Elapsed vs On-CPU
DTraceToolkit-0.96# more Docs/Examples/dtruss_example.txt
In the following example, syscall elapsed and overhead times are measured.
Elapsed times represent the time from syscall start to finish; overhead
times measure the time spent on the CPU,
# dtruss -eon bash
PID/LWP
ELAPSD
3911/1:
3911/1: 1001579
3911/1:
3911/1: 1019129
3911/1:
3911/1:
3911/1:
3911/1: 1094323
3911/1:
3911/1: 1210496
3911/1:
3911/1:
3911/1:
CPU SYSCALL(args)
= return
26 write(0x2, "l\0", 0x1)
= 1 0
43 read(0x0, "s\0", 0x1)
= 1 0
26 write(0x2, "s\0", 0x1)
= 1 0
43 read(0x0, " \001\0", 0x1)
= 1 0
26 write(0x2, " \0", 0x1)
= 1 0
43 read(0x0, "-\0", 0x1)
= 1 0
26 write(0x2, "-\001\0", 0x1)
= 1 0
42 read(0x0, "l\0", 0x1)
= 1 0
27 write(0x2, "l\001\0", 0x1)
= 1 0
44 read(0x0, "\r\0", 0x1)
= 1 0
28 write(0x2, "\n\001\0", 0x1)
= 1 0
1 lwp_sigmask(0x3, 0x2, 0x0)
= 0xFFBFFEFF 0
63 ioctl(0x0, 0x540F, 0x80F6D00)
= 0 0

slide 231:
Strategy #8: Milestones
Try to understand the behaviour of the target
by identifying application-level activity
milestones. For example:
establishing a connection
• beginning a transaction
• completing a transaction
• writing to a log
These may be identified using:
the probe name – ie, the function name
• ustack() when solaris statistics are triggered
• engaging in “known count” strategy
• dereferencing random strings

slide 232:
End of Chapter 10
Chapter 1 – Solaris 9 Performance Tools
Chapter 2 – Introducing DTrace
Chapter 3 – Command Line DTrace
Chapter 4 – DTrace one-liners
Chapter 5 – DTrace Mentality 1
Chapter 6 – Providers
Chapter 7 – The D Language
Chapter 8 – Advanced Scripting
Chapter 9 – The DTraceToolkit
Chapter 10 – DTrace Mentality 2

slide 233:
Workshops
DTrace Workshops
Now it's time for you to get your hands dirty solving a
variety of problems
I'll create problems on your systems at random
When you solve them, don't shout out the answer!
Many people find this this is the best way to learn –
you need to think on your own
Good Luck!


