MeetBSD 2014: Performance Analysis
Video: https://www.youtube.com/watch?v=uvKMptfXtdoMeetBSDCA 2014 Performance Analysis for BSD, by Brendan Gregg, Netflix.
Description: "A tour of five relevant topics: observability tools, methodologies, benchmarking, profiling, and tracing. Tools summarized include pmcstat and DTrace."
| next prev 1/60 | |
| next prev 2/60 | |
| next prev 3/60 | |
| next prev 4/60 | |
| next prev 5/60 | |
| next prev 6/60 | |
| next prev 7/60 | |
| next prev 8/60 | |
| next prev 9/60 | |
| next prev 10/60 | |
| next prev 11/60 | |
| next prev 12/60 | |
| next prev 13/60 | |
| next prev 14/60 | |
| next prev 15/60 | |
| next prev 16/60 | |
| next prev 17/60 | |
| next prev 18/60 | |
| next prev 19/60 | |
| next prev 20/60 | |
| next prev 21/60 | |
| next prev 22/60 | |
| next prev 23/60 | |
| next prev 24/60 | |
| next prev 25/60 | |
| next prev 26/60 | |
| next prev 27/60 | |
| next prev 28/60 | |
| next prev 29/60 | |
| next prev 30/60 | |
| next prev 31/60 | |
| next prev 32/60 | |
| next prev 33/60 | |
| next prev 34/60 | |
| next prev 35/60 | |
| next prev 36/60 | |
| next prev 37/60 | |
| next prev 38/60 | |
| next prev 39/60 | |
| next prev 40/60 | |
| next prev 41/60 | |
| next prev 42/60 | |
| next prev 43/60 | |
| next prev 44/60 | |
| next prev 45/60 | |
| next prev 46/60 | |
| next prev 47/60 | |
| next prev 48/60 | |
| next prev 49/60 | |
| next prev 50/60 | |
| next prev 51/60 | |
| next prev 52/60 | |
| next prev 53/60 | |
| next prev 54/60 | |
| next prev 55/60 | |
| next prev 56/60 | |
| next prev 57/60 | |
| next prev 58/60 | |
| next prev 59/60 | |
| next prev 60/60 |
PDF: MeetBSD2014_Performance.pdf
Keywords (from pdftotext):
slide 1:
Nov,
  2014

Performance

Analysis

Brendan
  Gregg

Senior
  Performance
  Architect
slide 2:
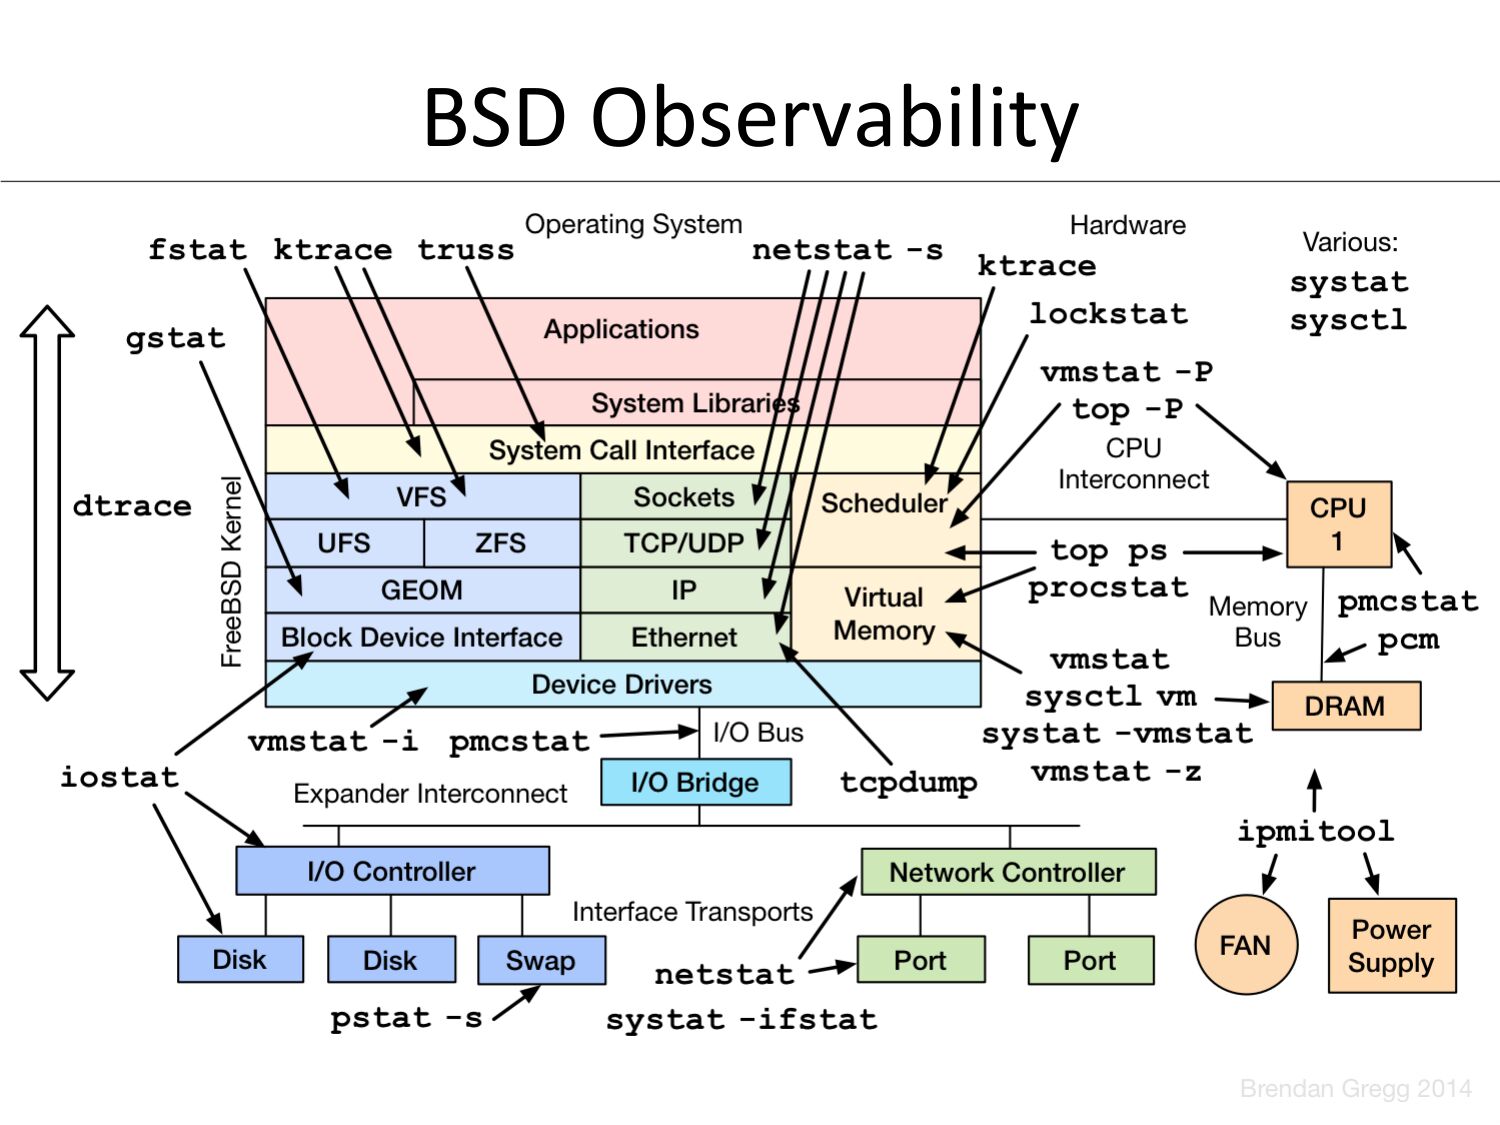
BSD
  Observability
slide 3:
• FreeBSD
  for
  content
  delivery

– Open
  Connect
  Appliances

– Approx
  33%
  of
  US
  Internet
  traffic
  at
  night

• AWS
  EC2
  Linux
  cloud
  for
  interfaces

– Tens
  of
  thousands
  of
  instances

– CentOS
  and
  Ubuntu

• Performance
  is
  criOcal

– Customer
  saOsfacOon:
  >gt;50M
  subscribers

– $$$
  price/performance
slide 4:
Brendan
  Gregg

• Senior
  Performance
  Architect,
  NeVlix

– Linux
  and
  FreeBSD
  performance

– Performance
  Engineering
  team
  (@coburnw)

• Recent
  work:

– New
  Flame
  Graph
  types
  with
  pmcstat

– DTrace
  tools
  for
  FreeBSD
  OCAs

• Previous
  work
  includes:

– Solaris
  performance,
  DTrace,
  ZFS,

methodologies,
  visualizaOons,
  findbill
slide 5:
Agenda

A
  brief
  discussion
  of
  5
  facets
  of
  performance
  analysis

on
  FreeBSD

1. Observability
  Tools

2. Methodologies

3. Benchmarking

4. Tracing

5. Counters
slide 6:
1.
  Observability
  Tools
slide 7:
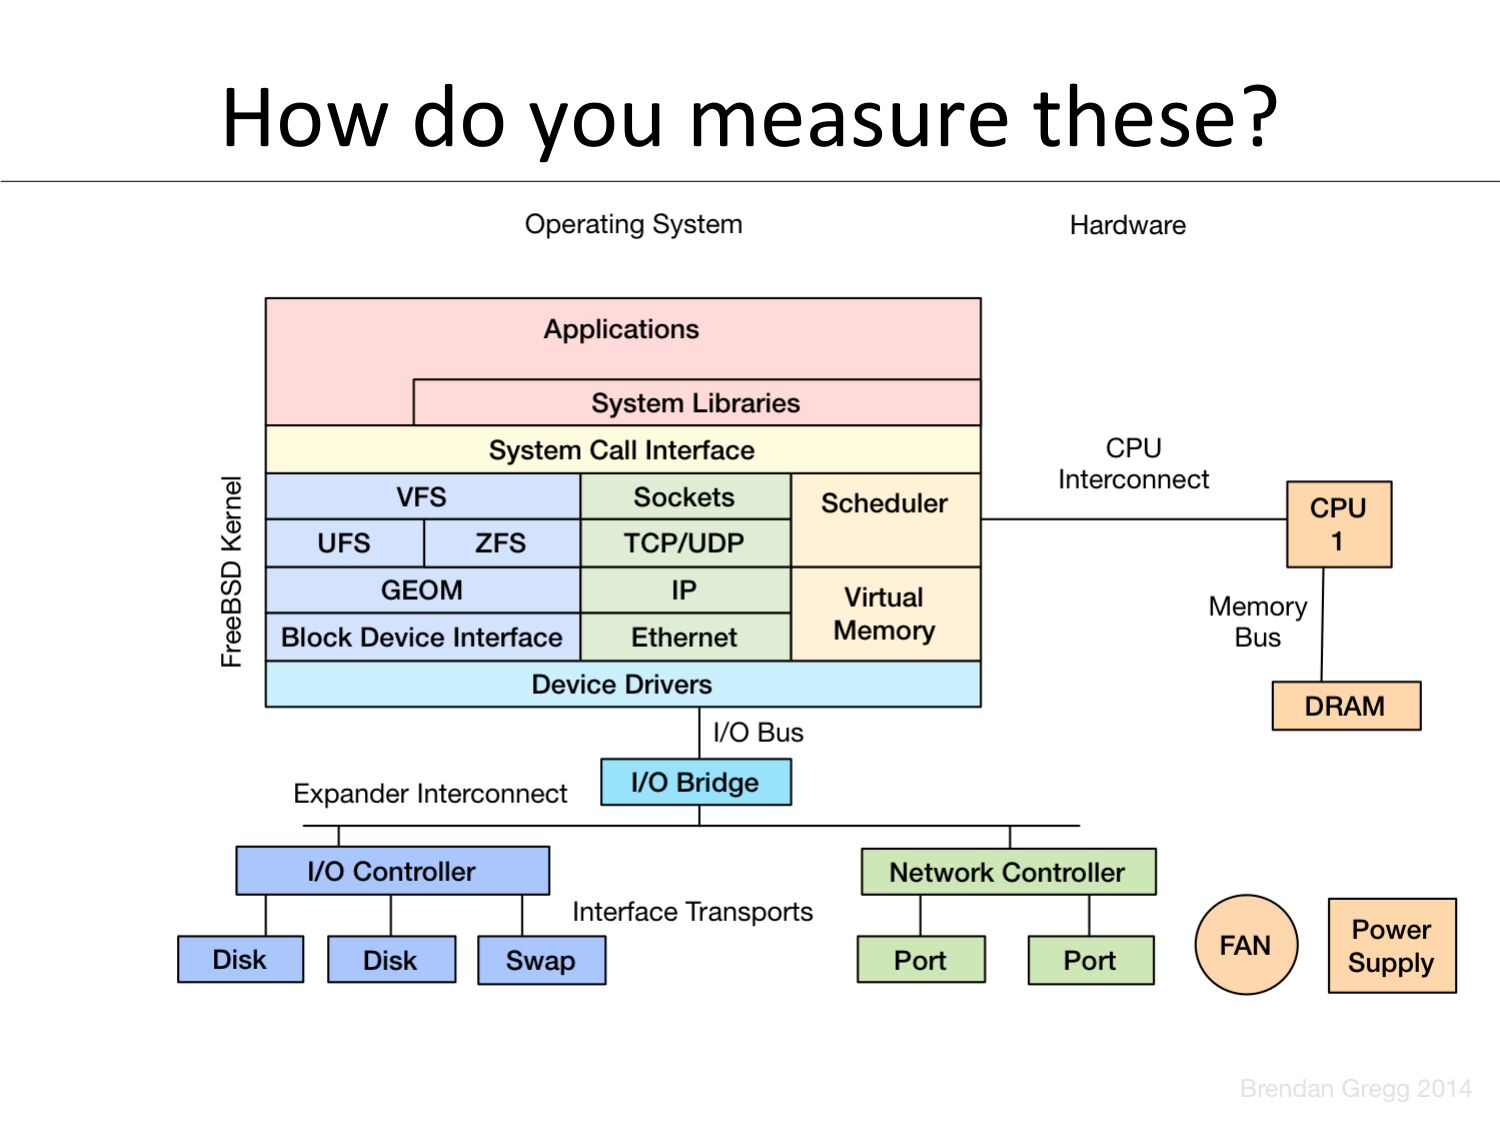
How
  do
  you
  measure
  these?
slide 8:
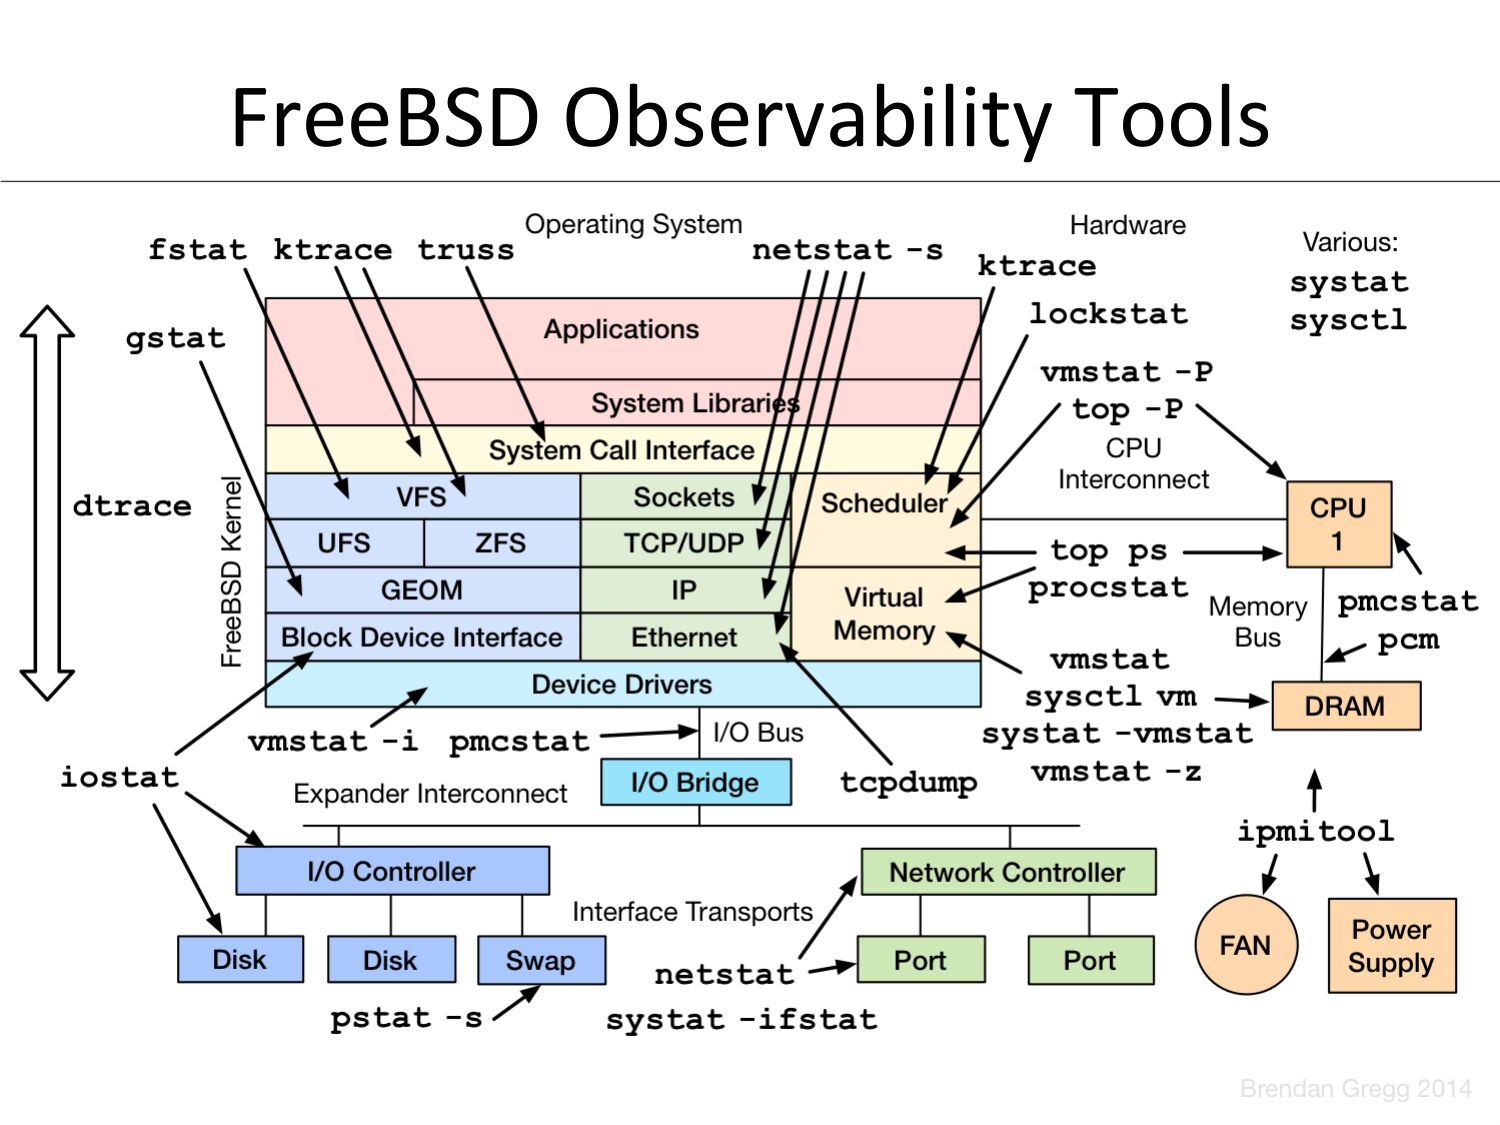
FreeBSD
  Observability
  Tools
slide 9:
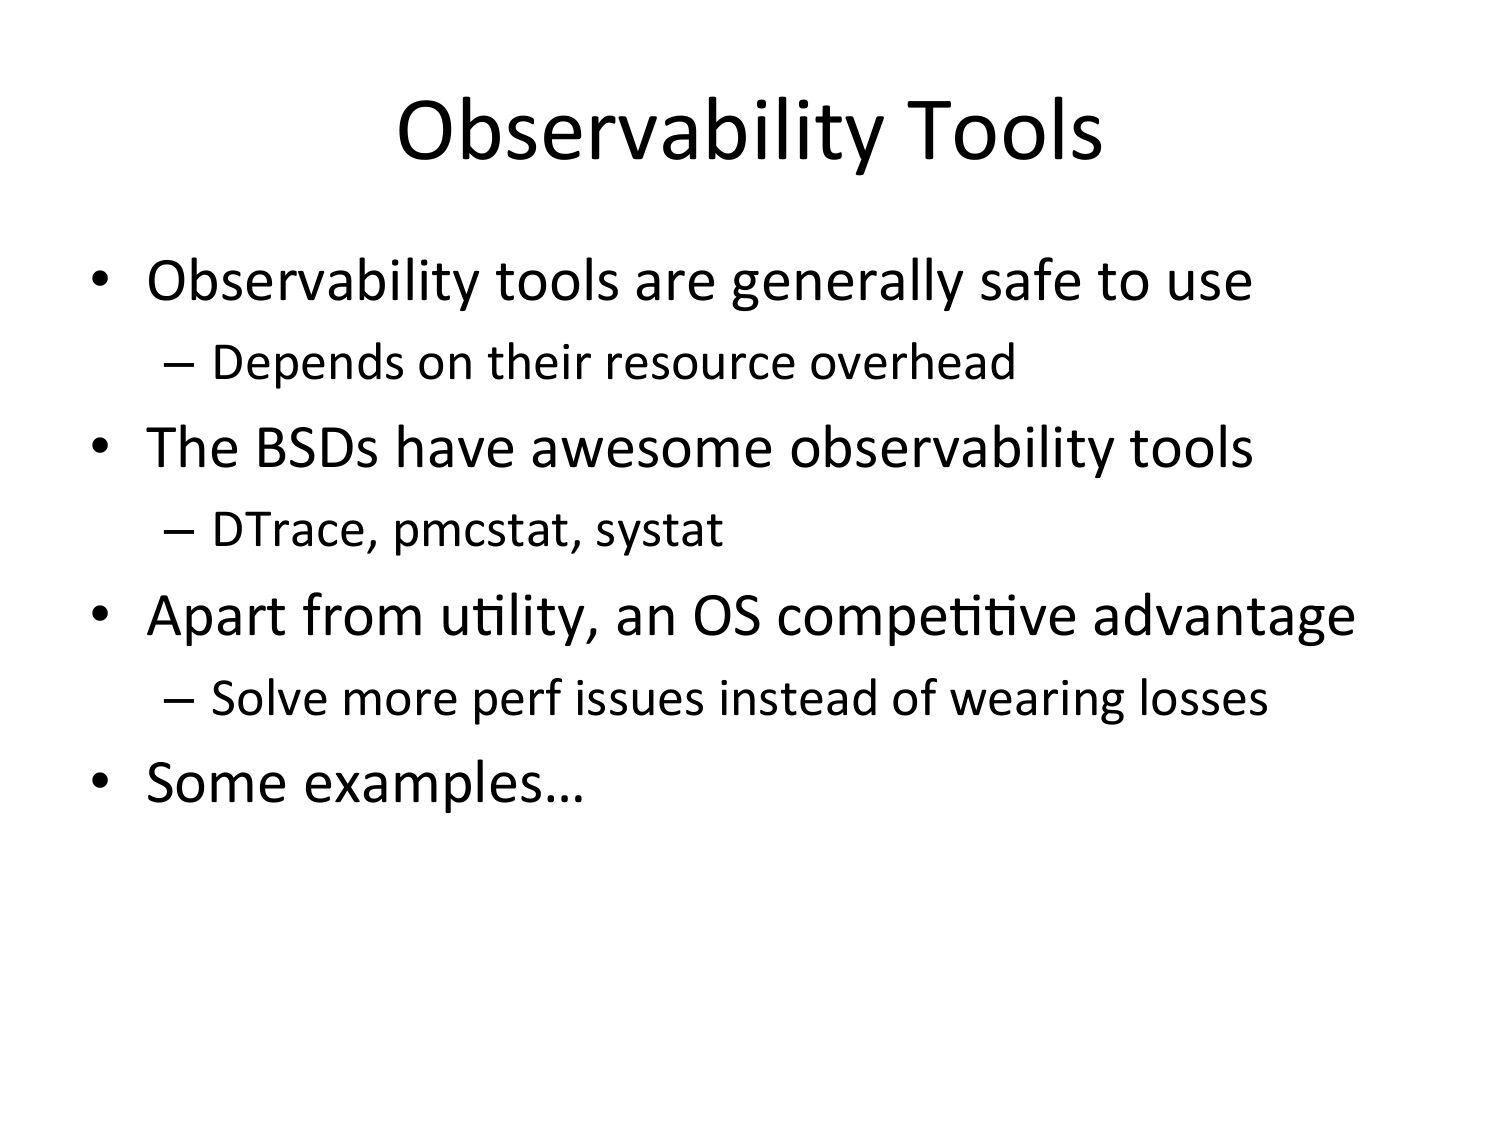
Observability
  Tools

• Observability
  tools
  are
  generally
  safe
  to
  use

– Depends
  on
  their
  resource
  overhead

• The
  BSDs
  have
  awesome
  observability
  tools

– DTrace,
  pmcstat,
  systat

• Apart
  from
  uOlity,
  an
  OS
  compeOOve
  advantage

– Solve
  more
  perf
  issues
  instead
  of
  wearing
  losses

• Some
  examples…
slide 10:
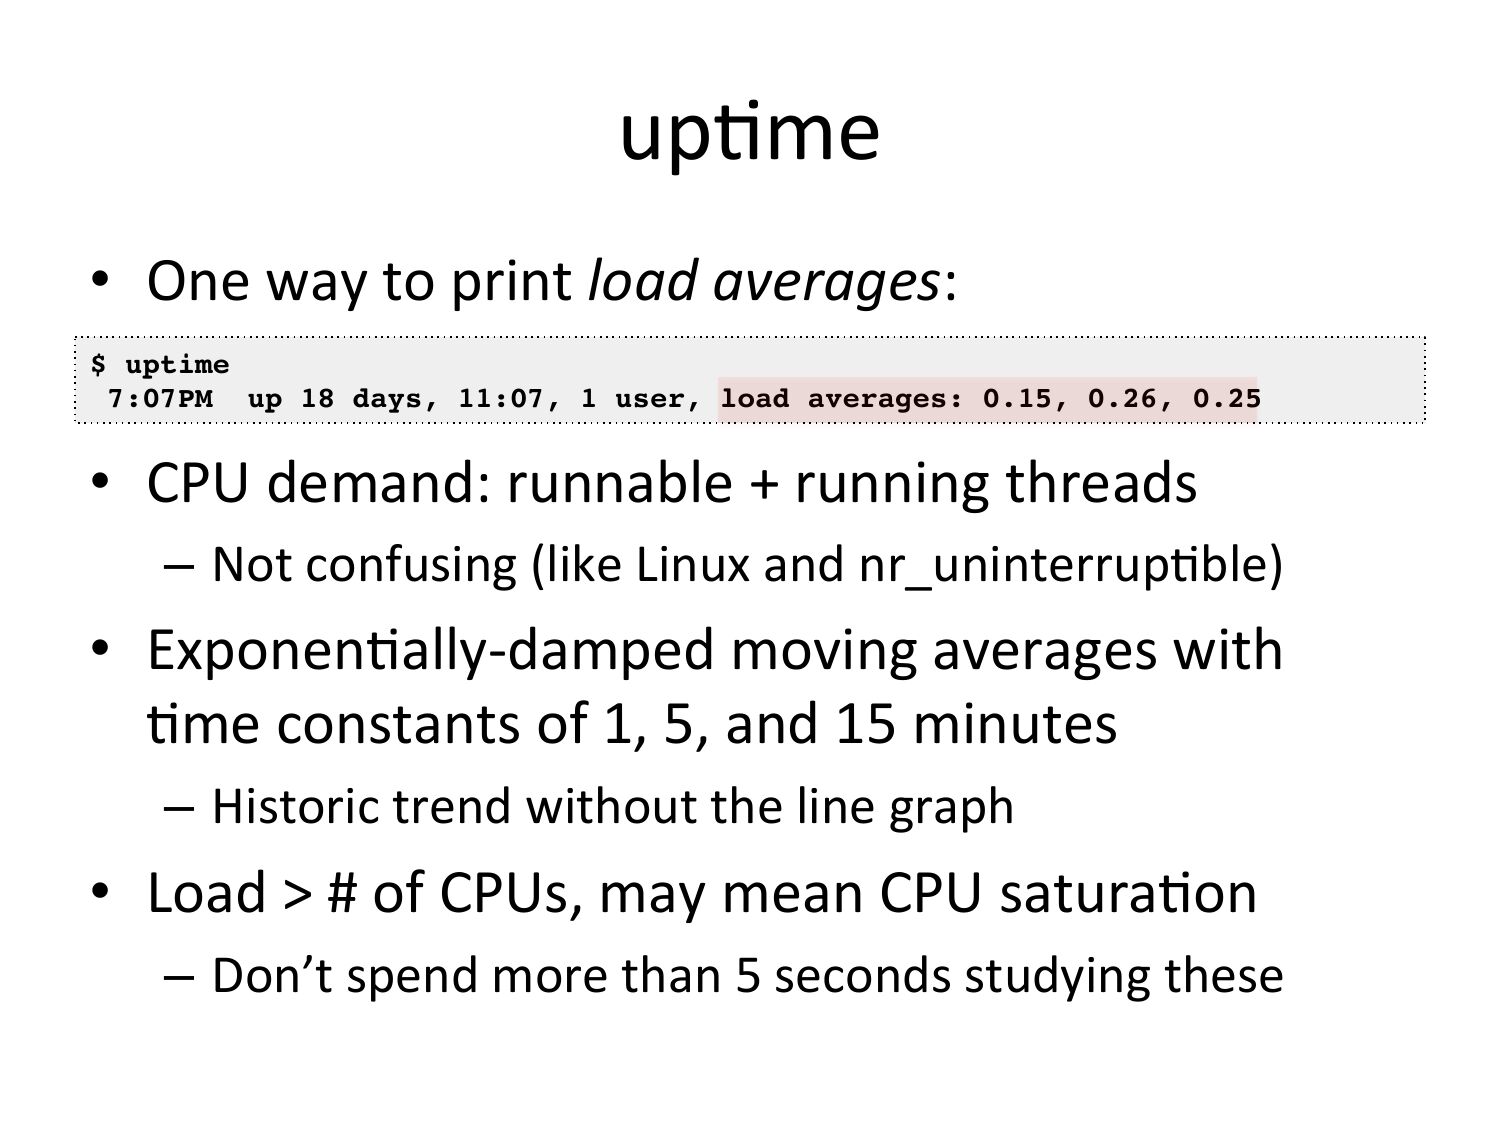
upOme • One way to print load averages: • $ uptime! 7:07PM up 18 days, 11:07, 1 user, load averages: 0.15, 0.26, 0.25! • CPU demand: runnable + running threads – Not confusing (like Linux and nr_uninterrupOble) • ExponenOally-‐damped moving averages with Ome constants of 1, 5, and 15 minutes – Historic trend without the line graph • Load >gt; # of CPUs, may mean CPU saturaOon – Don’t spend more than 5 seconds studying theseslide 11:
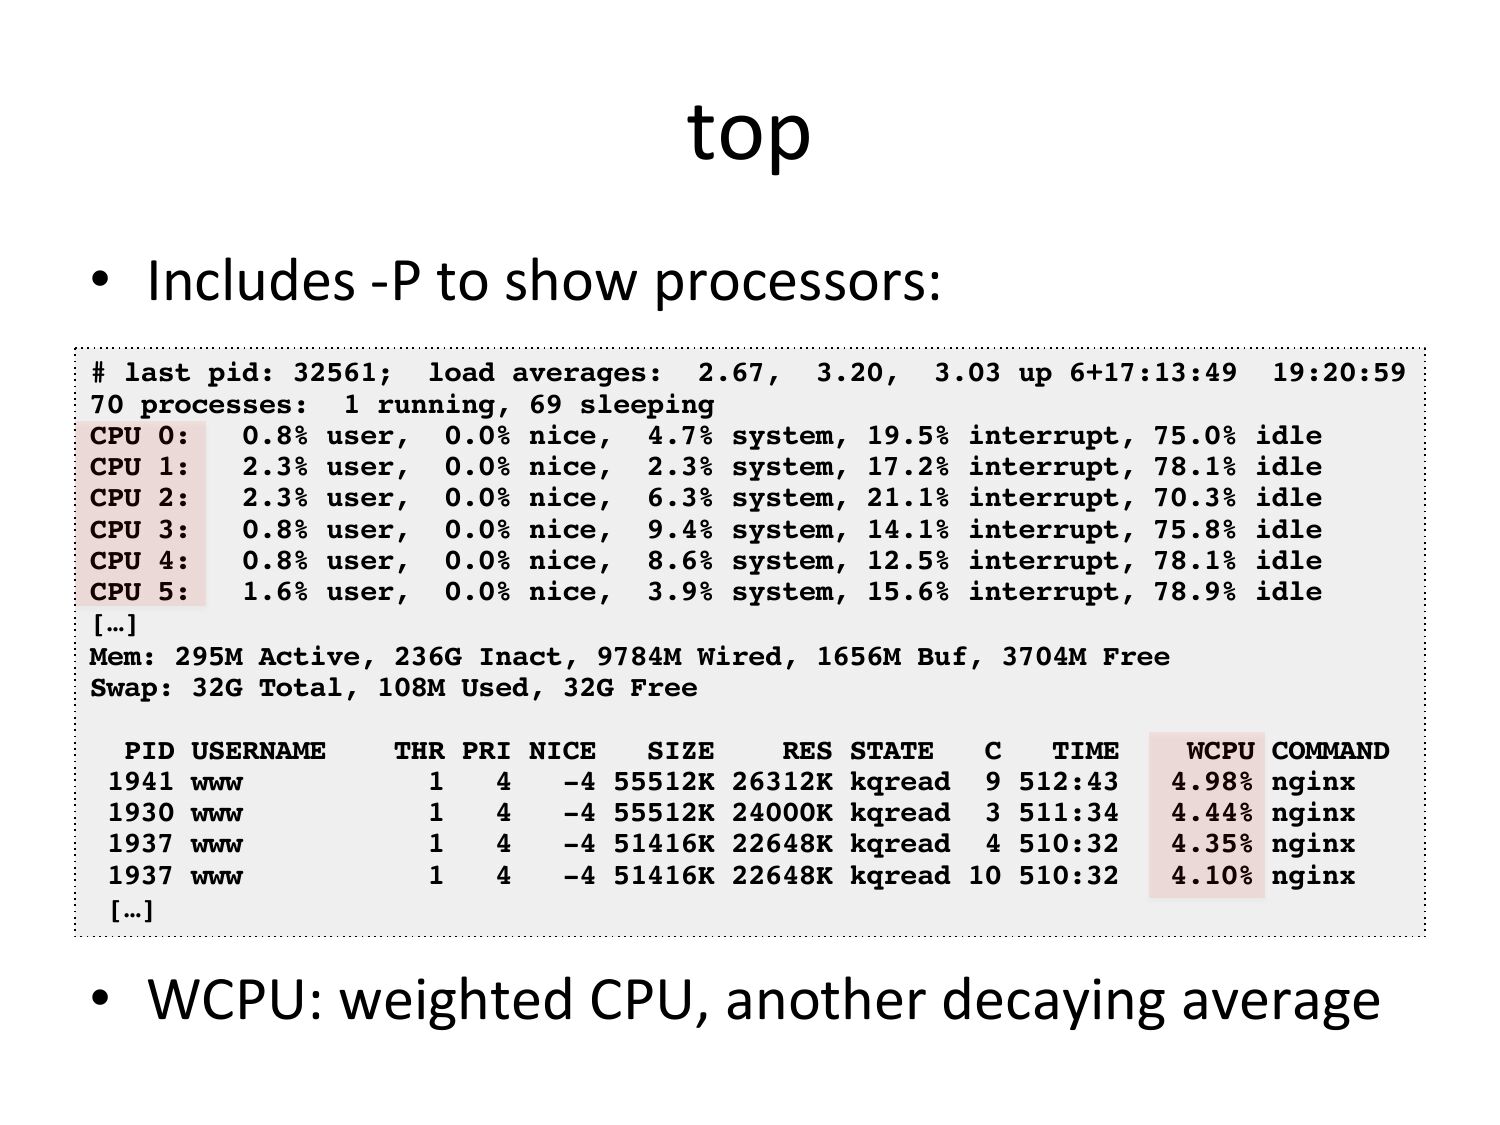
top • Includes -‐P to show processors: # last pid: 32561; load averages: 2.67, 3.20, 3.03 up 6+17:13:49 19:20:59! 70 processes: 1 running, 69 sleeping! CPU 0: 0.8% user, 0.0% nice, 4.7% system, 19.5% interrupt, 75.0% idle! CPU 1: 2.3% user, 0.0% nice, 2.3% system, 17.2% interrupt, 78.1% idle! CPU 2: 2.3% user, 0.0% nice, 6.3% system, 21.1% interrupt, 70.3% idle! CPU 3: 0.8% user, 0.0% nice, 9.4% system, 14.1% interrupt, 75.8% idle! CPU 4: 0.8% user, 0.0% nice, 8.6% system, 12.5% interrupt, 78.1% idle! CPU 5: 1.6% user, 0.0% nice, 3.9% system, 15.6% interrupt, 78.9% idle! […]! Mem: 295M Active, 236G Inact, 9784M Wired, 1656M Buf, 3704M Free! Swap: 32G Total, 108M Used, 32G Free! PID USERNAME THR PRI NICE SIZE RES STATE TIME WCPU COMMAND! 1941 www -4 55512K 26312K kqread 9 512:43 4.98% nginx! 1930 www -4 55512K 24000K kqread 3 511:34 4.44% nginx! 1937 www -4 51416K 22648K kqread 4 510:32 4.35% nginx! 1937 www -4 51416K 22648K kqread 10 510:32 4.10% nginx! […]! • WCPU: weighted CPU, another decaying averageslide 12:
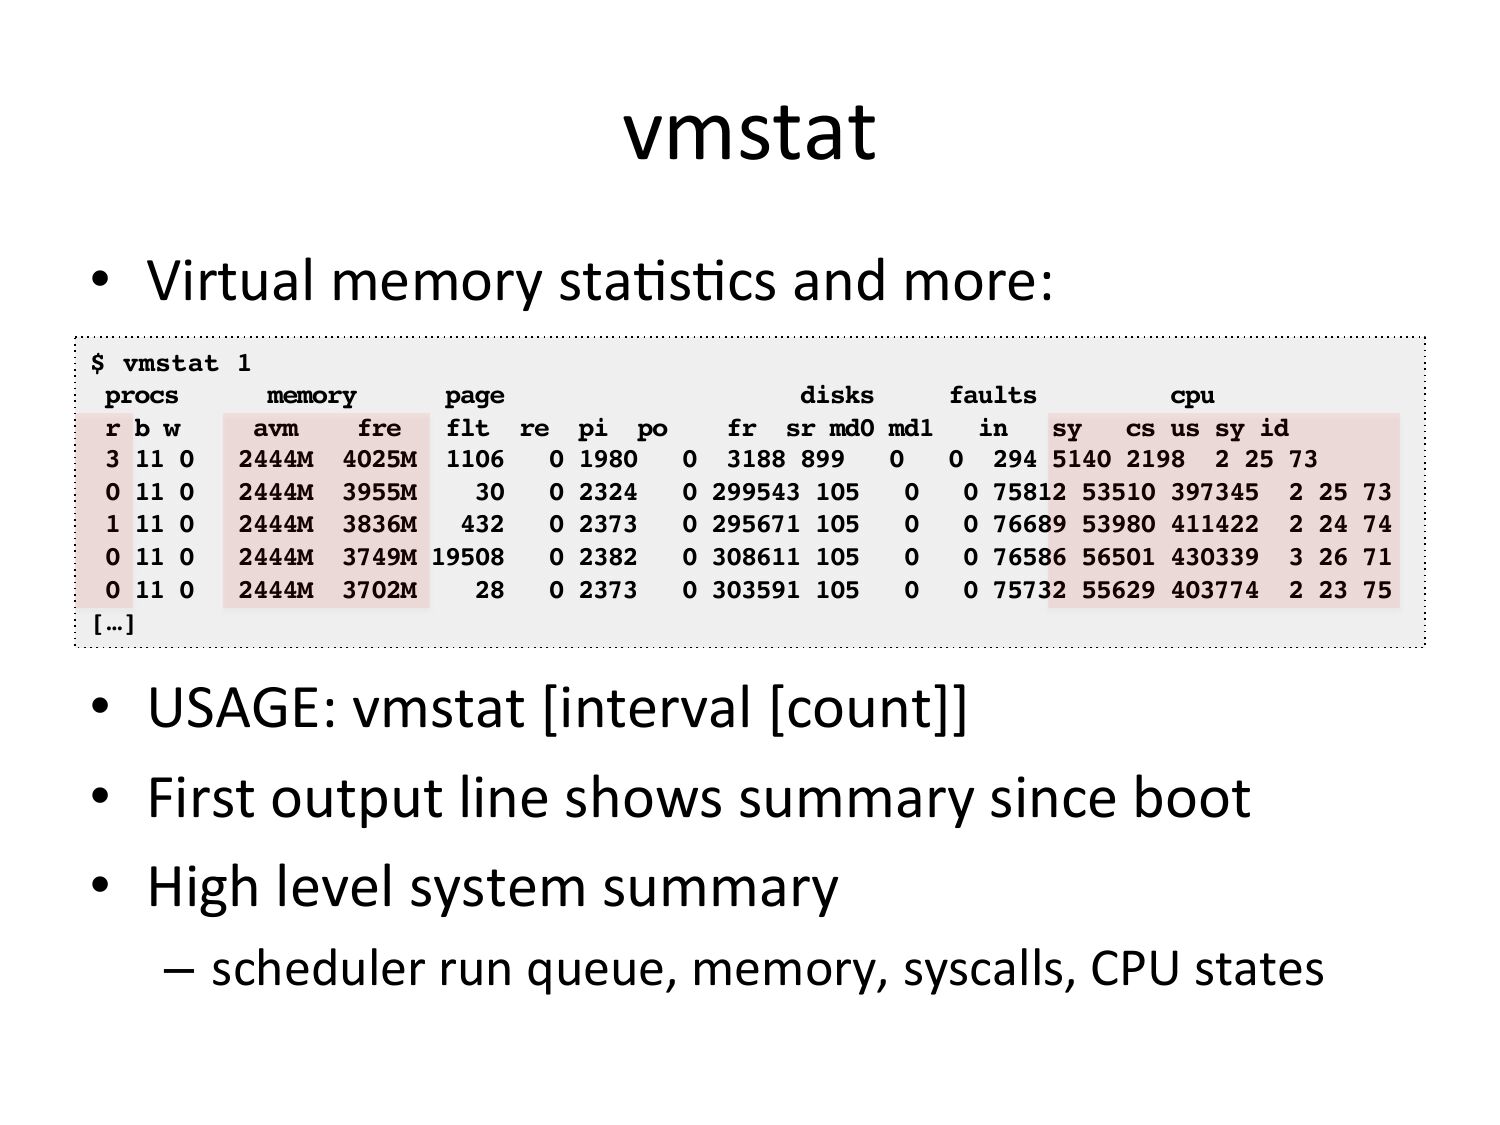
vmstat

• Virtual
  memory
  staOsOcs
  and
  more:

$ vmstat 1!
procs
memory
page
disks
faults
cpu!
r b w
avm
fre
flt re pi po
fr sr md0 md1
cs us sy id!
3 11 0
2444M 4025M 1106
0 1980
0 3188 899
0 294 5140 2198 2 25 73!
0 11 0
2444M 3955M
0 2324
0 299543 105
0 75812 53510 397345 2 25 73!
1 11 0
2444M 3836M
0 2373
0 295671 105
0 76689 53980 411422 2 24 74!
0 11 0
2444M 3749M 19508
0 2382
0 308611 105
0 76586 56501 430339 3 26 71!
0 11 0
2444M 3702M
0 2373
0 303591 105
0 75732 55629 403774 2 23 75!
[…]!
• USAGE:
  vmstat
  [interval
  [count]]

• First
  output
  line
  shows
  summary
  since
  boot

• High
  level
  system
  summary

– scheduler
  run
  queue,
  memory,
  syscalls,
  CPU
  states
slide 13:
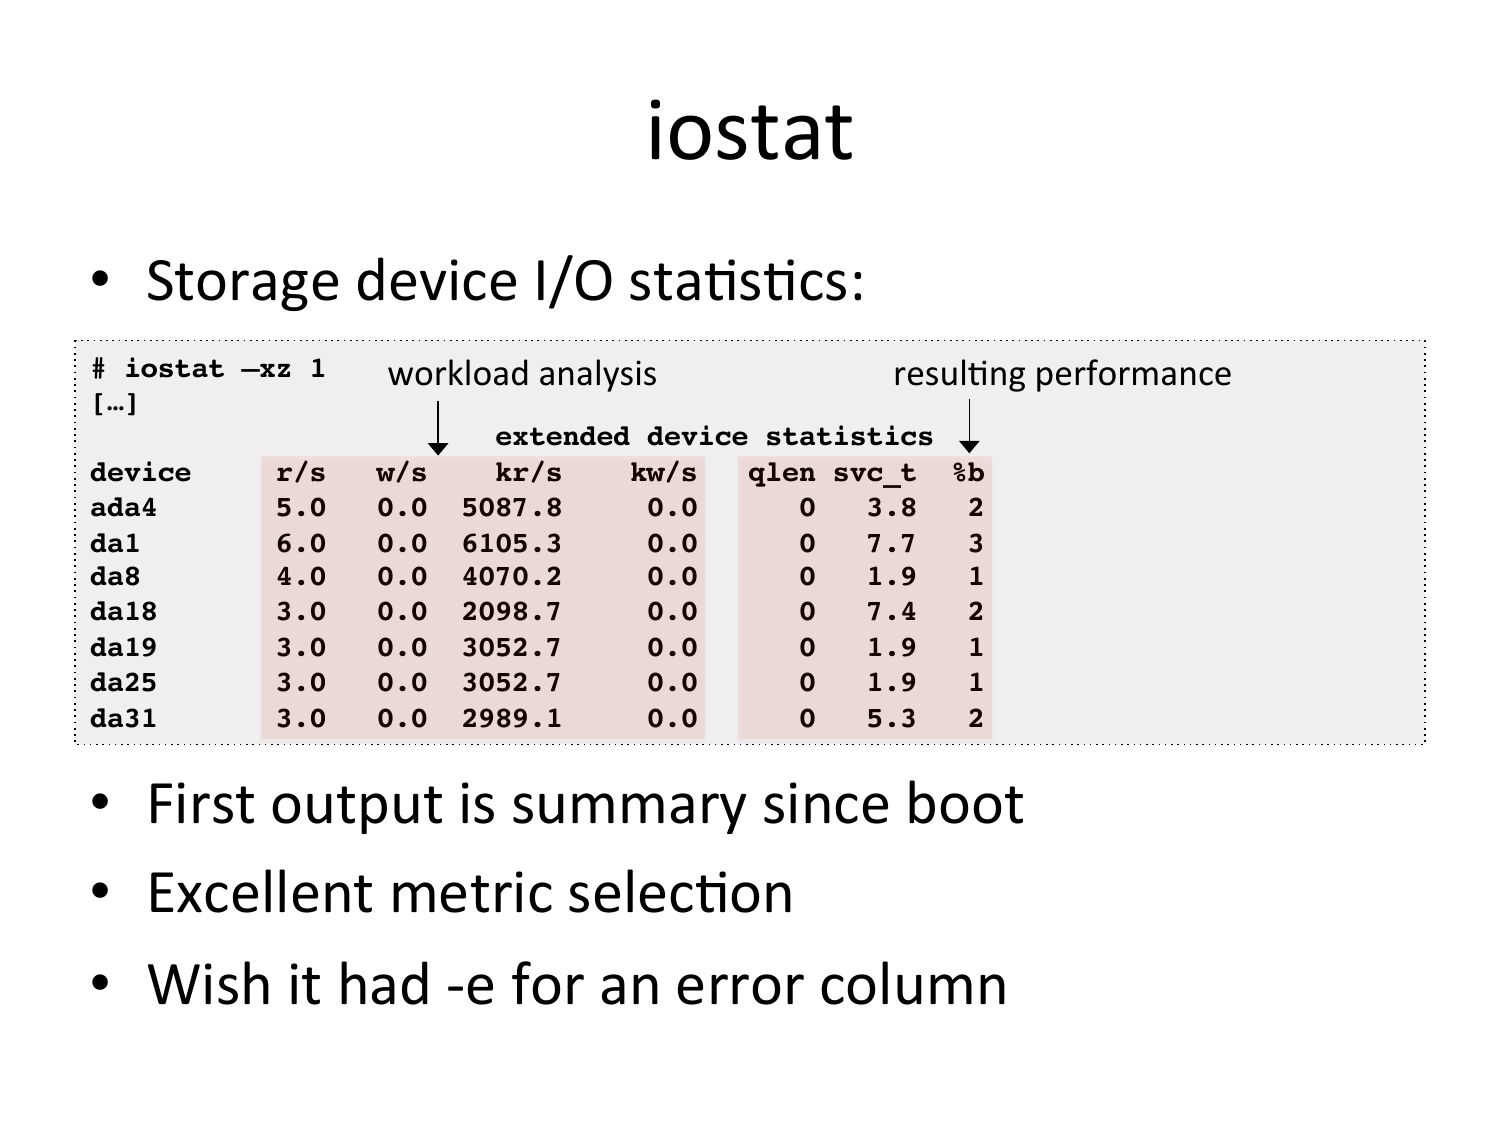
iostat • Storage device I/O staOsOcs: # iostat –xz 1! […]! device ada4 da1 da8 da18 da19 da25 da31 r/s workload analysis w/s resulOng performance extended device statistics ! kr/s kw/s qlen svc_t %b ! 2 ! 3 ! 1 ! 2 ! 1 ! 1 ! 2 ! • First output is summary since boot • Excellent metric selecOon • Wish it had -‐e for an error columnslide 14:
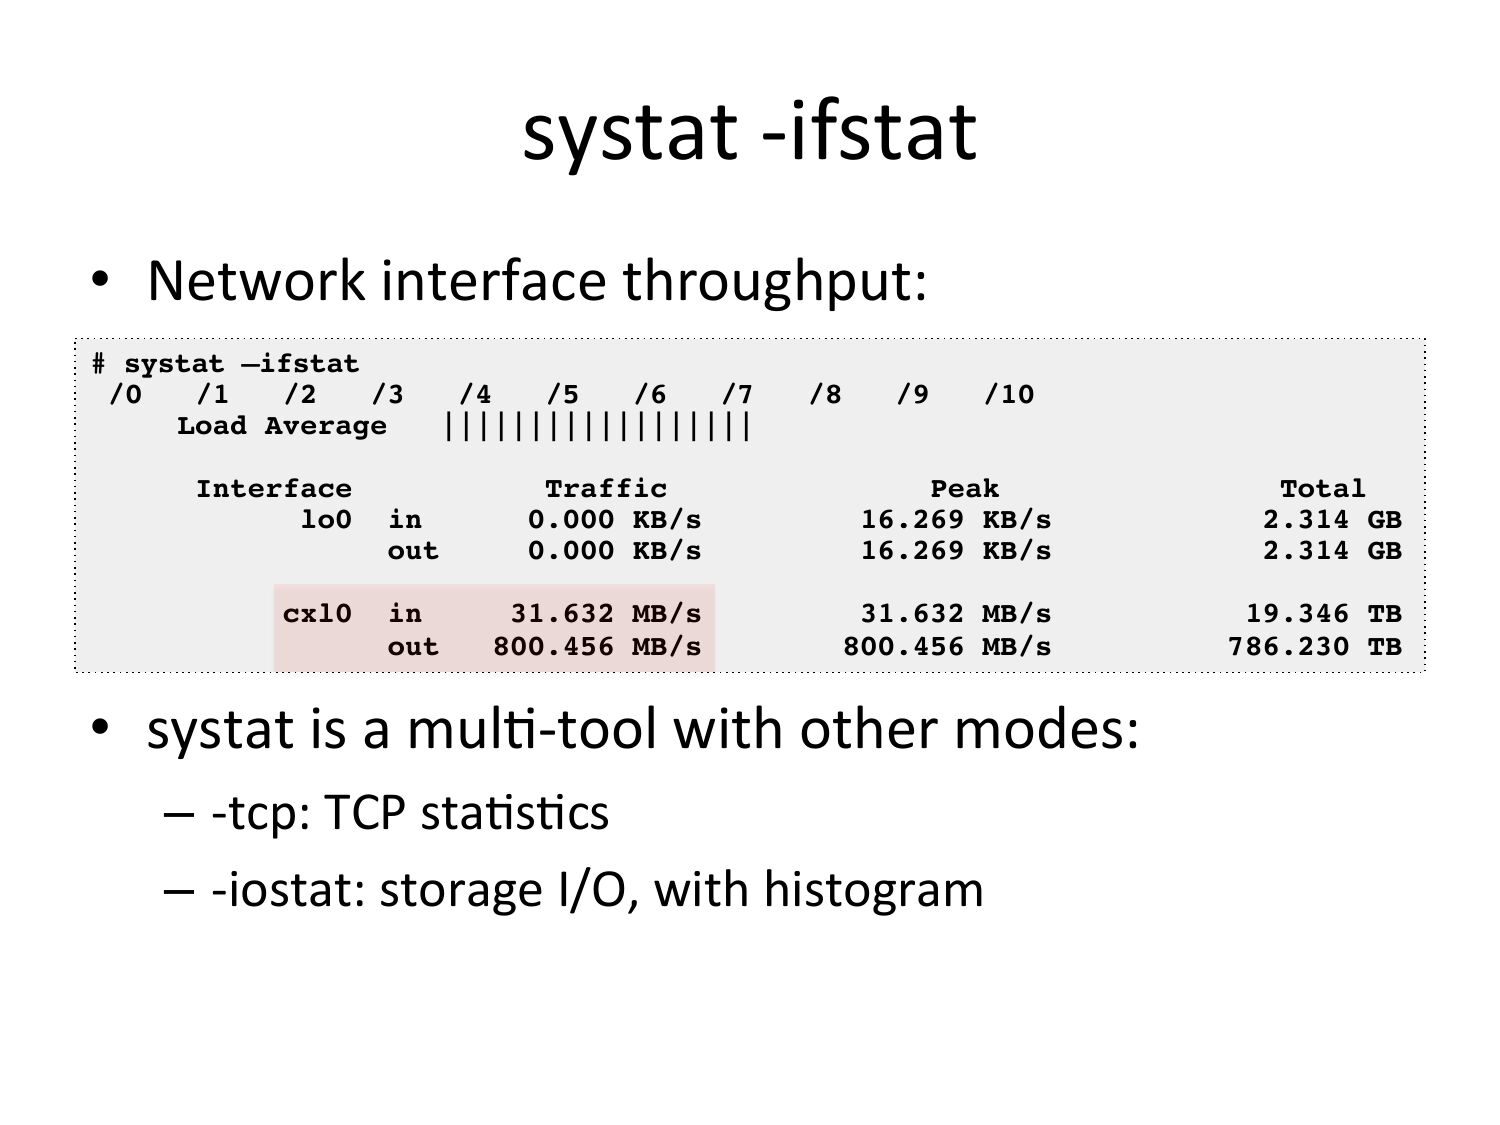
systat -‐ifstat • Network interface throughput: # systat –ifstat! /10! Load Average |||||||||||||||||| ! Interface Traffic Peak lo0 in 0.000 KB/s 16.269 KB/s out 0.000 KB/s 16.269 KB/s cxl0 in 31.632 MB/s 31.632 MB/s out 800.456 MB/s 800.456 MB/s • systat is a mulO-‐tool with other modes: – -‐tcp: TCP staOsOcs – -‐iostat: storage I/O, with histogram Total! 2.314 GB! 2.314 GB! 19.346 TB! 786.230 TB!slide 15:
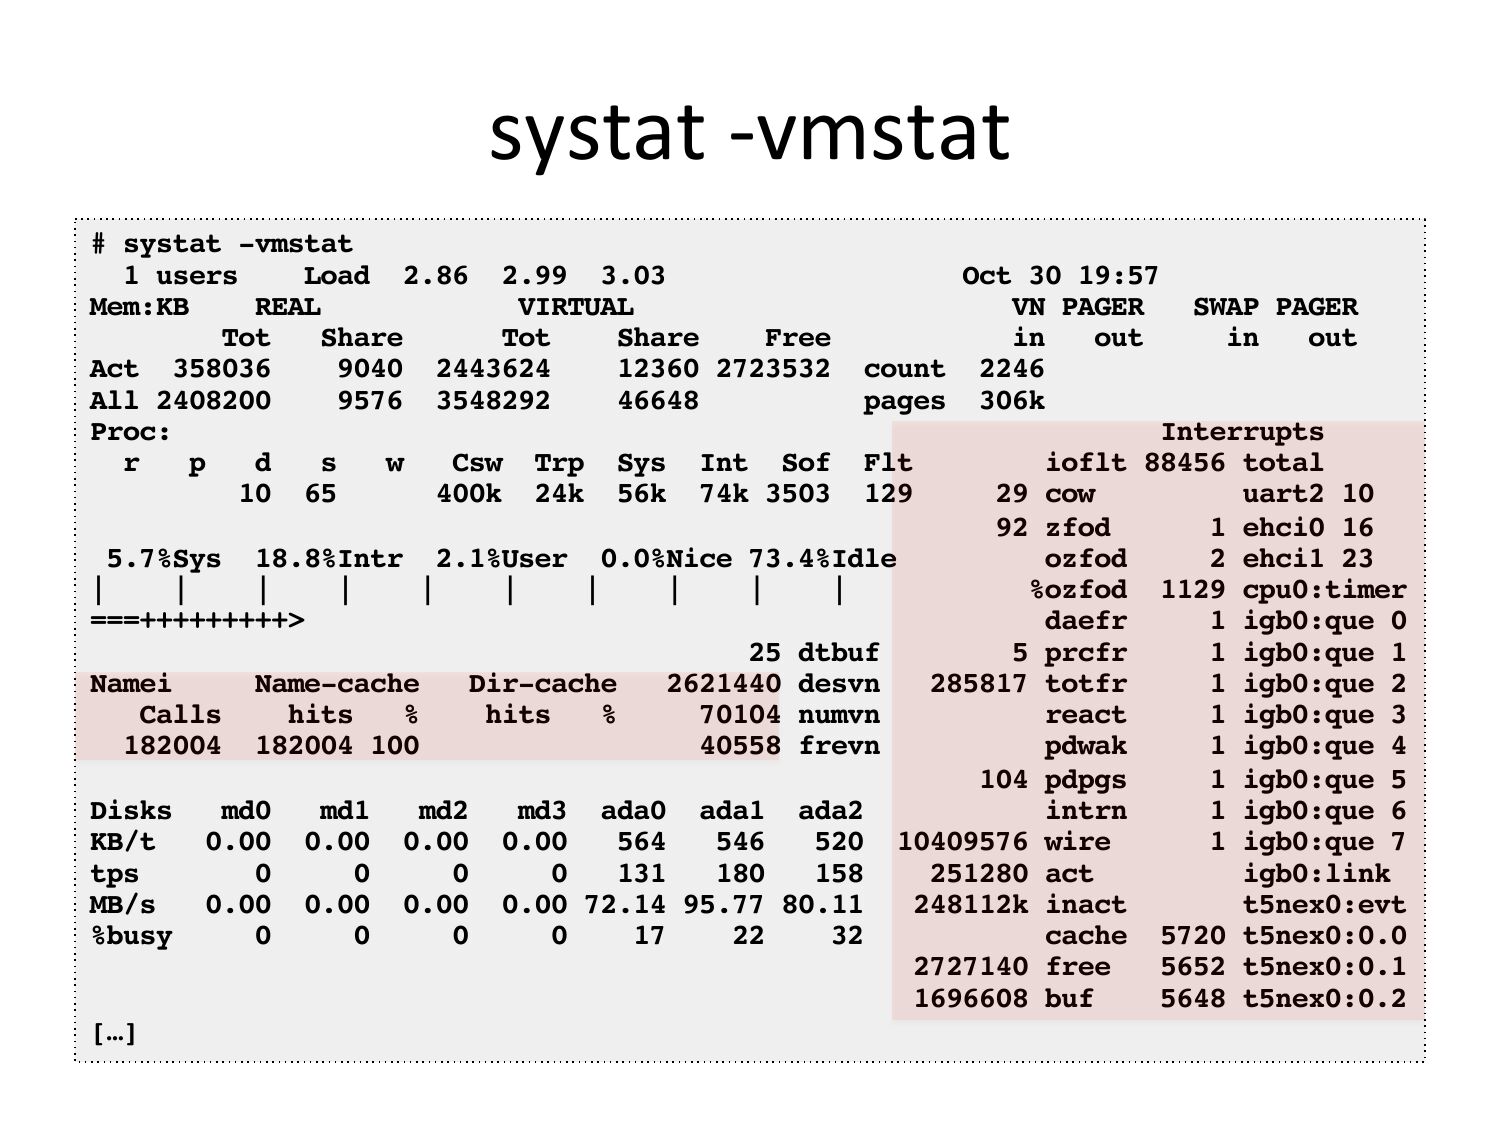
systat -‐vmstat # systat -vmstat! 1 users Load 2.86 2.99 3.03 Mem:KB REAL VIRTUAL Tot Share Tot Share Free Act 358036 9040 2443624 12360 2723532 All 2408200 9576 3548292 Proc: Csw Trp Sys Int Sof 10 65 400k 24k 56k 74k 3503 Oct 30 19:57! VN PAGER SWAP PAGER! out out! count 2246! pages 306k! Interrupts! Flt ioflt 88456 total! 29 cow uart2 10! 92 zfod 1 ehci0 16! 5.7%Sys 18.8%Intr 2.1%User 0.0%Nice 73.4%Idle ozfod 2 ehci1 23! %ozfod 1129 cpu0:timer! ===+++++++++>gt; daefr 1 igb0:que 0! 25 dtbuf 5 prcfr 1 igb0:que 1! Namei Name-cache Dir-cache 2621440 desvn 285817 totfr 1 igb0:que 2! Calls hits hits 70104 numvn react 1 igb0:que 3! 182004 182004 100 40558 frevn pdwak 1 igb0:que 4! 104 pdpgs 1 igb0:que 5! Disks md0 md1 md2 md3 ada0 ada1 ada2 intrn 1 igb0:que 6! KB/t 0.00 0.00 0.00 0.00 520 10409576 wire 1 igb0:que 7! tps 251280 act igb0:link! MB/s 0.00 0.00 0.00 0.00 72.14 95.77 80.11 248112k inact t5nex0:evt! %busy cache 5720 t5nex0:0.0! 2727140 free 5652 t5nex0:0.1! 1696608 buf 5648 t5nex0:0.2! […]!slide 16:
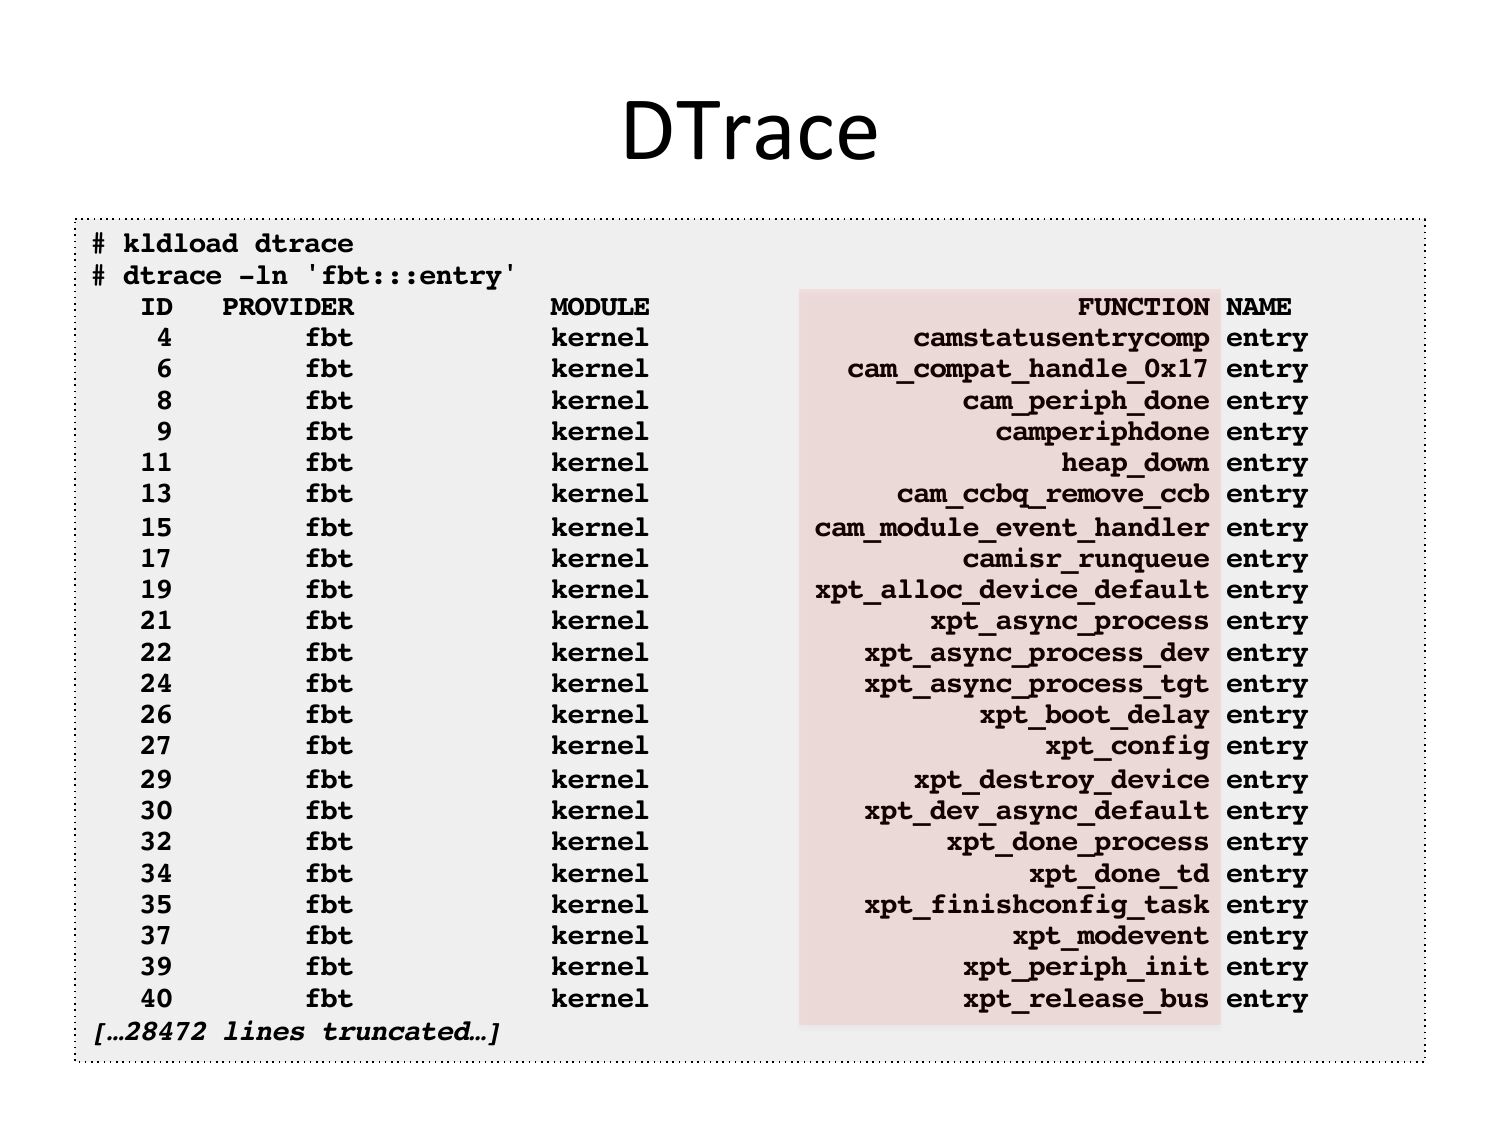
DTrace

# kldload dtrace!
# dtrace -ln 'fbt:::entry' !
PROVIDER
MODULE
fbt
kernel
fbt
kernel
fbt
kernel
fbt
kernel
fbt
kernel
fbt
kernel
fbt
kernel
fbt
kernel
fbt
kernel
fbt
kernel
fbt
kernel
fbt
kernel
fbt
kernel
fbt
kernel
fbt
kernel
fbt
kernel
fbt
kernel
fbt
kernel
fbt
kernel
fbt
kernel
fbt
kernel
fbt
kernel
[…28472 lines truncated…]!
FUNCTION NAME!
camstatusentrycomp entry!
cam_compat_handle_0x17 entry!
cam_periph_done entry!
camperiphdone entry!
heap_down entry!
cam_ccbq_remove_ccb entry!
cam_module_event_handler entry!
camisr_runqueue entry!
xpt_alloc_device_default entry!
xpt_async_process entry!
xpt_async_process_dev entry!
xpt_async_process_tgt entry!
xpt_boot_delay entry!
xpt_config entry!
xpt_destroy_device entry!
xpt_dev_async_default entry!
xpt_done_process entry!
xpt_done_td entry!
xpt_finishconfig_task entry!
xpt_modevent entry!
xpt_periph_init entry!
xpt_release_bus entry!
slide 17:
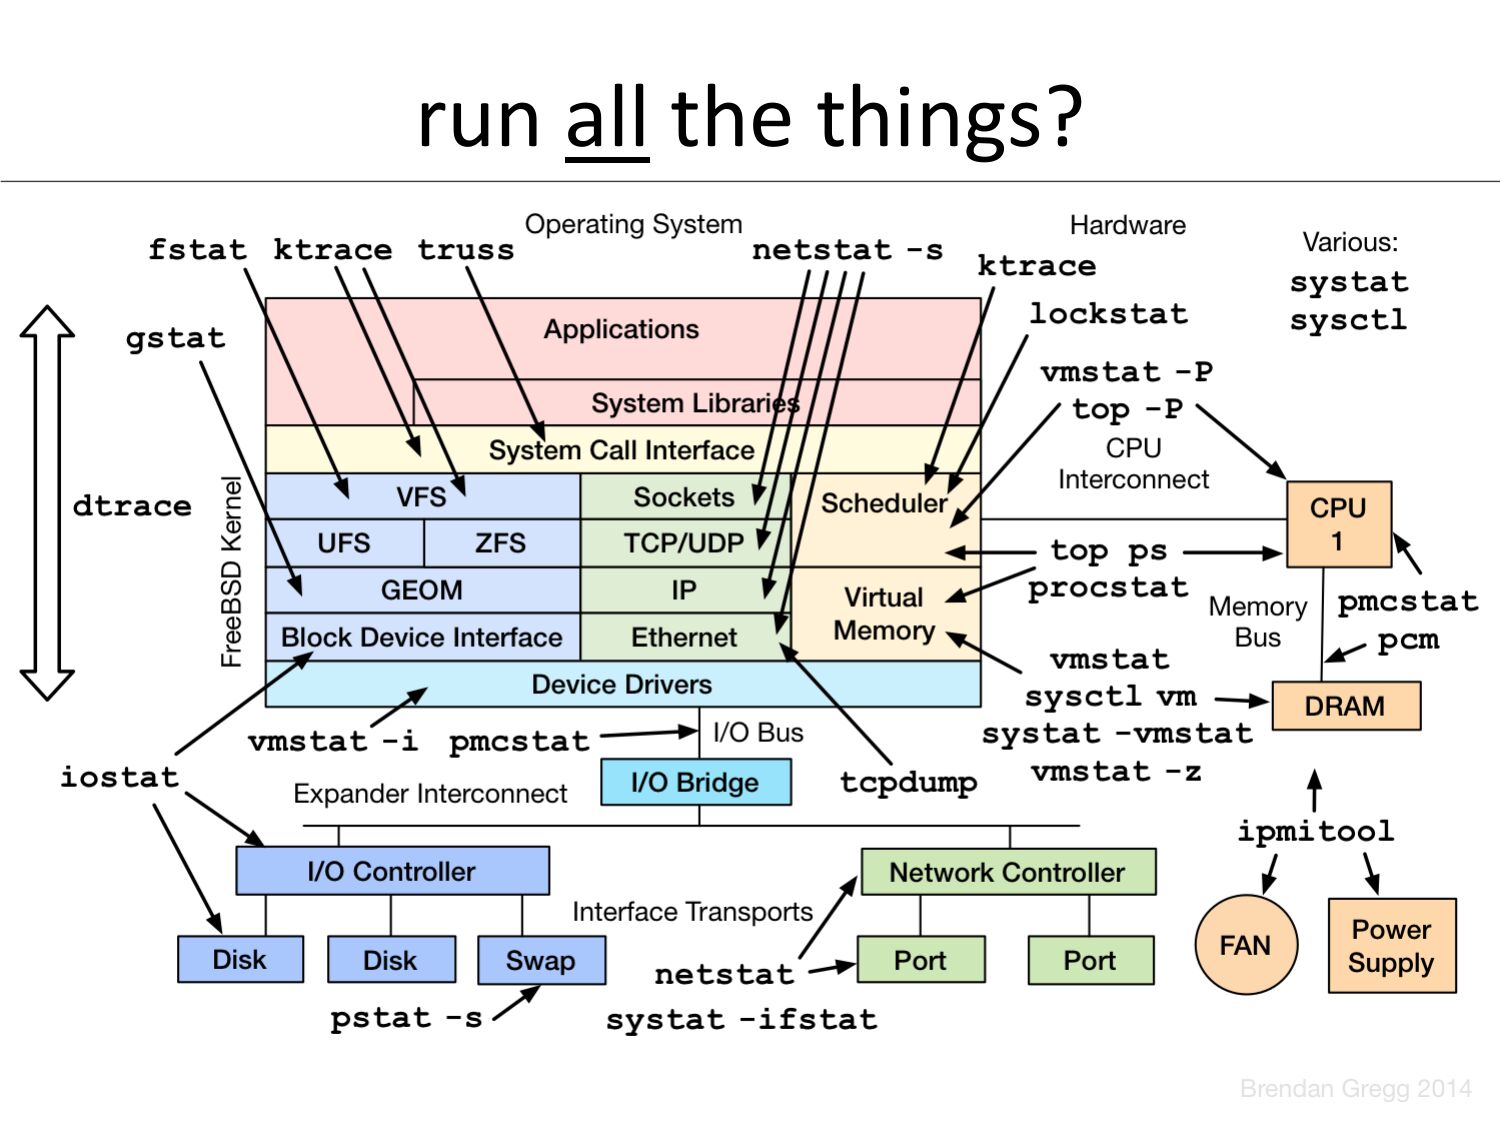
run
  all
  the
  things?
slide 18:
2.
  Methodologies
slide 19:
Methodologies
  &
  Tools

• Many
  awesome
  tools

– Only
  awesome
  if
  you
  actually
  use
  them

– The
  real
  problem
  becomes
  how
  to
  use
  them

• Methodologies
  can
  guide
  usage
slide 20:
An5-‐Methodologies • The lack of a deliberate methodology… • Street Light AnO-‐Method: – 1. Pick observability tools that are • Familiar • Found on the Internet • Found at random – 2. Run tools – 3. Look for obvious issues • Drunk Man AnO-‐Method: – Tune things at random unOl the problem goes awayslide 21:
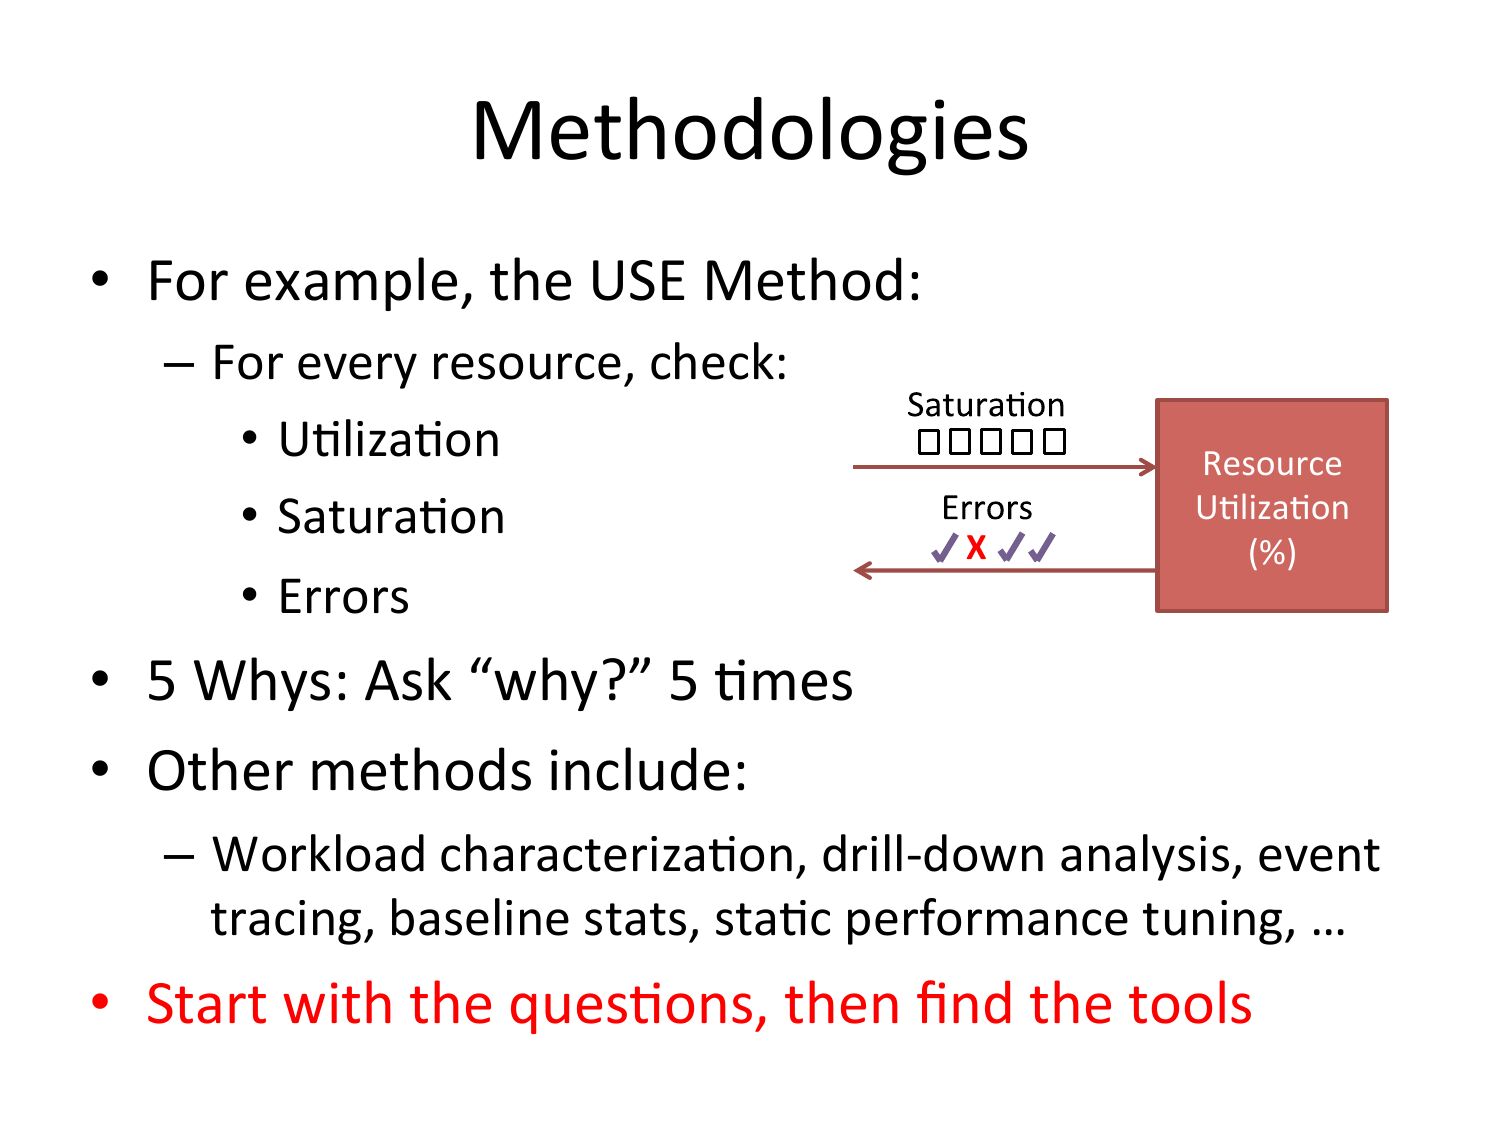
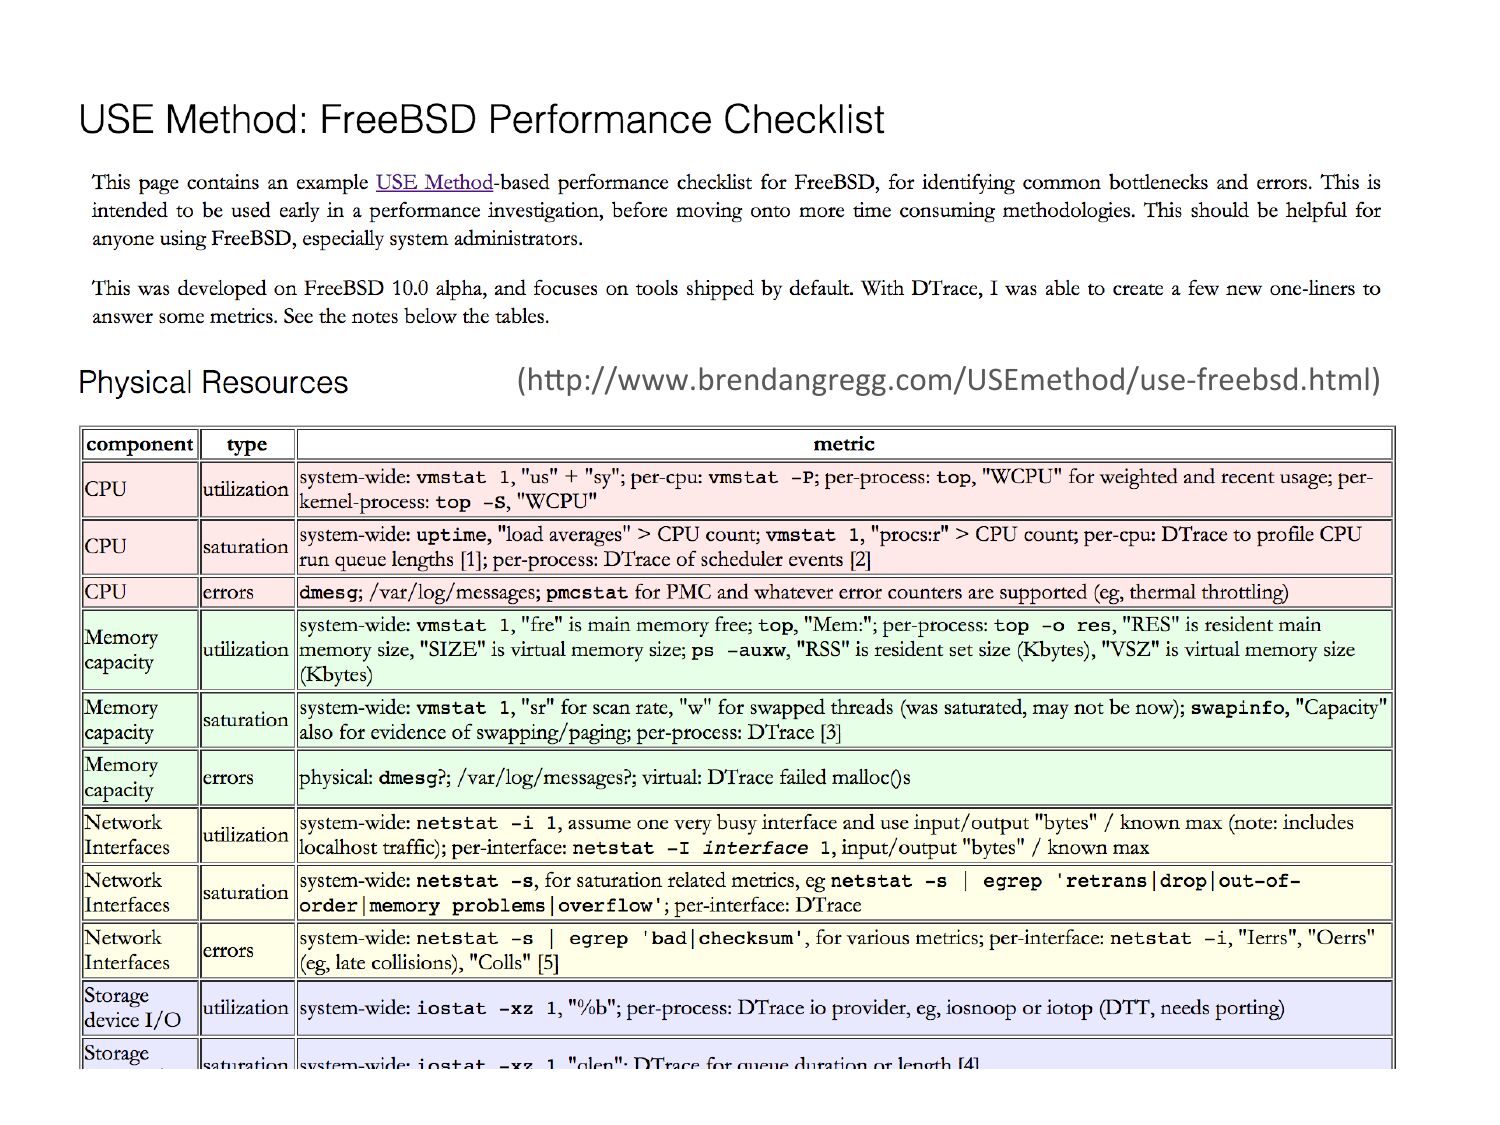
Methodologies • For example, the USE Method: – For every resource, check: • UOlizaOon • SaturaOon • Errors X Resource UOlizaOon (%) • 5 Whys: Ask “why?” 5 Omes • Other methods include: – Workload characterizaOon, drill-‐down analysis, event tracing, baseline stats, staOc performance tuning, … • Start with the quesOons, then find the toolsslide 22:
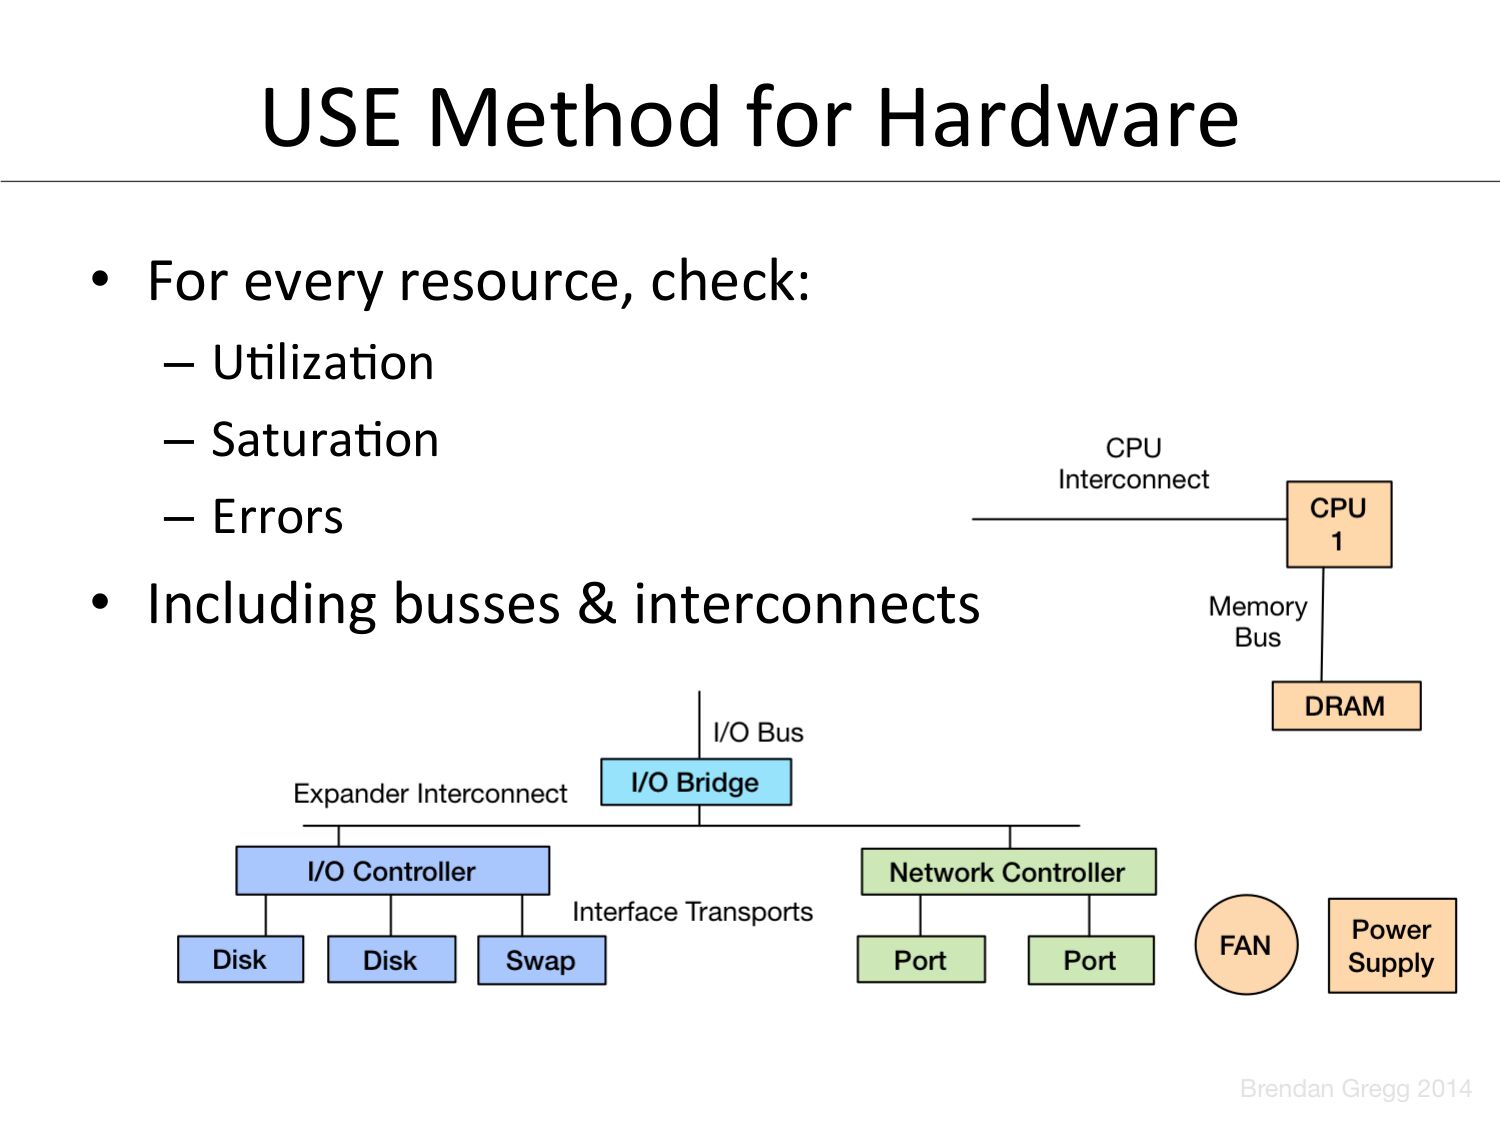
USE
  Method
  for
  Hardware

• For
  every
  resource,
  check:

– UOlizaOon

– SaturaOon

– Errors

• Including
  busses
  &
  interconnects
slide 23:
(hpp://www.brendangregg.com/USEmethod/use-‐freebsd.html)slide 24:
3.
  Benchmarking
slide 25:
~100%
  of
  benchmarks
  are
  wrong
slide 26:
The
  energy
  needed

to
  refute
  benchmarks

is
  mulOple
  orders
  of
  magnitude

bigger
  than
  to
  run
  them
slide 27:
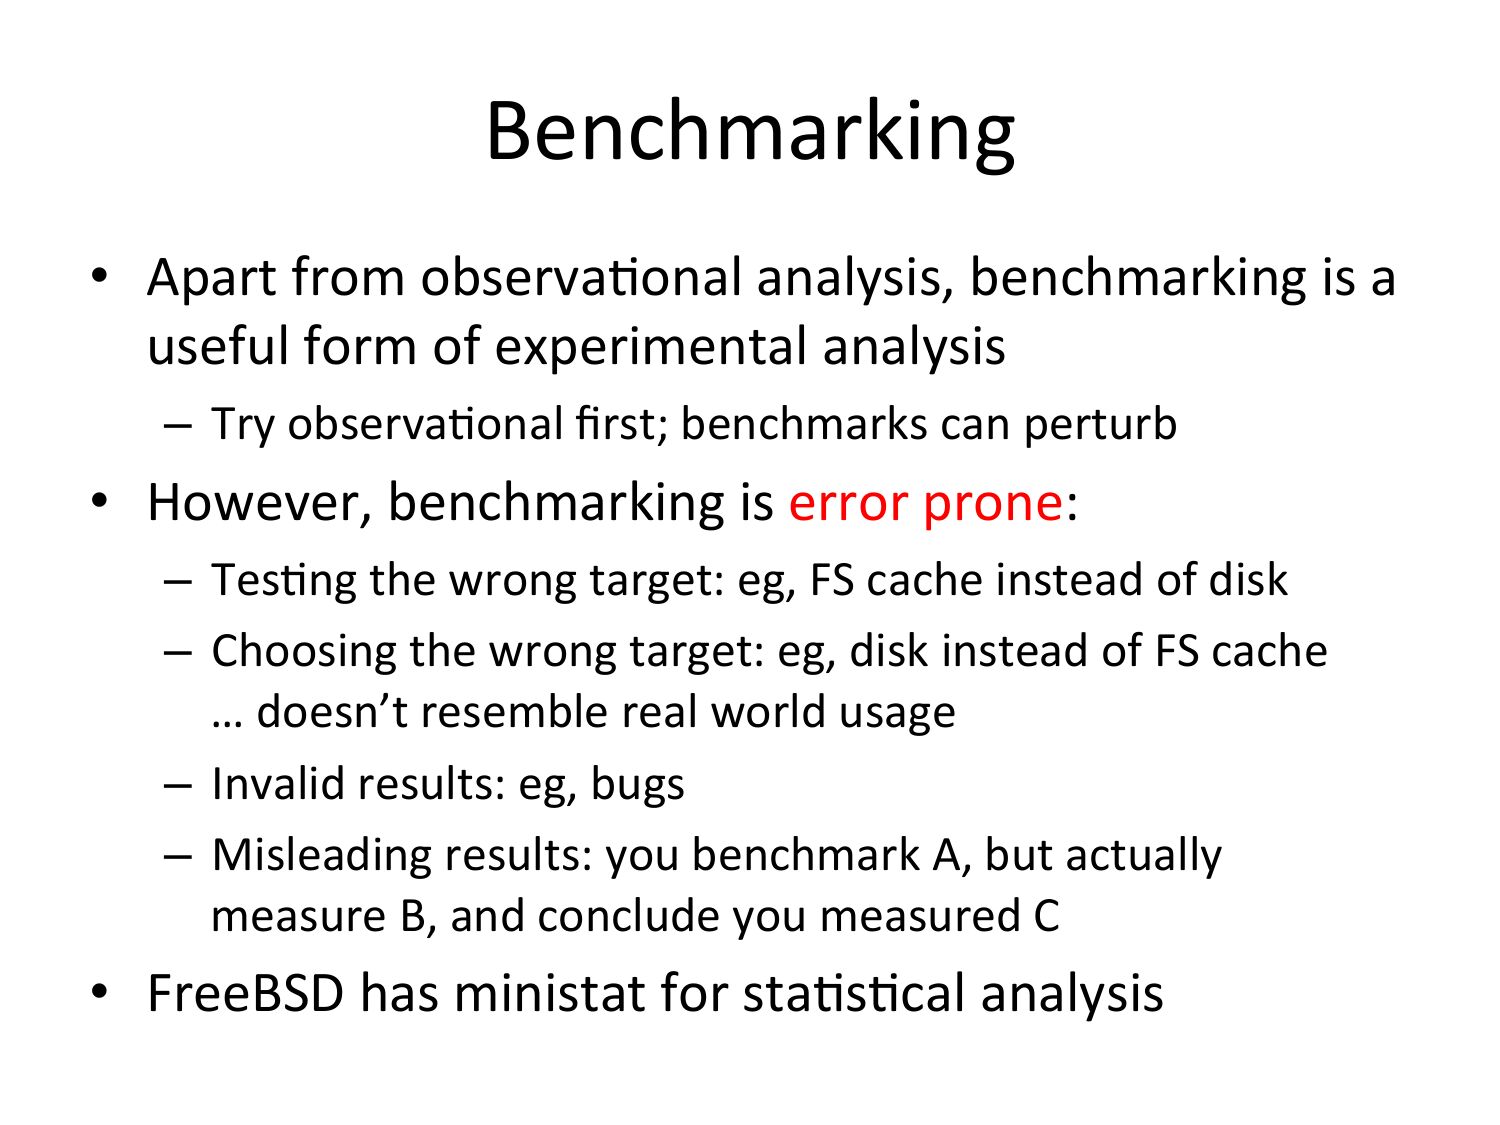
Benchmarking

• Apart
  from
  observaOonal
  analysis,
  benchmarking
  is
  a

useful
  form
  of
  experimental
  analysis

– Try
  observaOonal
  first;
  benchmarks
  can
  perturb

• However,
  benchmarking
  is
  error
  prone:

– TesOng
  the
  wrong
  target:
  eg,
  FS
  cache
  instead
  of
  disk

– Choosing
  the
  wrong
  target:
  eg,
  disk
  instead
  of
  FS
  cache

…
  doesn’t
  resemble
  real
  world
  usage

– Invalid
  results:
  eg,
  bugs

– Misleading
  results:
  you
  benchmark
  A,
  but
  actually

measure
  B,
  and
  conclude
  you
  measured
  C

• FreeBSD
  has
  ministat
  for
  staOsOcal
  analysis
slide 28:
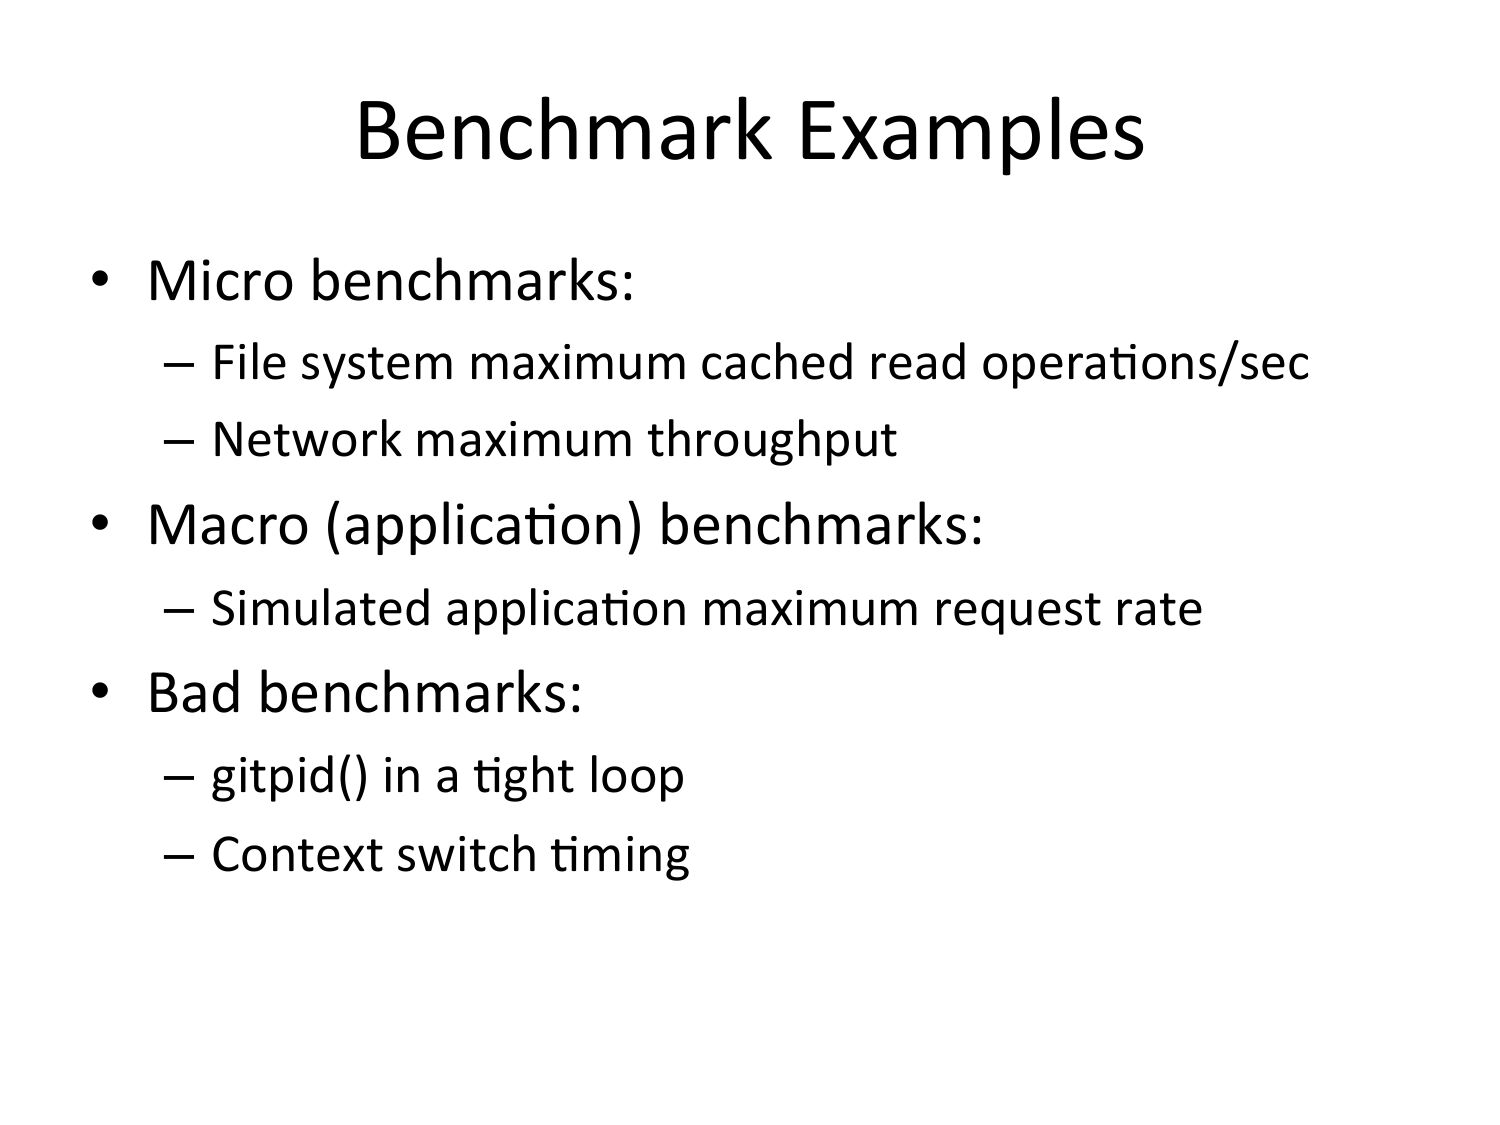
Benchmark
  Examples

• Micro
  benchmarks:

– File
  system
  maximum
  cached
  read
  operaOons/sec

– Network
  maximum
  throughput

• Macro
  (applicaOon)
  benchmarks:

– Simulated
  applicaOon
  maximum
  request
  rate

• Bad
  benchmarks:

– gitpid()
  in
  a
  Oght
  loop

– Context
  switch
  Oming
slide 29:
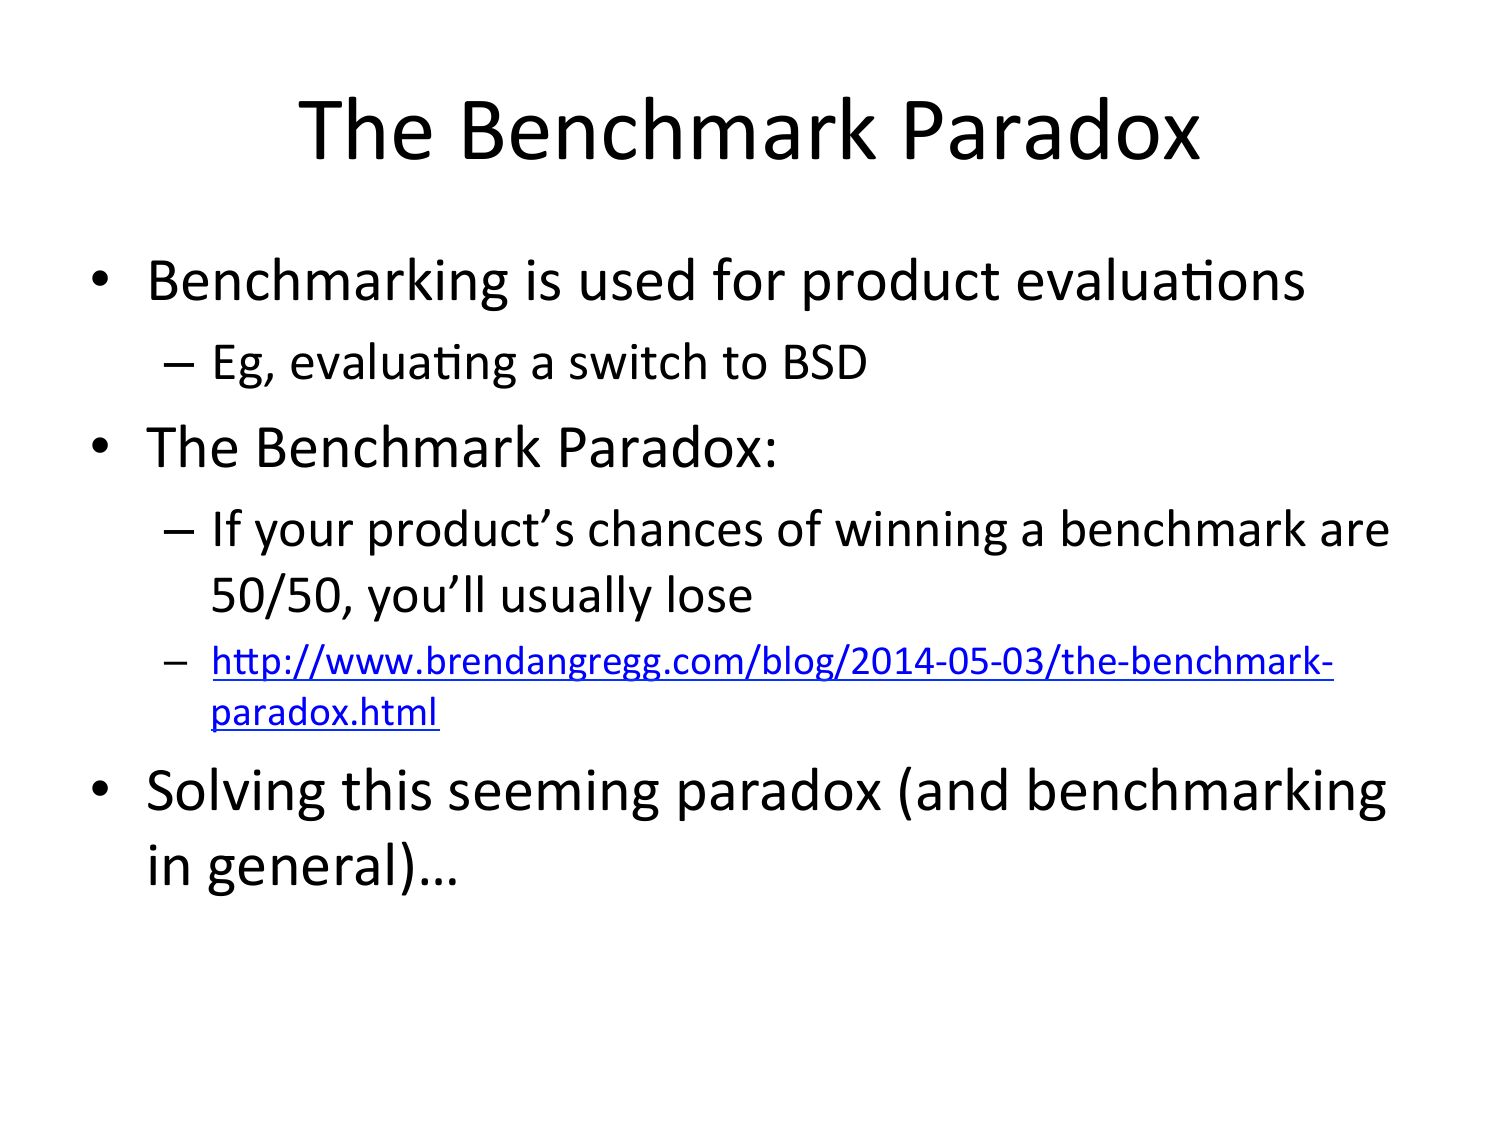
The Benchmark Paradox • Benchmarking is used for product evaluaOons – Eg, evaluaOng a switch to BSD • The Benchmark Paradox: – If your product’s chances of winning a benchmark are 50/50, you’ll usually lose – hpp://www.brendangregg.com/blog/2014-‐05-‐03/the-‐benchmark-‐ paradox.html • Solving this seeming paradox (and benchmarking in general)…slide 30:
For
  any
  given
  benchmark
  result,

ask:

why
  isn’t
  it
  10x?
slide 31:
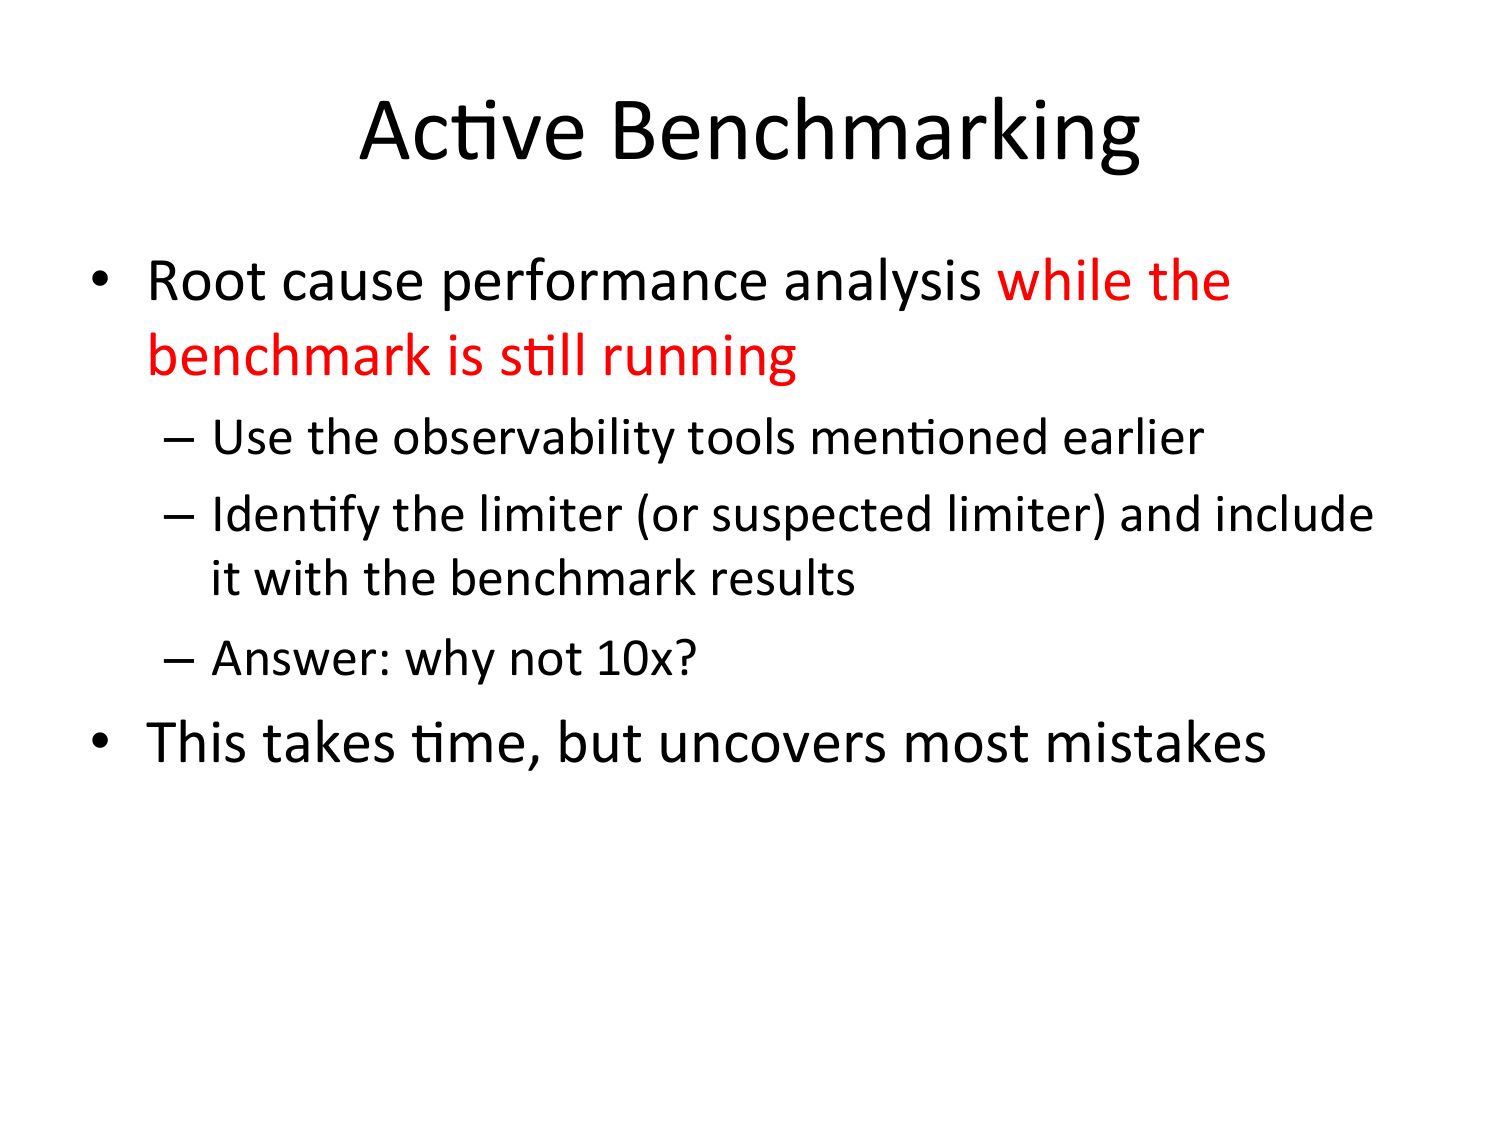
AcOve
  Benchmarking

• Root
  cause
  performance
  analysis
  while
  the

benchmark
  is
  sOll
  running

– Use
  the
  observability
  tools
  menOoned
  earlier

– IdenOfy
  the
  limiter
  (or
  suspected
  limiter)
  and
  include

it
  with
  the
  benchmark
  results

– Answer:
  why
  not
  10x?

• This
  takes
  Ome,
  but
  uncovers
  most
  mistakes
slide 32:
4.
  Profiling
slide 33:
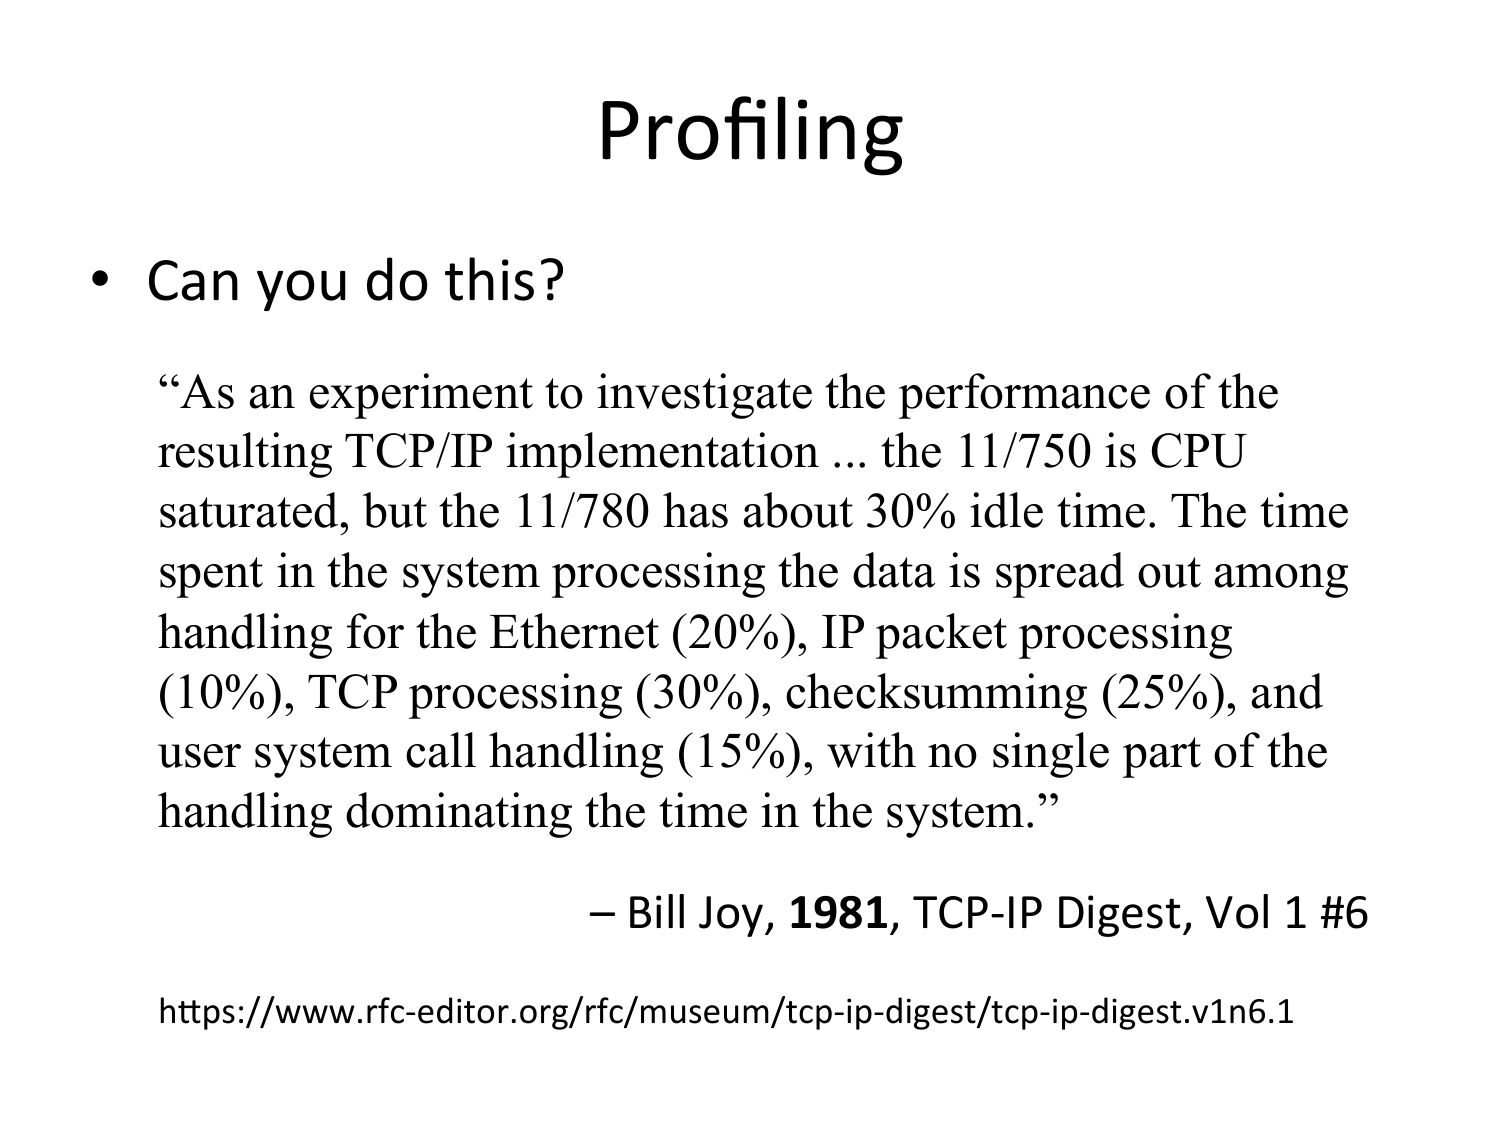
Profiling

• Can
  you
  do
  this?

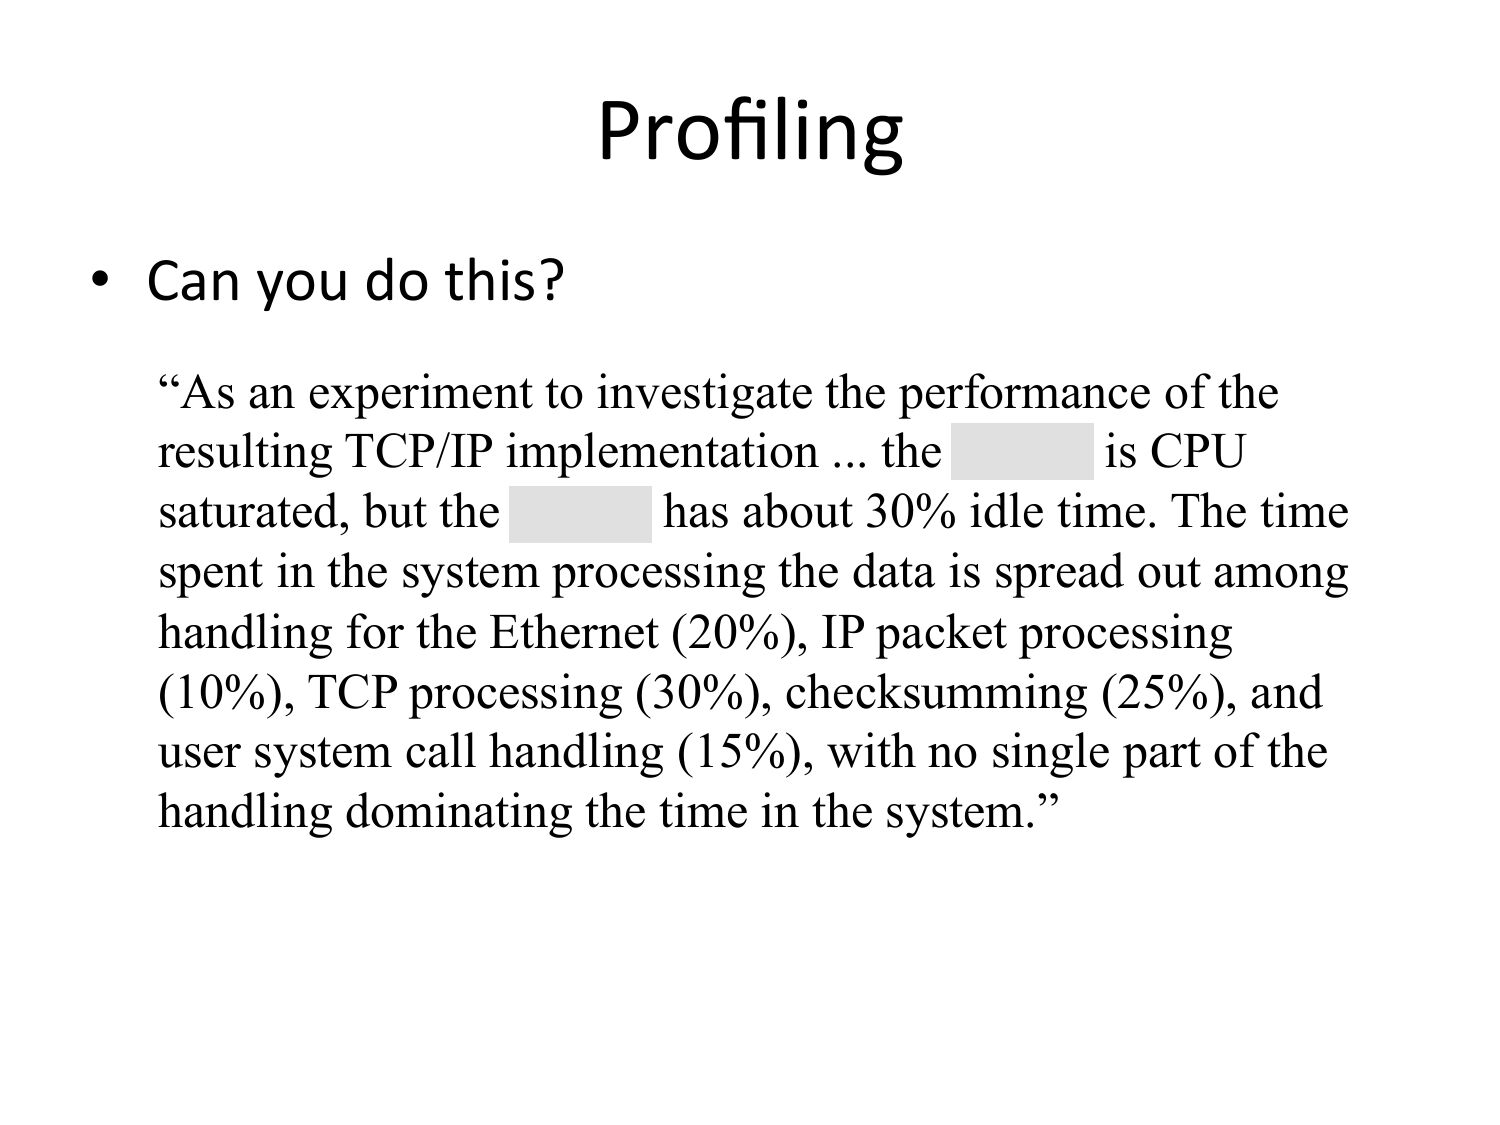
“As an experiment to investigate the performance of the
resulting TCP/IP implementation ... the 11/750 is CPU
saturated, but the 11/780 has about 30% idle time. The time
spent in the system processing the data is spread out among
handling for the Ethernet (20%), IP packet processing
(10%), TCP processing (30%), checksumming (25%), and
user system call handling (15%), with no single part of the
handling dominating the time in the system.”
slide 34:
Profiling • Can you do this? “As an experiment to investigate the performance of the resulting TCP/IP implementation ... the 11/750 is CPU saturated, but the 11/780 has about 30% idle time. The time spent in the system processing the data is spread out among handling for the Ethernet (20%), IP packet processing (10%), TCP processing (30%), checksumming (25%), and user system call handling (15%), with no single part of the handling dominating the time in the system.” – Bill Joy, 1981, TCP-‐IP Digest, Vol 1 #6 hpps://www.rfc-‐editor.org/rfc/museum/tcp-‐ip-‐digest/tcp-‐ip-‐digest.v1n6.1slide 35:
Profiling
  Tools

• pmcstat

• DTrace

• ApplicaOon
  specific
  products
slide 36:
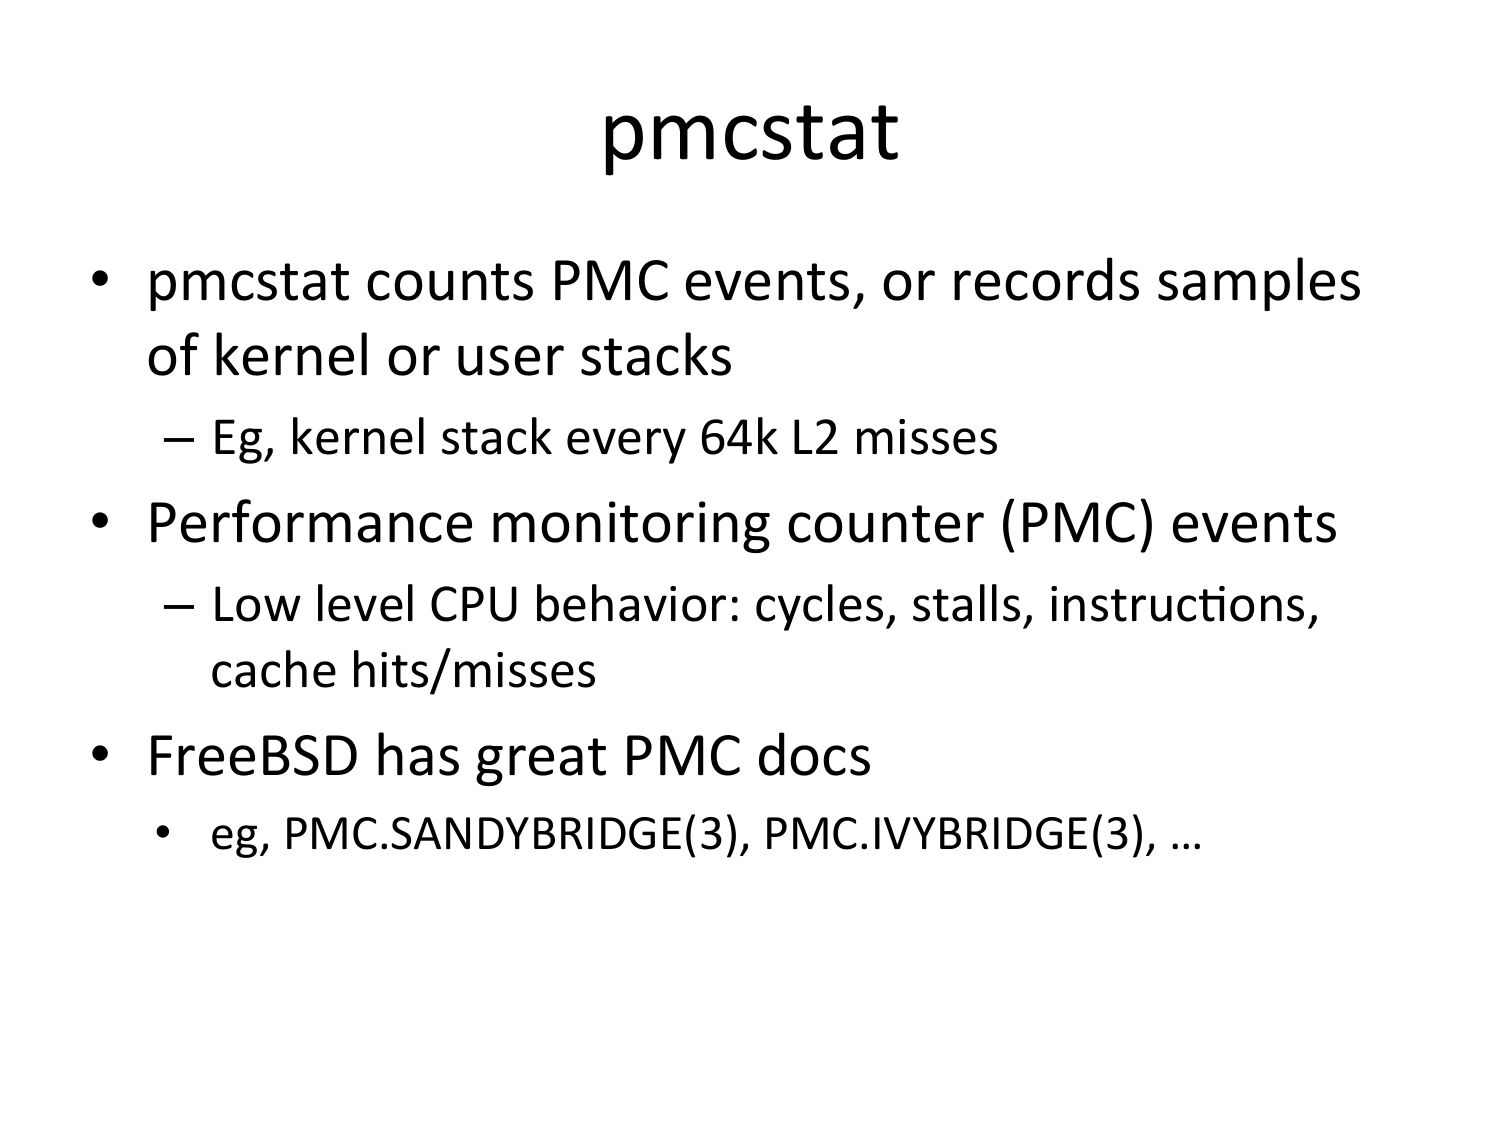
pmcstat

• pmcstat
  counts
  PMC
  events,
  or
  records
  samples

of
  kernel
  or
  user
  stacks

– Eg,
  kernel
  stack
  every
  64k
  L2
  misses

• Performance
  monitoring
  counter
  (PMC)
  events

– Low
  level
  CPU
  behavior:
  cycles,
  stalls,
  instrucOons,

cache
  hits/misses

• FreeBSD
  has
  great
  PMC
  docs

• eg,
  PMC.SANDYBRIDGE(3),
  PMC.IVYBRIDGE(3),
  …
slide 37:
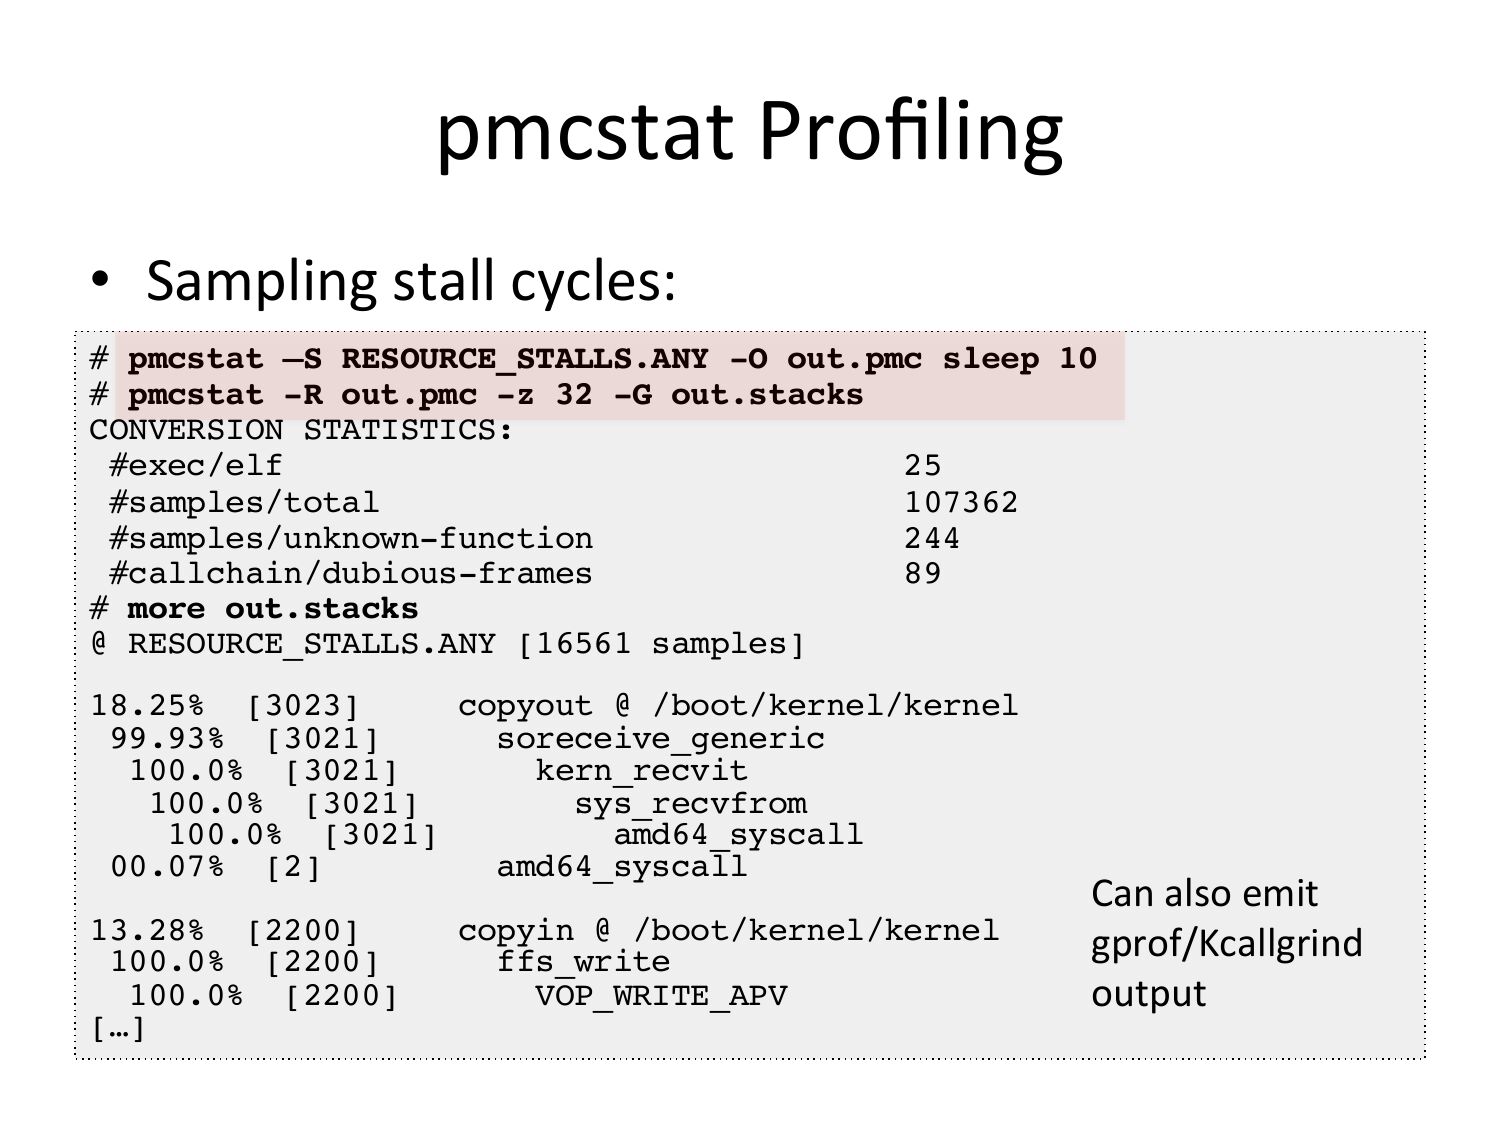
pmcstat
  Profiling

• Sampling
  stall
  cycles:

# pmcstat –S RESOURCE_STALLS.ANY -O out.pmc sleep 10!
# pmcstat -R out.pmc -z 32 -G out.stacks!
CONVERSION STATISTICS:!
#exec/elf
25!
#samples/total
107362!
#samples/unknown-function
244!
#callchain/dubious-frames
89!
# more out.stacks!
@ RESOURCE_STALLS.ANY [16561 samples]!
18.25% [3023]
copyout @ /boot/kernel/kernel!
99.93% [3021]
soreceive_generic!
100.0% [3021]
kern_recvit!
100.0% [3021]
sys_recvfrom!
100.0% [3021]
amd64_syscall!
00.07% [2]
amd64_syscall!
Can
  also
  emit

13.28% [2200]
copyin @ /boot/kernel/kernel!
gprof/Kcallgrind

100.0% [2200]
ffs_write!
100.0% [2200]
VOP_WRITE_APV!
output

[…]!
slide 38:
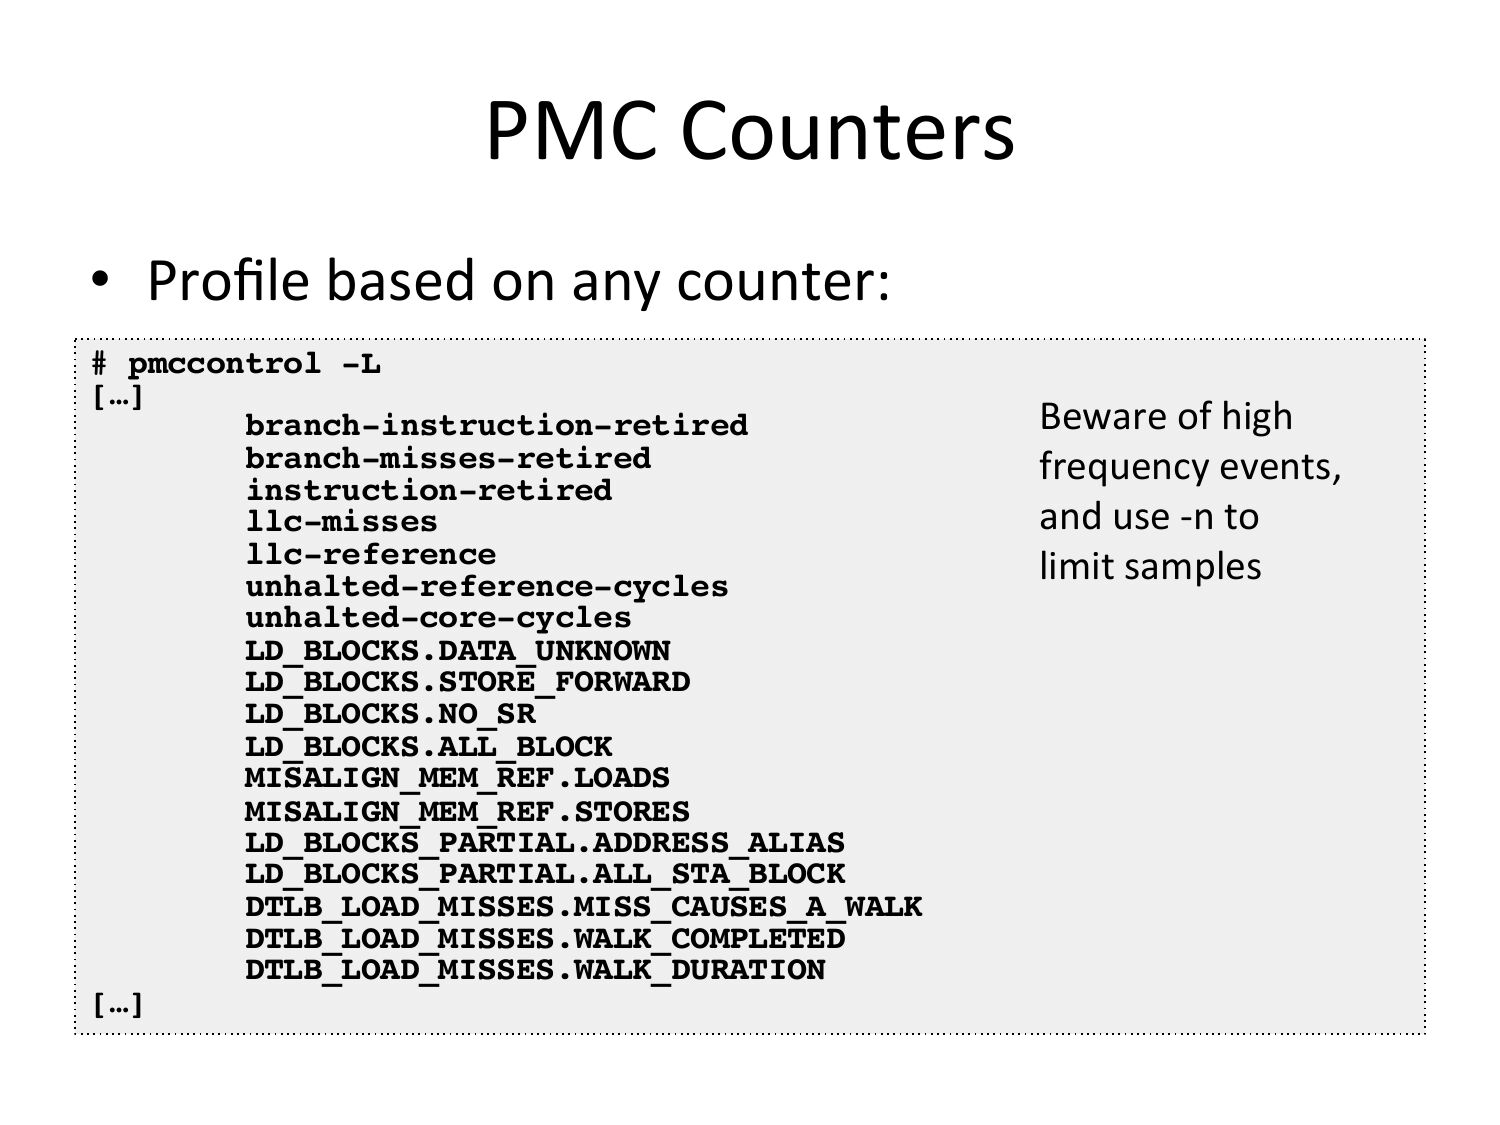
PMC Counters • Profile based on any counter: # pmccontrol -L! […]! branch-instruction-retired! branch-misses-retired! instruction-retired! llc-misses! llc-reference! unhalted-reference-cycles! unhalted-core-cycles! LD_BLOCKS.DATA_UNKNOWN! LD_BLOCKS.STORE_FORWARD! LD_BLOCKS.NO_SR! LD_BLOCKS.ALL_BLOCK! MISALIGN_MEM_REF.LOADS! MISALIGN_MEM_REF.STORES! LD_BLOCKS_PARTIAL.ADDRESS_ALIAS! LD_BLOCKS_PARTIAL.ALL_STA_BLOCK! DTLB_LOAD_MISSES.MISS_CAUSES_A_WALK! DTLB_LOAD_MISSES.WALK_COMPLETED! DTLB_LOAD_MISSES.WALK_DURATION! […]! Beware of high frequency events, and use -‐n to limit samplesslide 39:
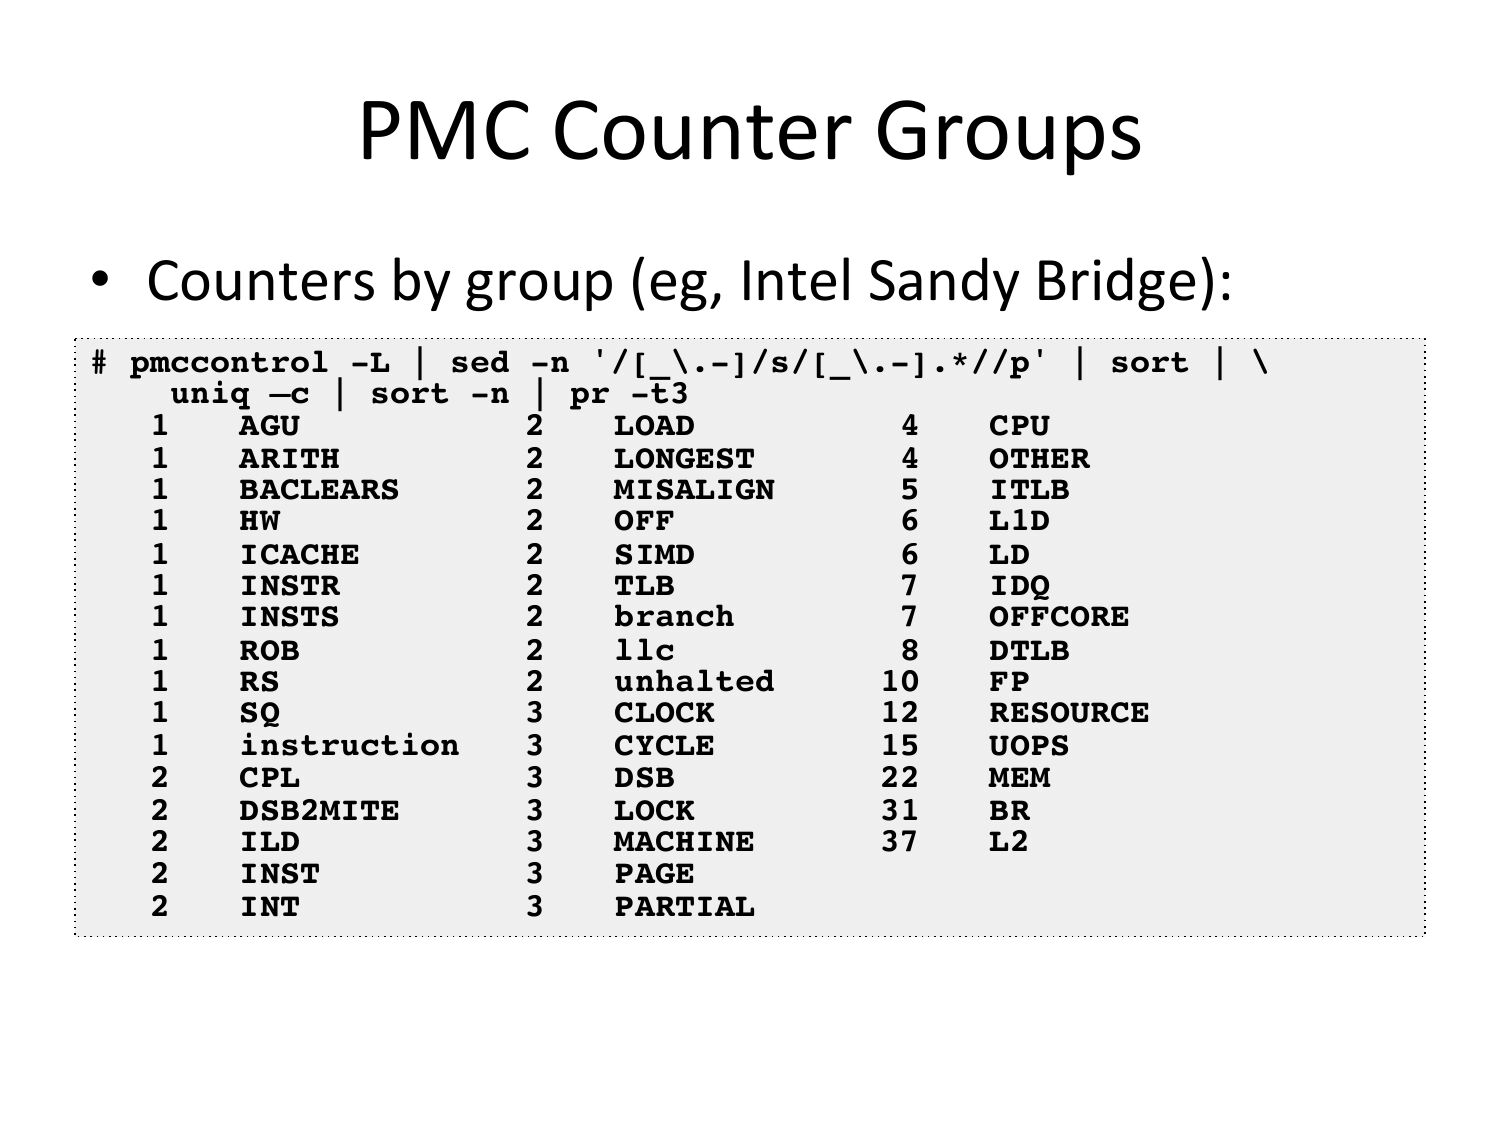
PMC
  Counter
  Groups

• Counters
  by
  group
  (eg,
  Intel
  Sandy
  Bridge):

# pmccontrol -L | sed -n '/[_\.-]/s/[_\.-].*//p' | sort | \!
uniq –c | sort -n | pr -t3!
1 !AGU!
2 !LOAD !
4 !CPU!
1 !ARITH !
2 !LONGEST!
4 !OTHER!
1 !BACLEARS !
2 !MISALIGN !
5 !ITLB!
1 !HW !
2 !OFF!
6 !L1D!
1 !ICACHE !
2 !SIMD !
6 !LD!
1 !INSTR !
2 !TLB!
7 !IDQ!
1 !INSTS !
2 !branch !
7 !OFFCORE!
1 !ROB!
2 !llc!
8 !DTLB!
1 !RS !
2 !unhalted ! 10 !FP!
1 !SQ !
3 !CLOCK !
! 12 !RESOURCE!
1 !instruction!
3 !CYCLE !
! 15 !UOPS!
2 !CPL!
3 !DSB!
! 22 !MEM!
2 !DSB2MITE !
3 !LOCK !
! 31 !BR!
2 !ILD!
3 !MACHINE!
! 37 !L2!
2 !INST !
3 !PAGE!
2 !INT!
3 !PARTIAL!
slide 40:
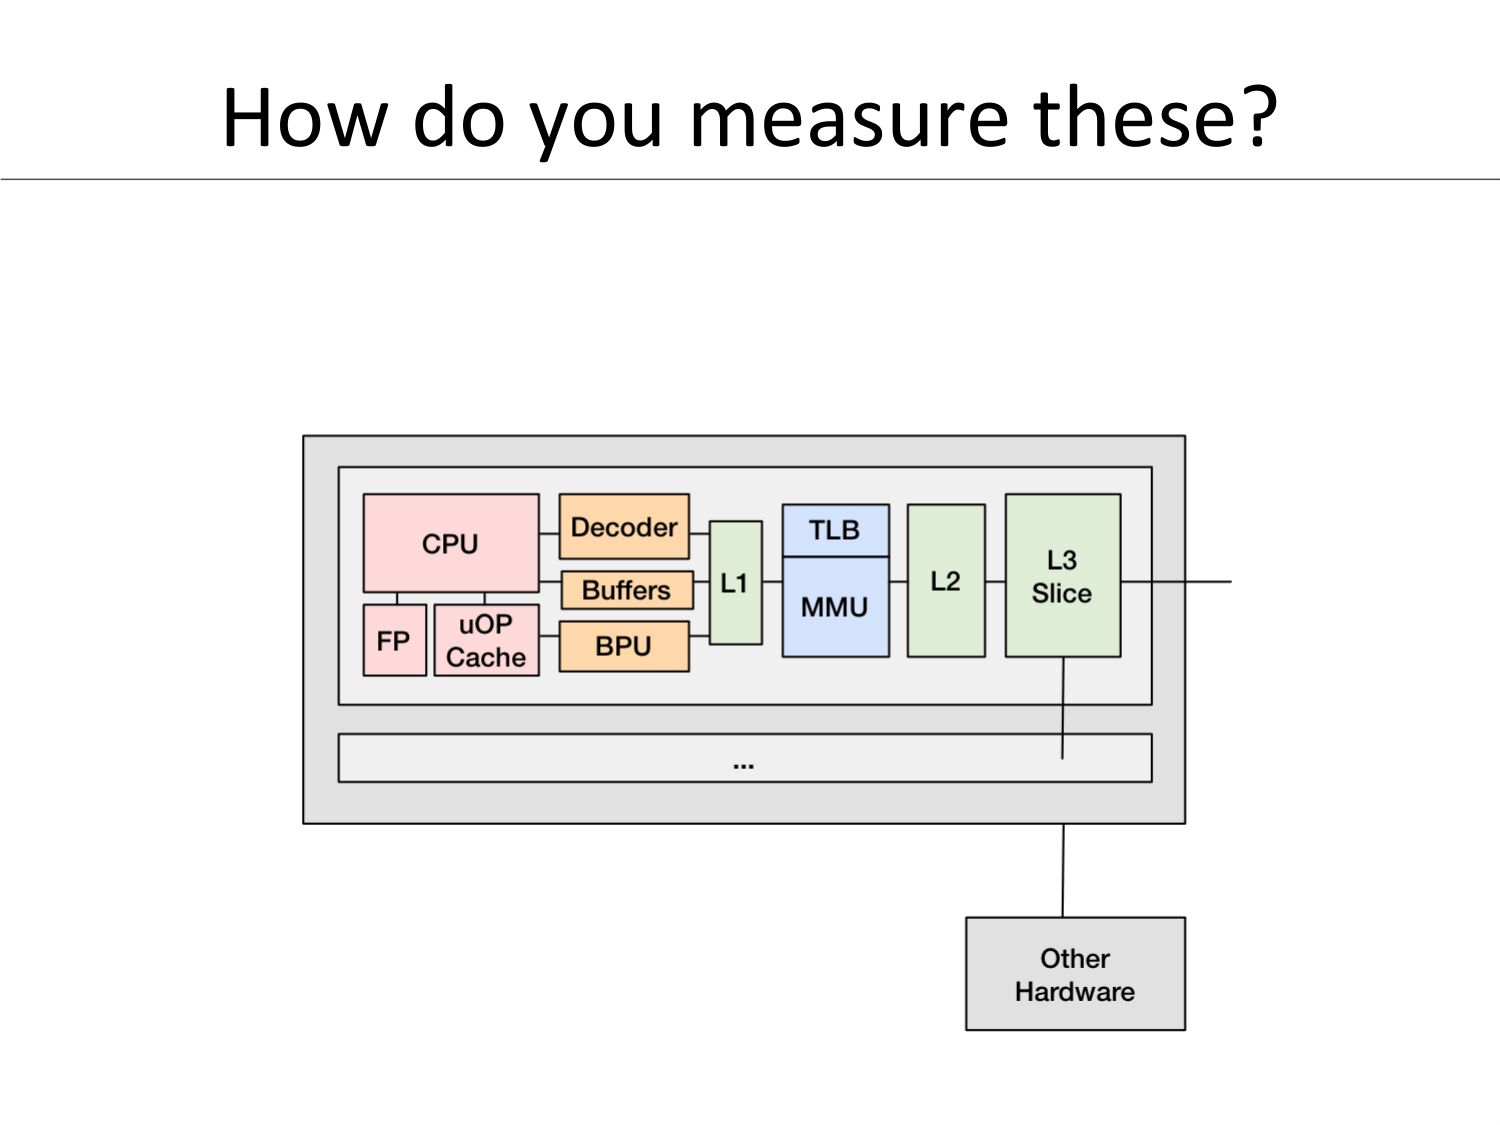
How
  do
  you
  measure
  these?
slide 41:
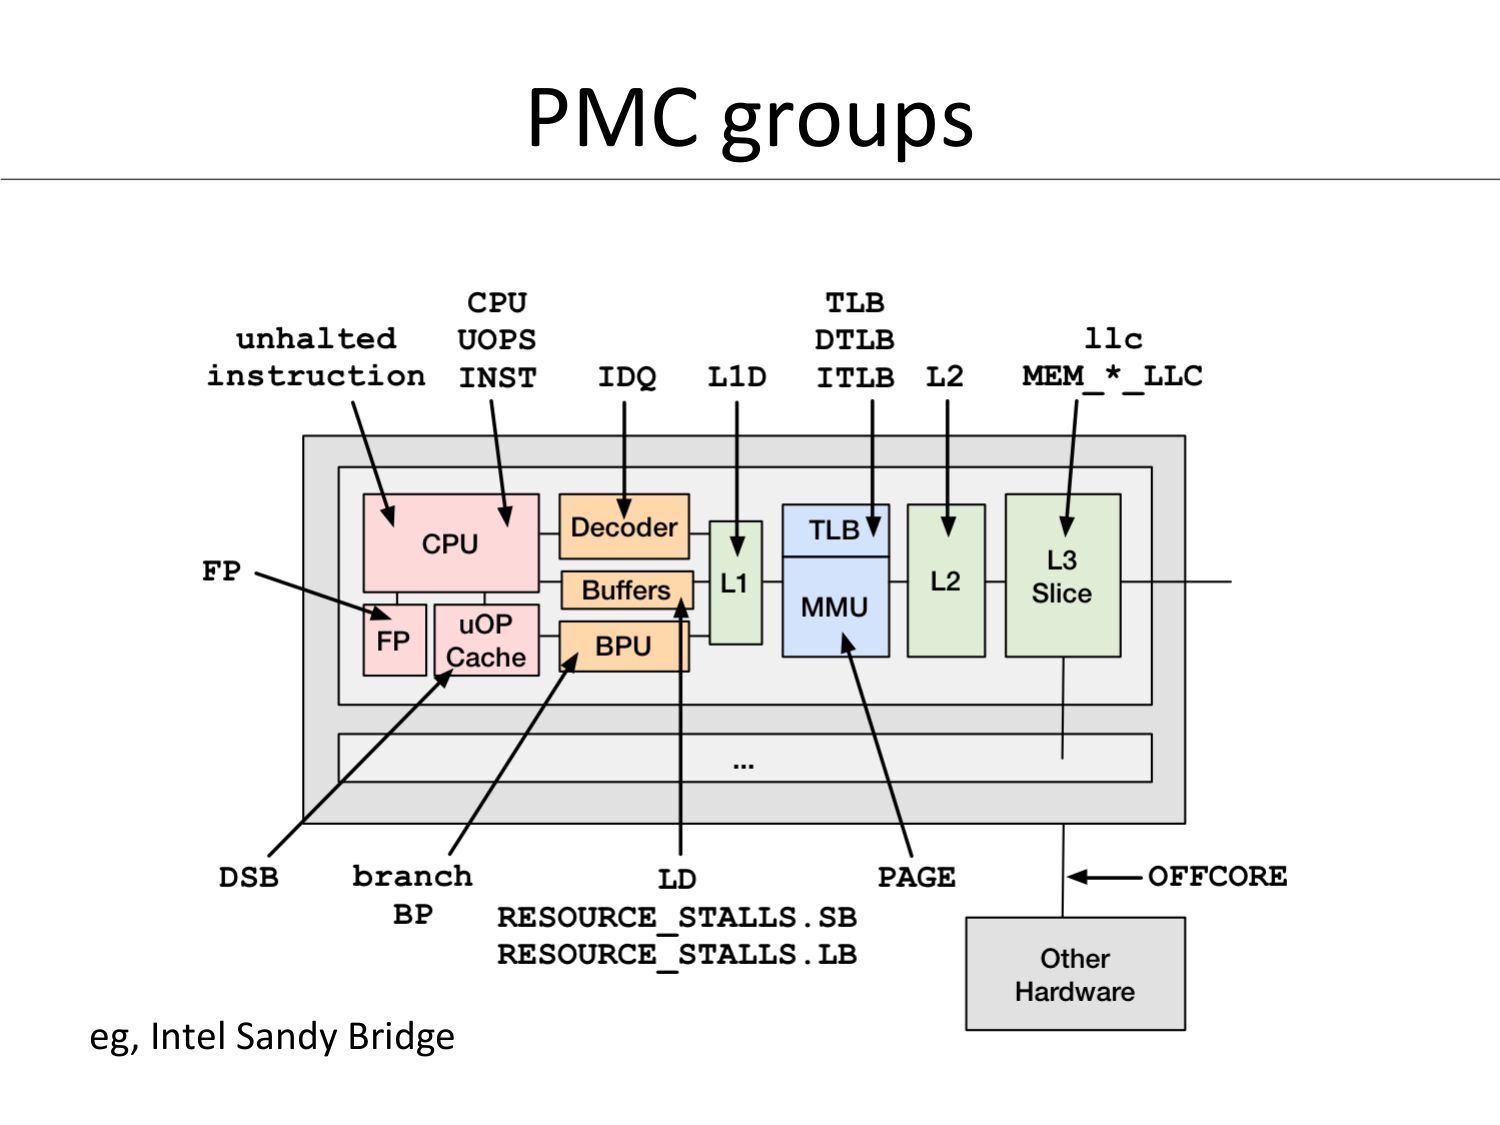
PMC
  groups

eg,
  Intel
  Sandy
  Bridge
slide 42:
DTrace
Profiling
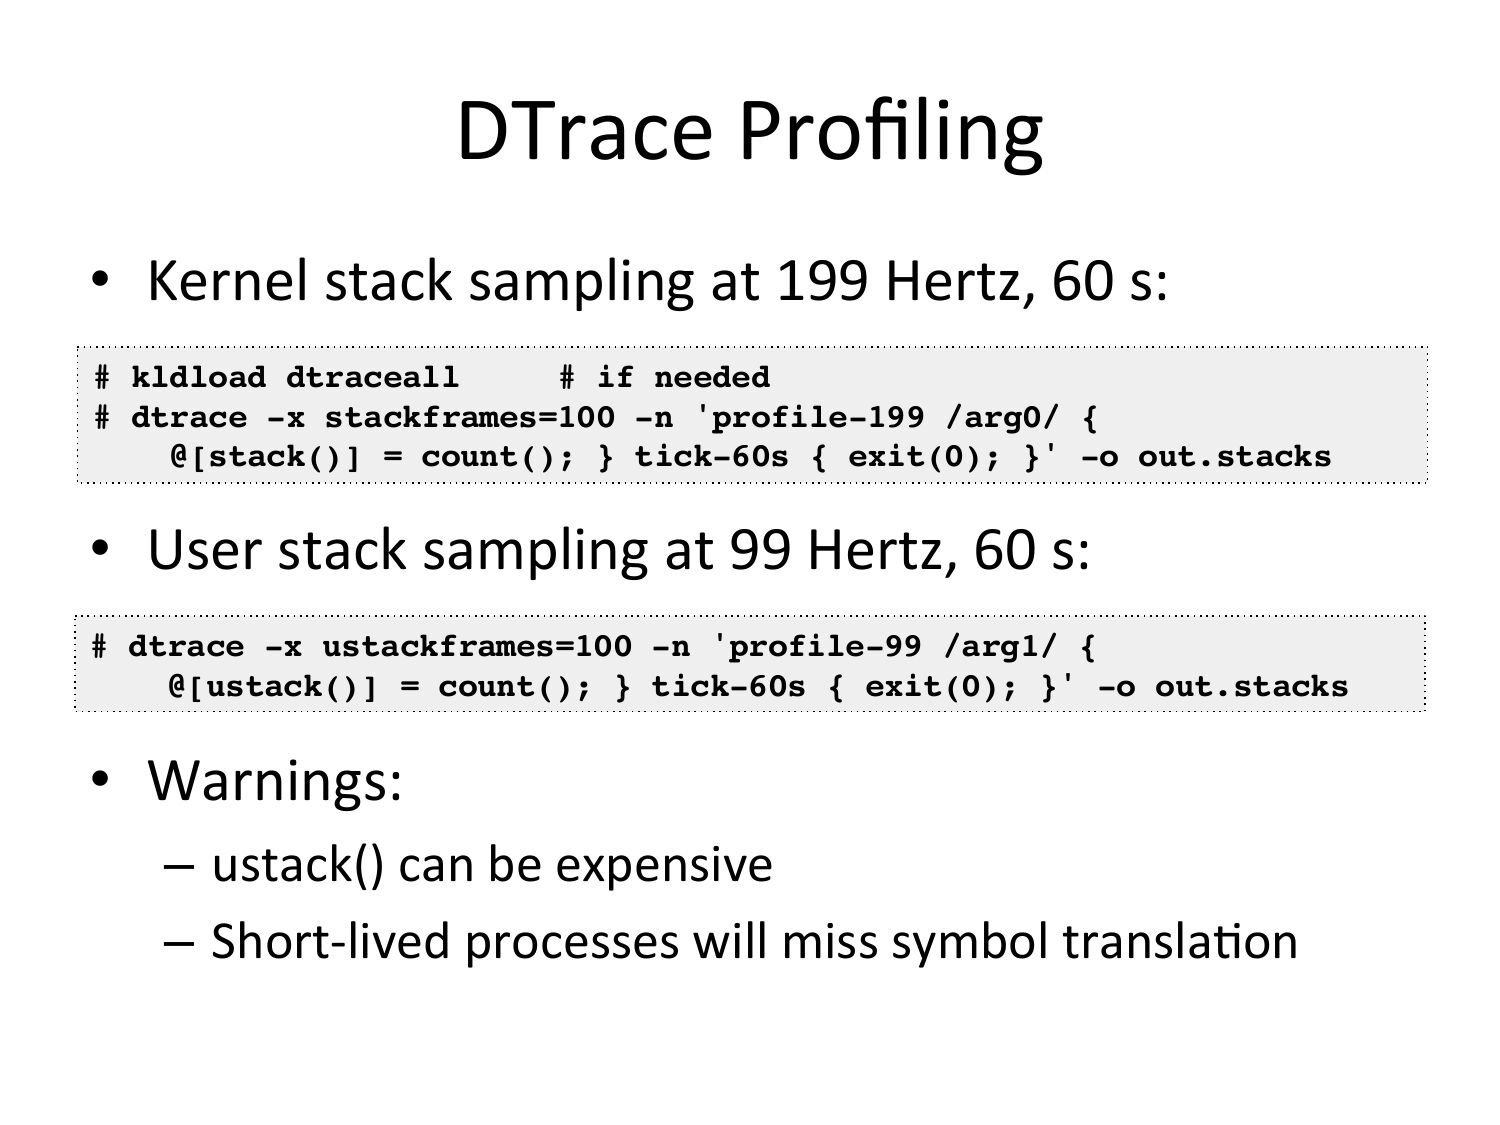
• Kernel
stack
sampling
at
199
Hertz,
60
s:
# kldload dtraceall
# if needed!
# dtrace -x stackframes=100 -n 'profile-199 /arg0/ {!
@[stack()] = count(); } tick-60s { exit(0); }' -o out.stacks!
• User
stack
sampling
at
99
Hertz,
60
s:
# dtrace -x ustackframes=100 -n 'profile-99 /arg1/ {!
@[ustack()] = count(); } tick-60s { exit(0); }' -o out.stacks!
• Warnings:
– ustack()
can
be
expensive
– Short-‐lived
processes
will
miss
symbol
translaOon
slide 43:DEMOslide 44:
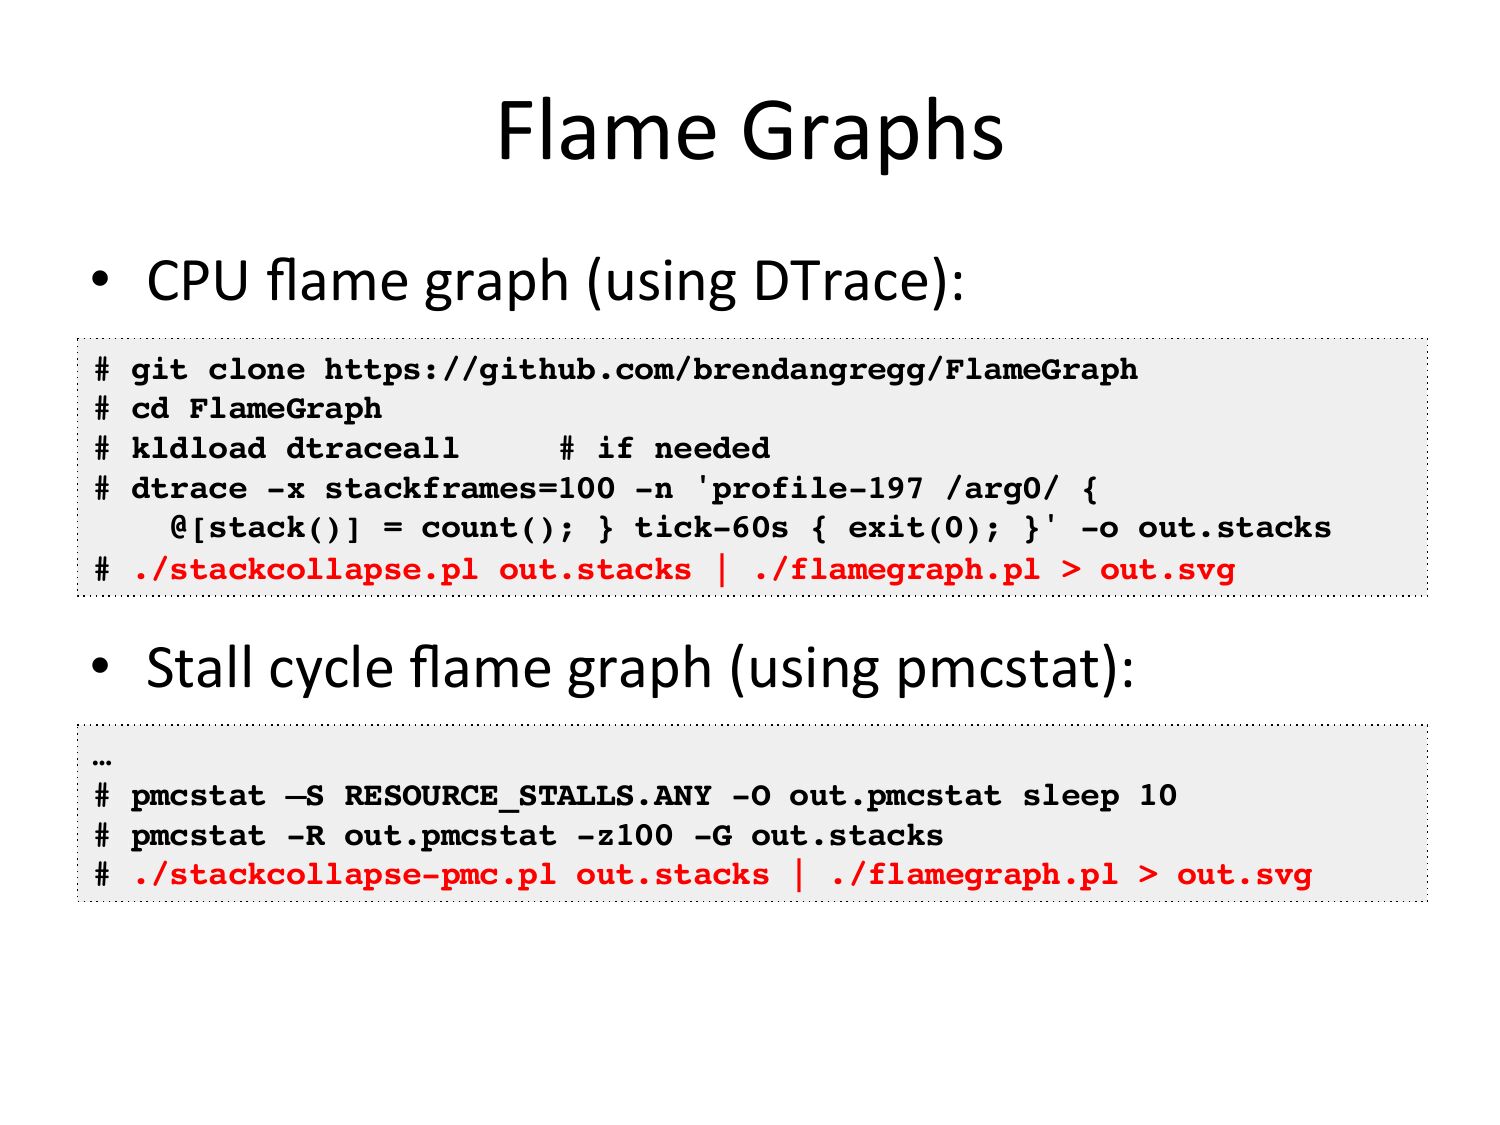
Flame
  Graphs

• CPU
  flame
  graph
  (using
  DTrace):

git clone https://github.com/brendangregg/FlameGraph!

  ## cd
FlameGraph!
# kldload dtraceall
# if needed!
# dtrace -x stackframes=100 -n 'profile-197 /arg0/ {!
@[stack()] = count(); } tick-60s { exit(0); }' -o out.stacks!
# ./stackcollapse.pl out.stacks | ./flamegraph.pl >gt; out.svg!


• Stall
  cycle
  flame
  graph
  (using
  pmcstat):

… !
# pmcstat –S RESOURCE_STALLS.ANY -O out.pmcstat sleep 10!
# pmcstat -R out.pmcstat -z100 -G out.stacks!
# ./stackcollapse-pmc.pl out.stacks | ./flamegraph.pl >gt; out.svg!
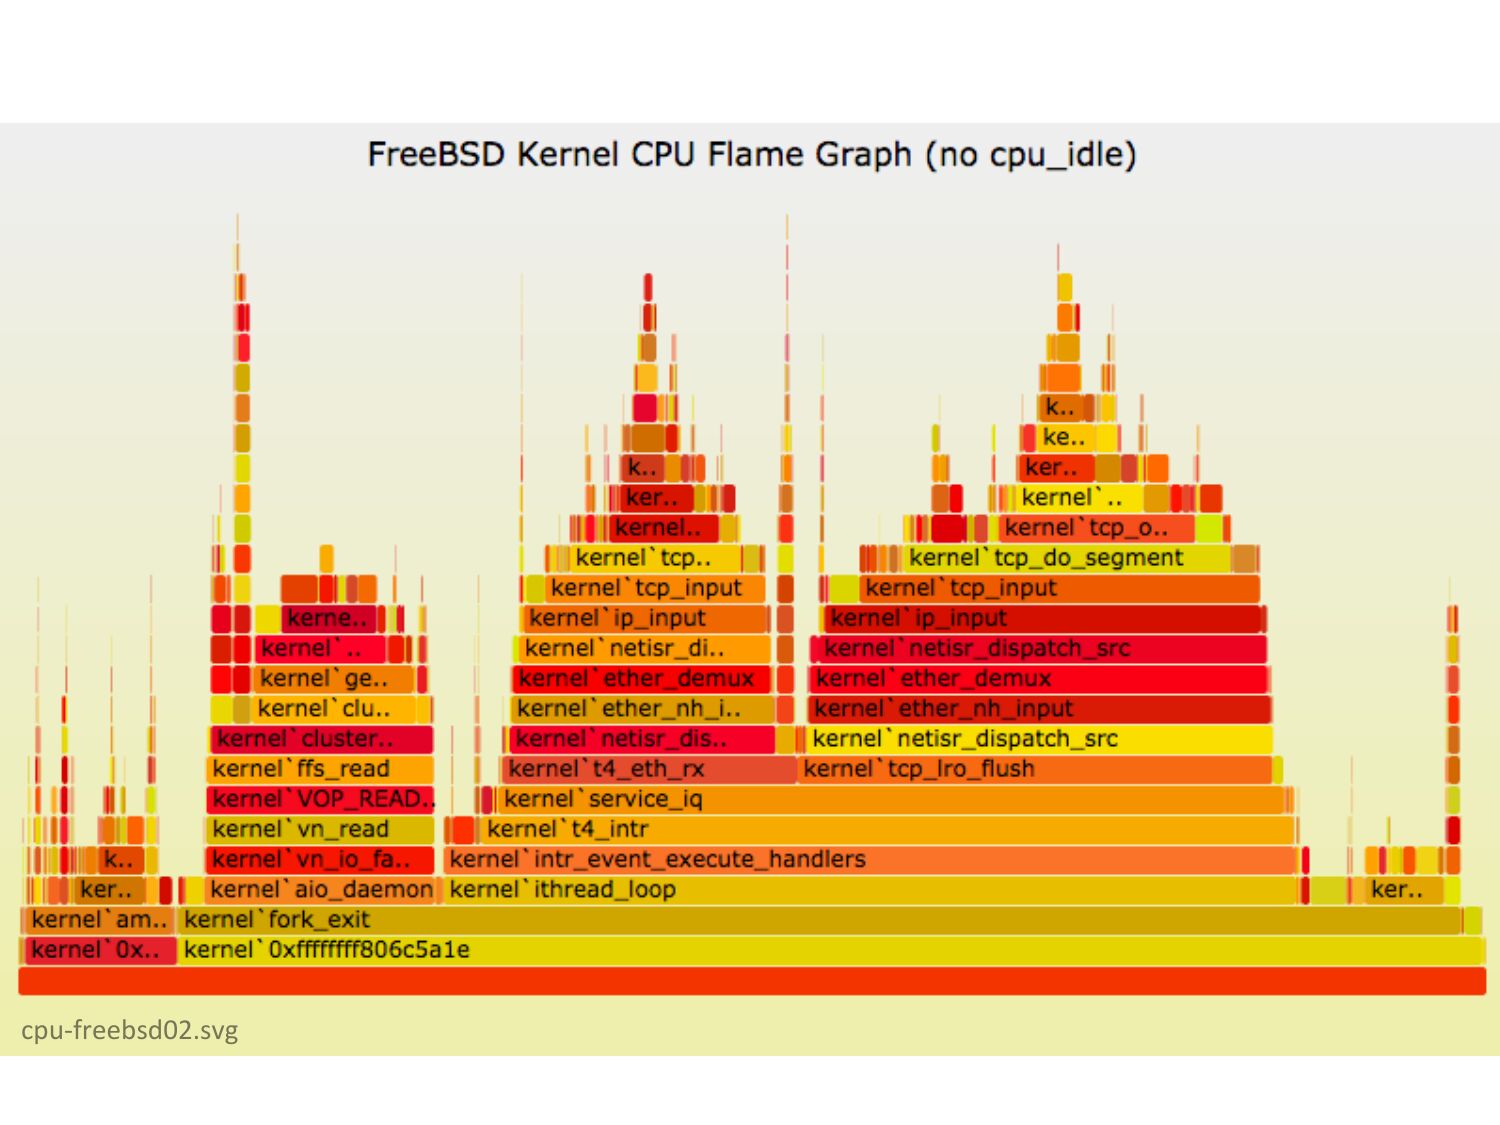
slide 45:cpu-‐freebsd02.svgslide 46:
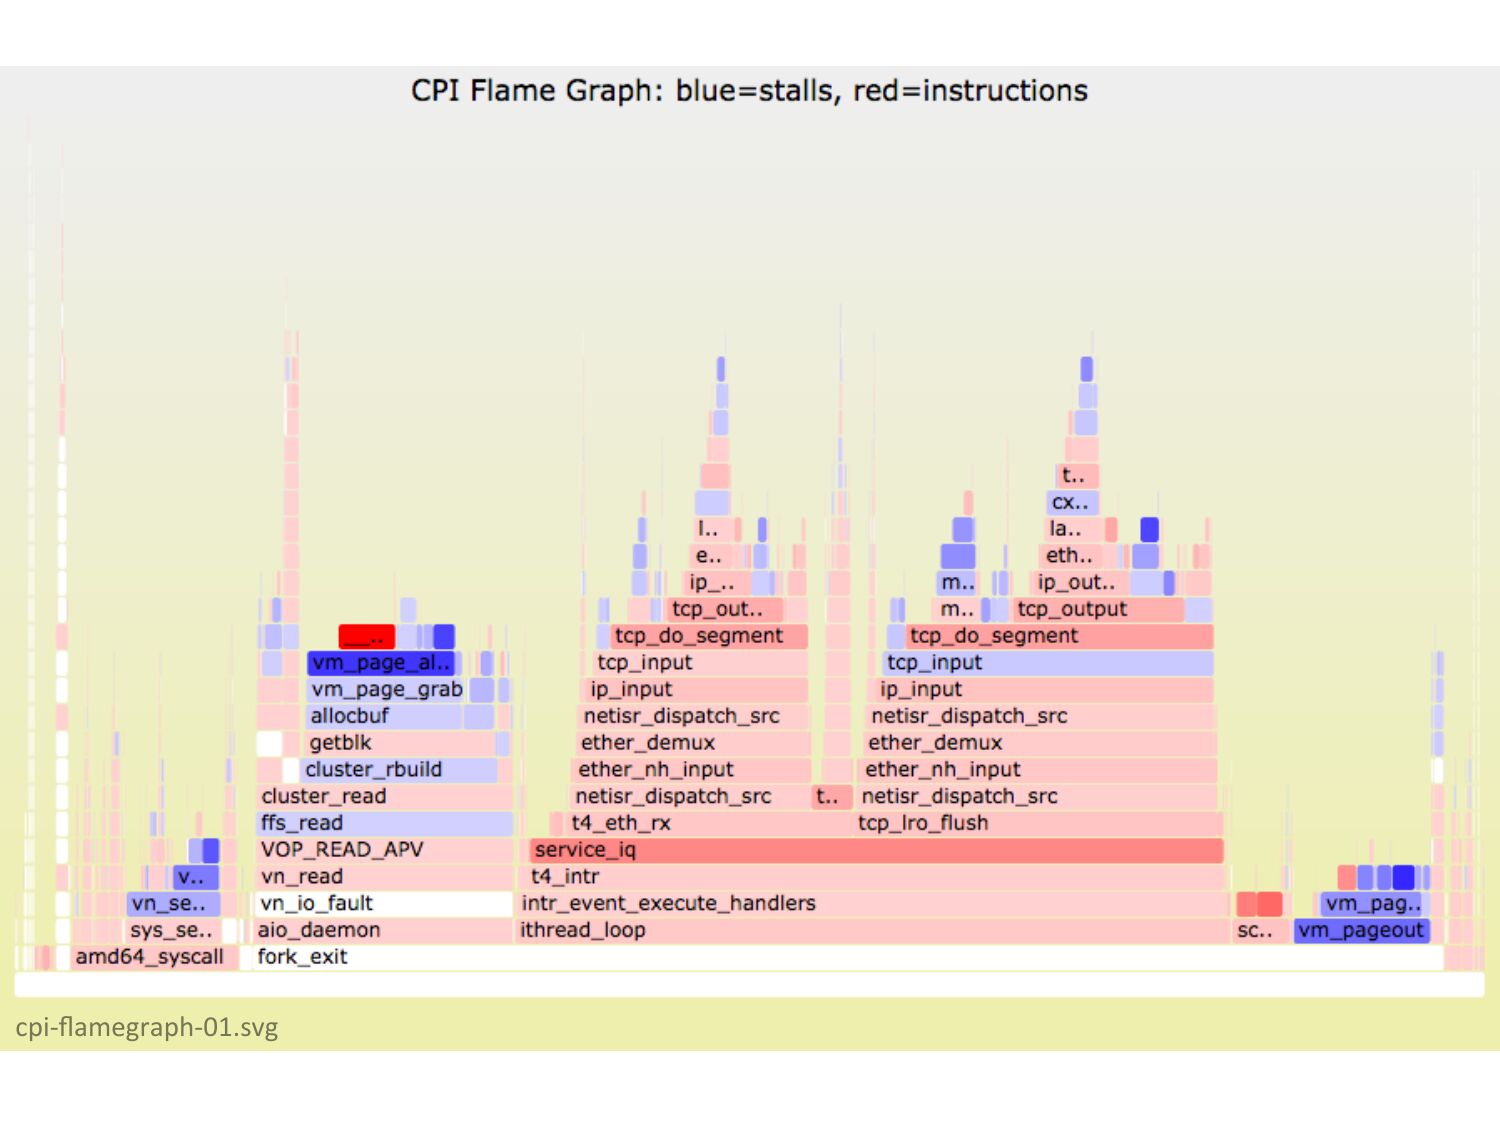
cpi-‐flamegraph-‐01.svgslide 47:
5.
  Tracing
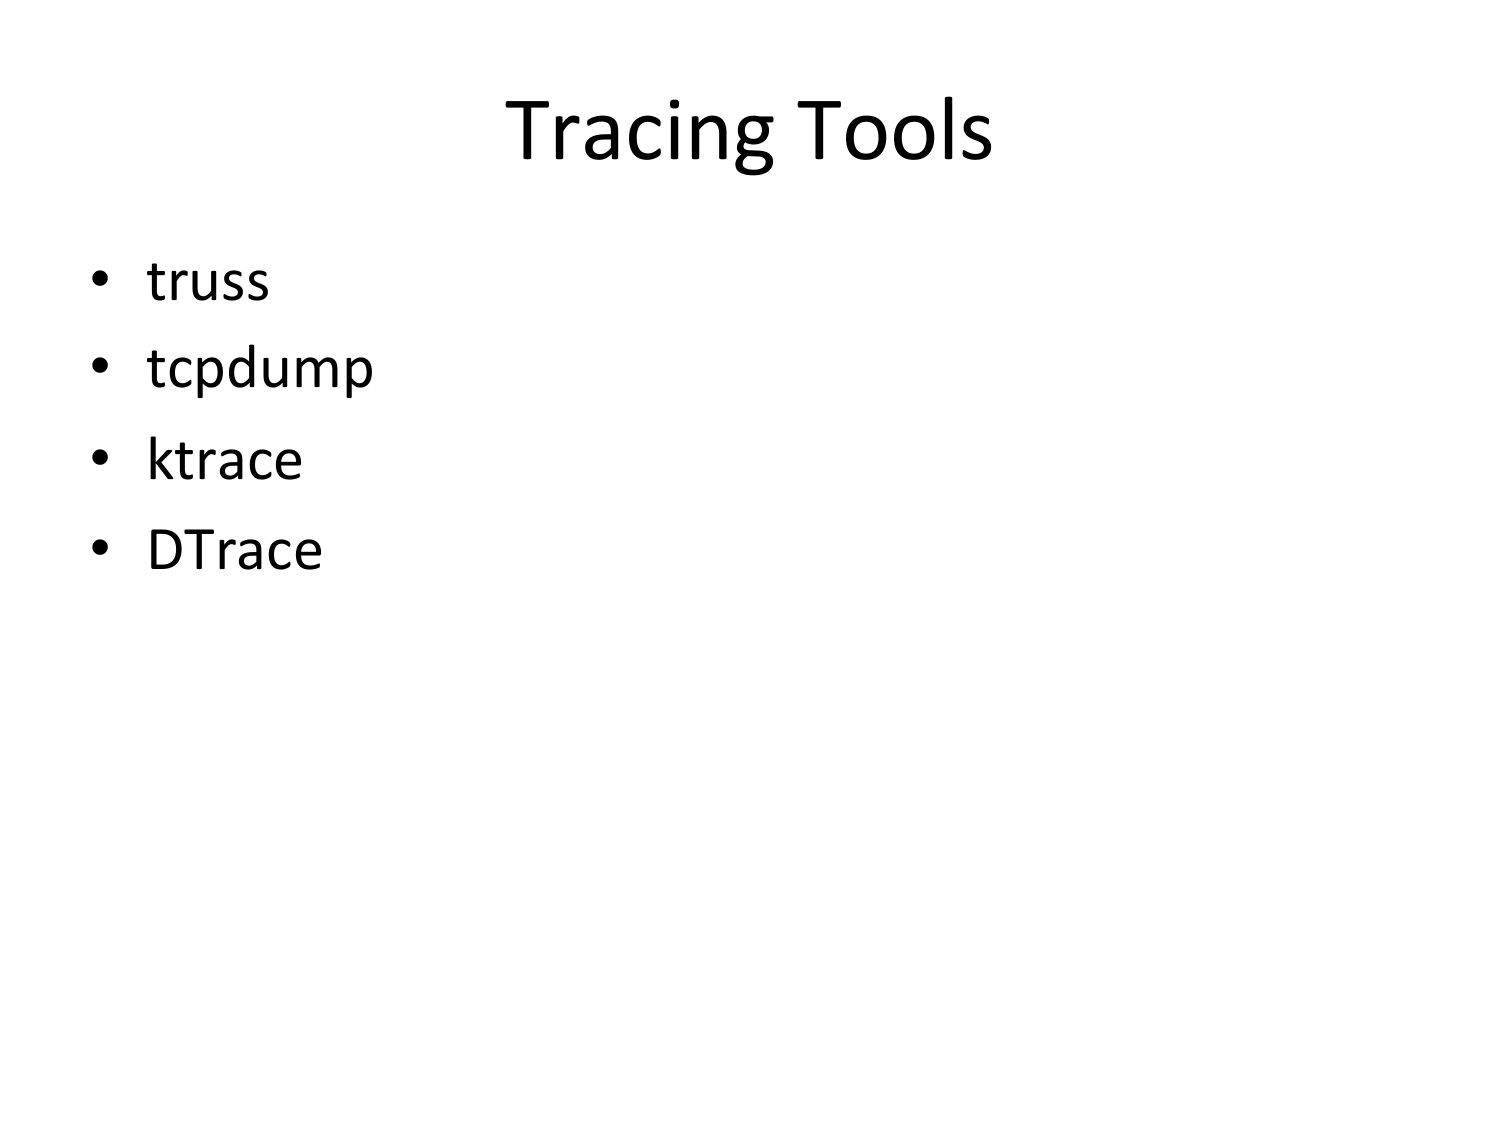
slide 48:
Tracing
  Tools

• truss

• tcpdump

• ktrace

• DTrace
slide 49:
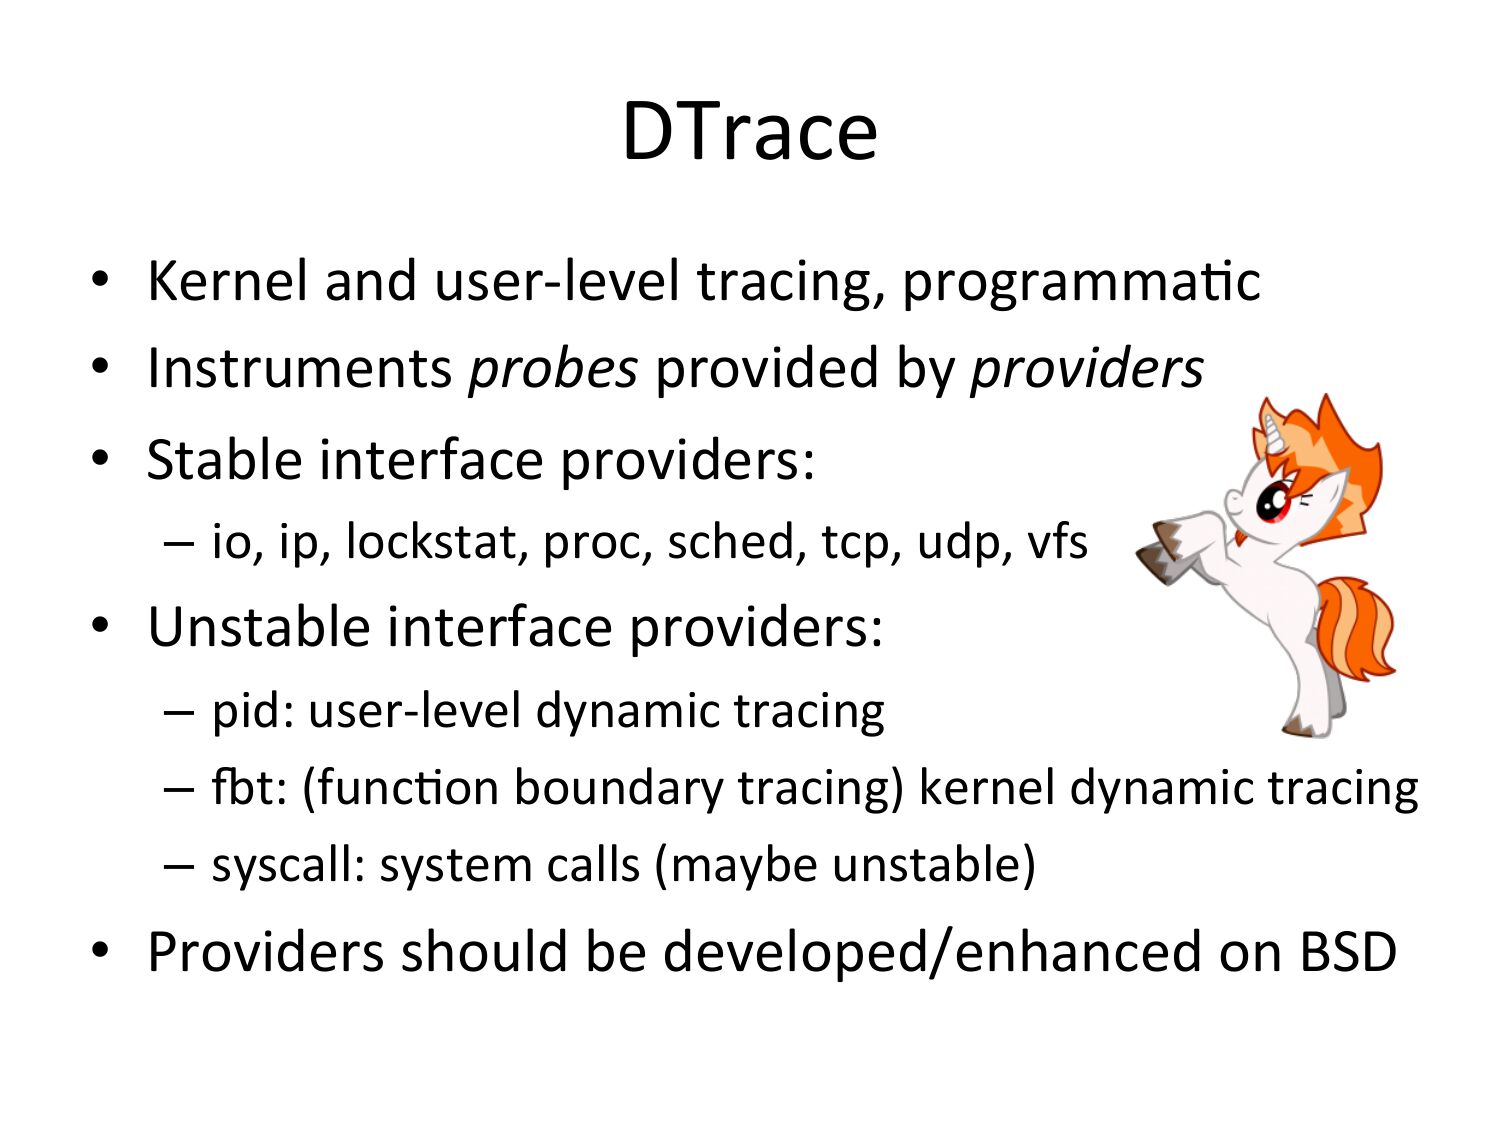
DTrace • Kernel and user-‐level tracing, programmaOc • Instruments probes provided by providers • Stable interface providers: – io, ip, lockstat, proc, sched, tcp, udp, vfs • Unstable interface providers: – pid: user-‐level dynamic tracing – zt: (funcOon boundary tracing) kernel dynamic tracing – syscall: system calls (maybe unstable) • Providers should be developed/enhanced on BSDslide 50:
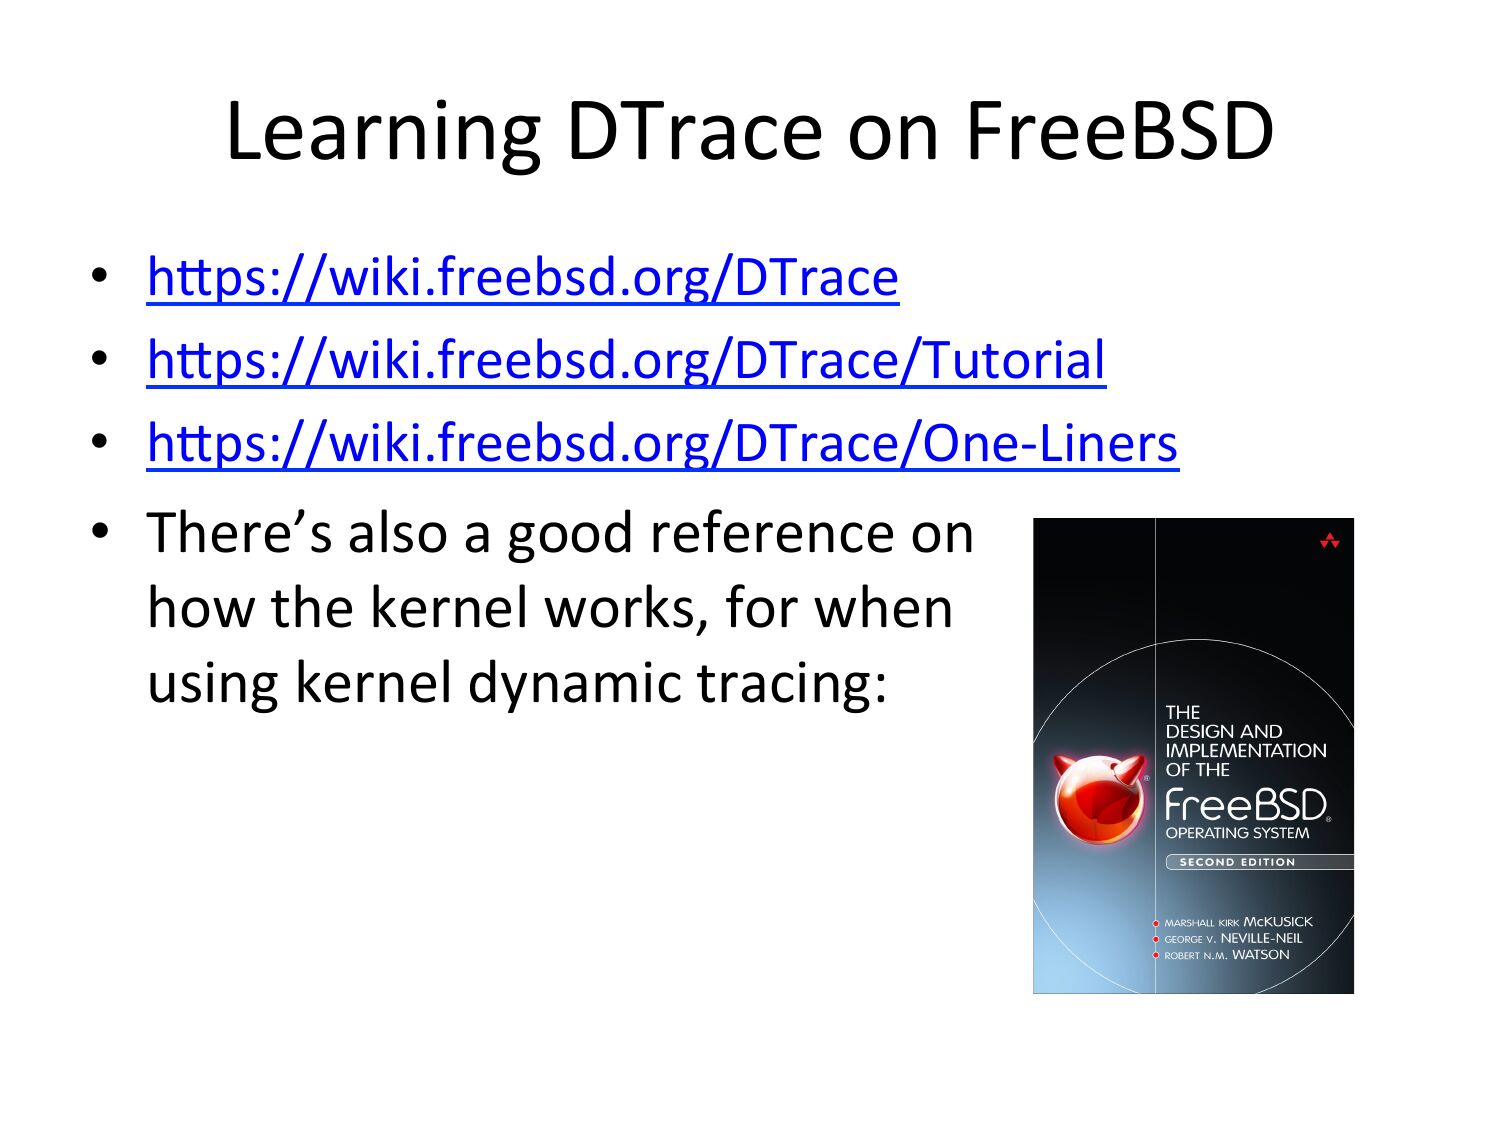
Learning DTrace on FreeBSD • hpps://wiki.freebsd.org/DTrace • hpps://wiki.freebsd.org/DTrace/Tutorial • hpps://wiki.freebsd.org/DTrace/One-‐Liners • There’s also a good reference on how the kernel works, for when using kernel dynamic tracing:slide 51:
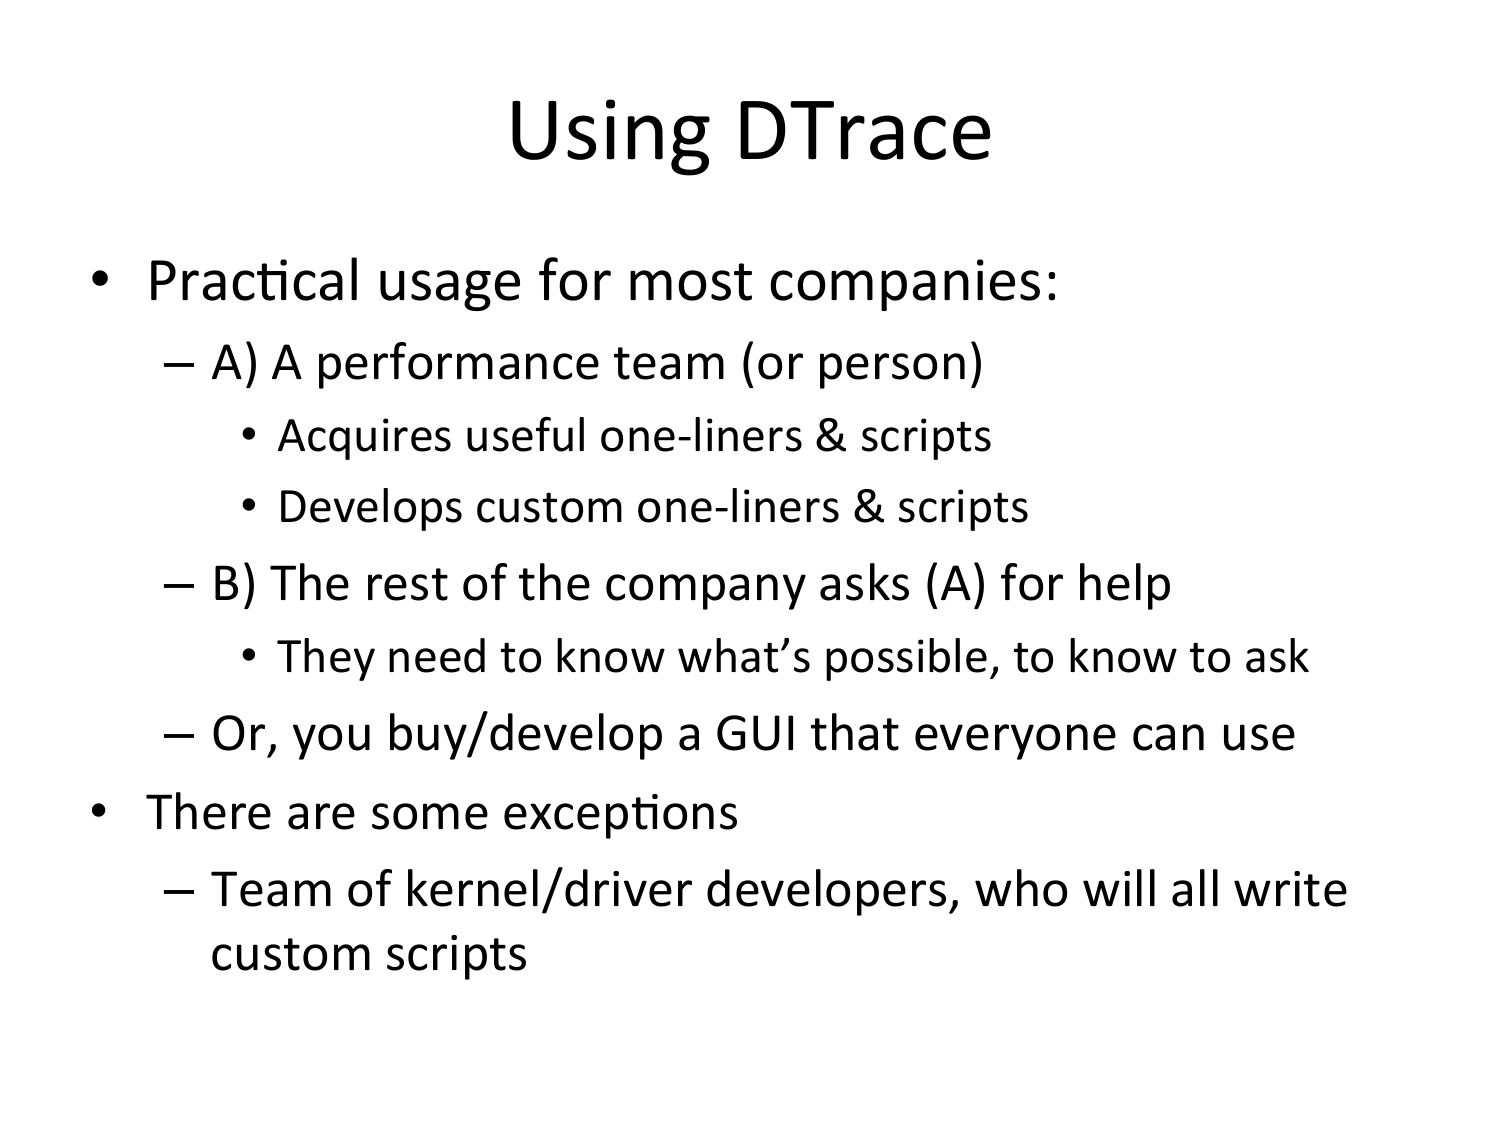
Using DTrace • PracOcal usage for most companies: – A) A performance team (or person) • Acquires useful one-‐liners & scripts • Develops custom one-‐liners & scripts – B) The rest of the company asks (A) for help • They need to know what’s possible, to know to ask – Or, you buy/develop a GUI that everyone can use • There are some excepOons – Team of kernel/driver developers, who will all write custom scriptsslide 52:
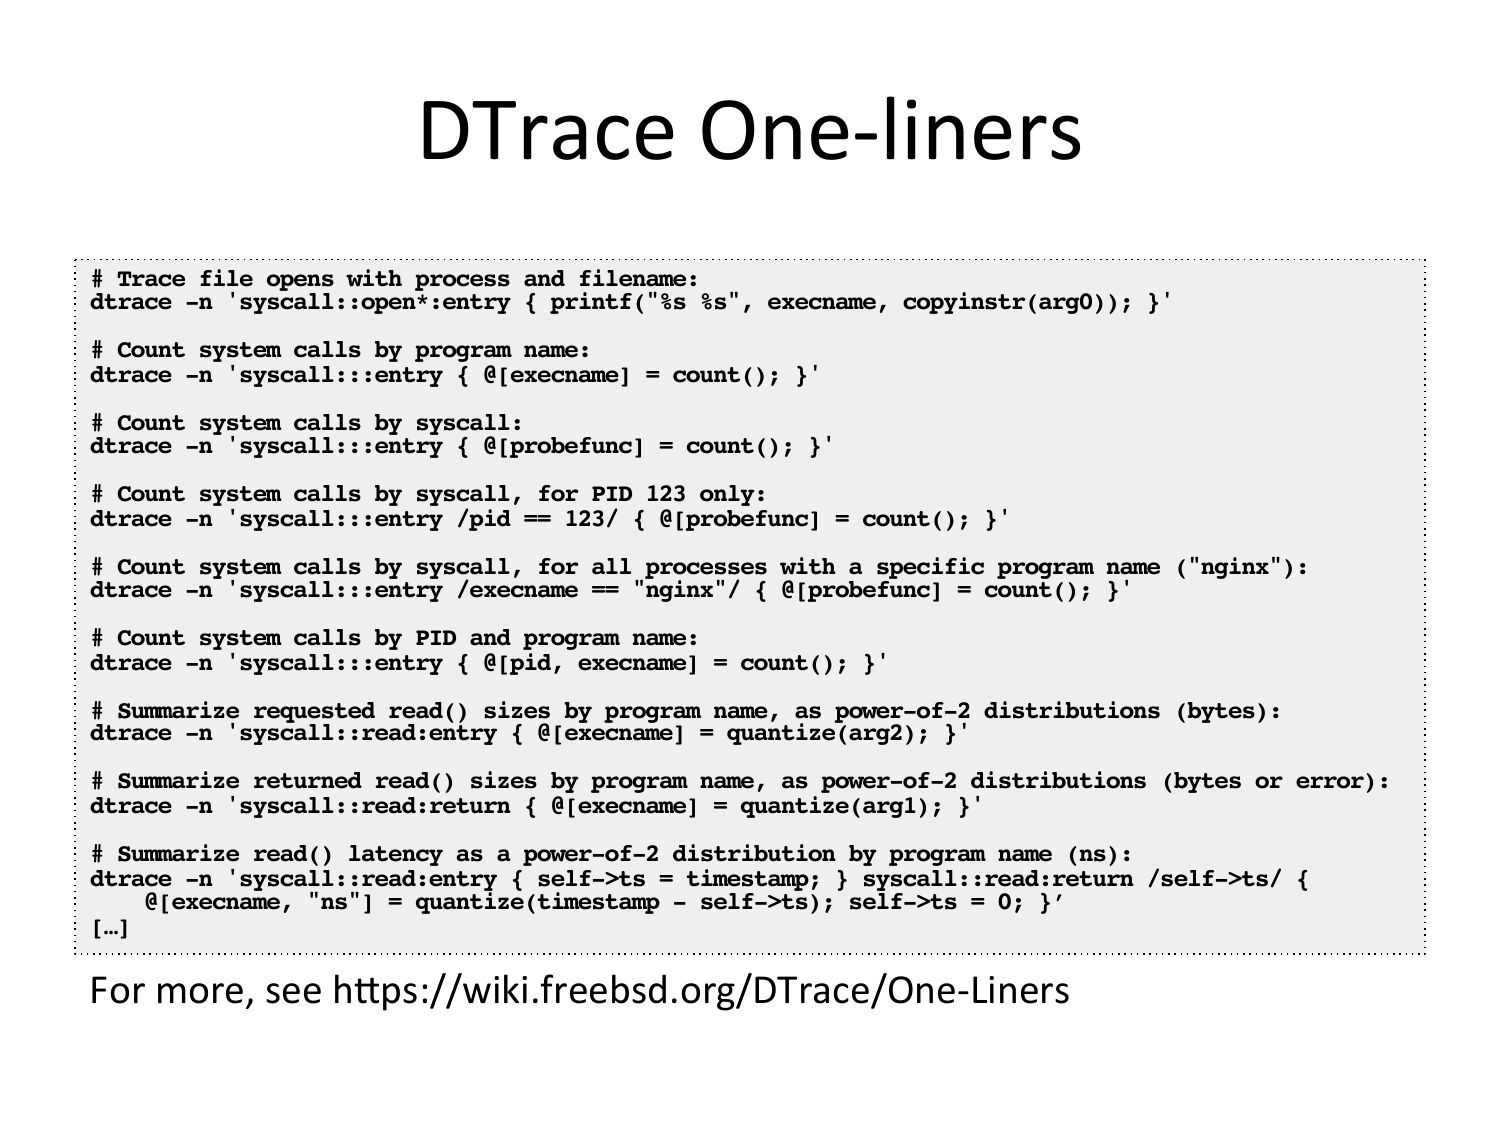
DTrace
One-‐liners
# Trace file opens with process and filename:!
dtrace -n 'syscall::open*:entry { printf("%s %s", execname, copyinstr(arg0)); }'!
# Count system calls by program name:!
dtrace -n 'syscall:::entry { @[execname] = count(); }'!
# Count system calls by syscall:!
dtrace -n 'syscall:::entry { @[probefunc] = count(); }'!
# Count system calls by syscall, for PID 123 only:!
dtrace -n 'syscall:::entry /pid == 123/ { @[probefunc] = count(); }'!
# Count system calls by syscall, for all processes with a specific program name ("nginx"):!
dtrace -n 'syscall:::entry /execname == "nginx"/ { @[probefunc] = count(); }'!
# Count system calls by PID and program name:!
dtrace -n 'syscall:::entry { @[pid, execname] = count(); }'!
# Summarize requested read() sizes by program name, as power-of-2 distributions (bytes):!
dtrace -n 'syscall::read:entry { @[execname] = quantize(arg2); }'!
# Summarize returned read() sizes by program name, as power-of-2 distributions (bytes or error):!
dtrace -n 'syscall::read:return { @[execname] = quantize(arg1); }'!
# Summarize read() latency as a power-of-2 distribution by program name (ns):!
dtrace -n 'syscall::read:entry { self->gt;ts = timestamp; } syscall::read:return /self->gt;ts/ {!
@[execname, "ns"] = quantize(timestamp - self->gt;ts); self->gt;ts = 0; }’!
[…]!
For
more,
see
hpps://wiki.freebsd.org/DTrace/One-‐Liners
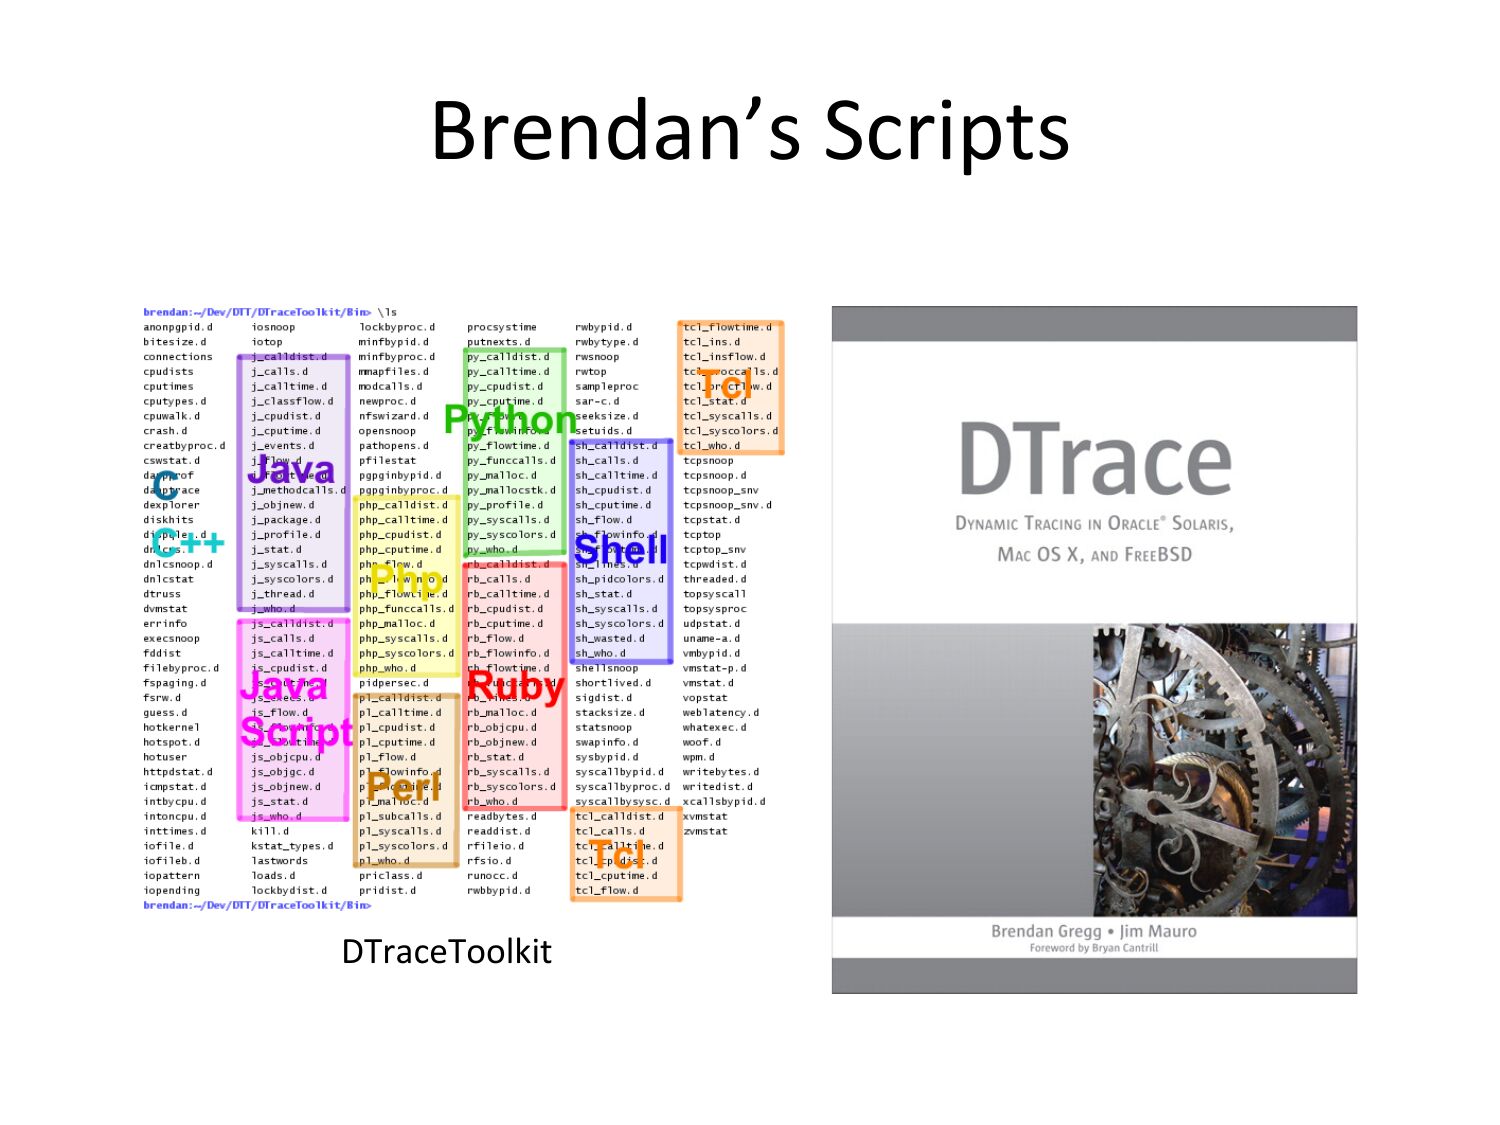
slide 53:Brendan’s Scripts DTraceToolkitslide 54:
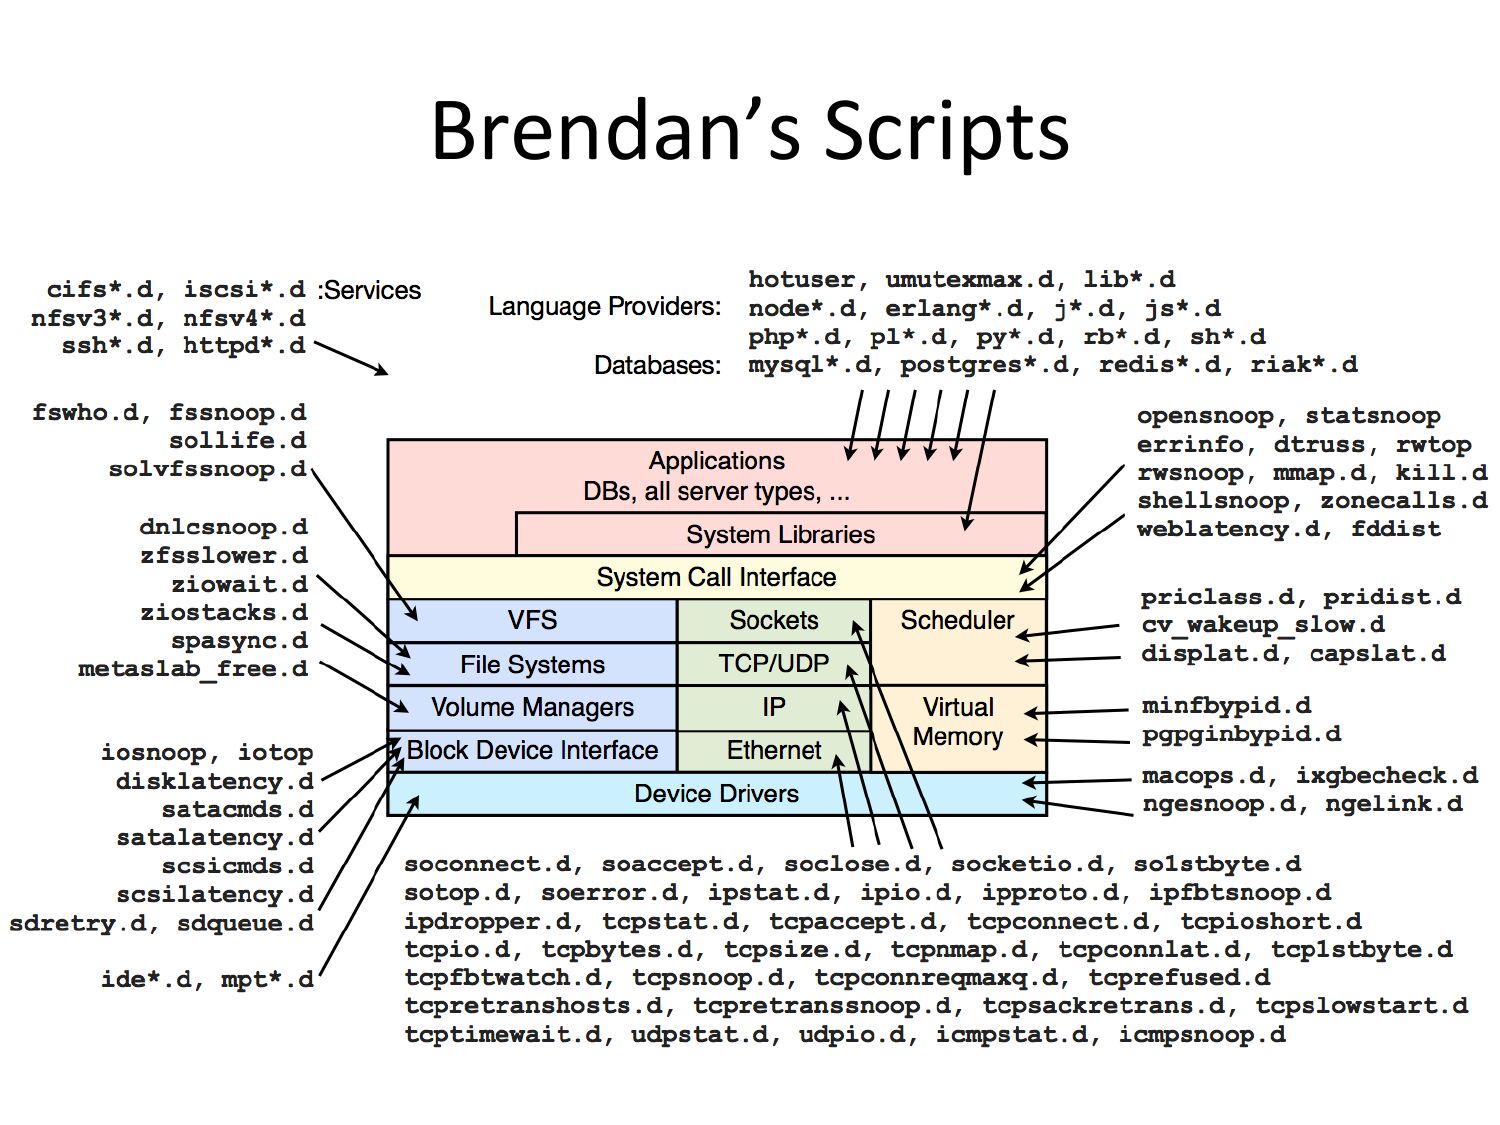
Brendan’s
  Scripts
slide 55:
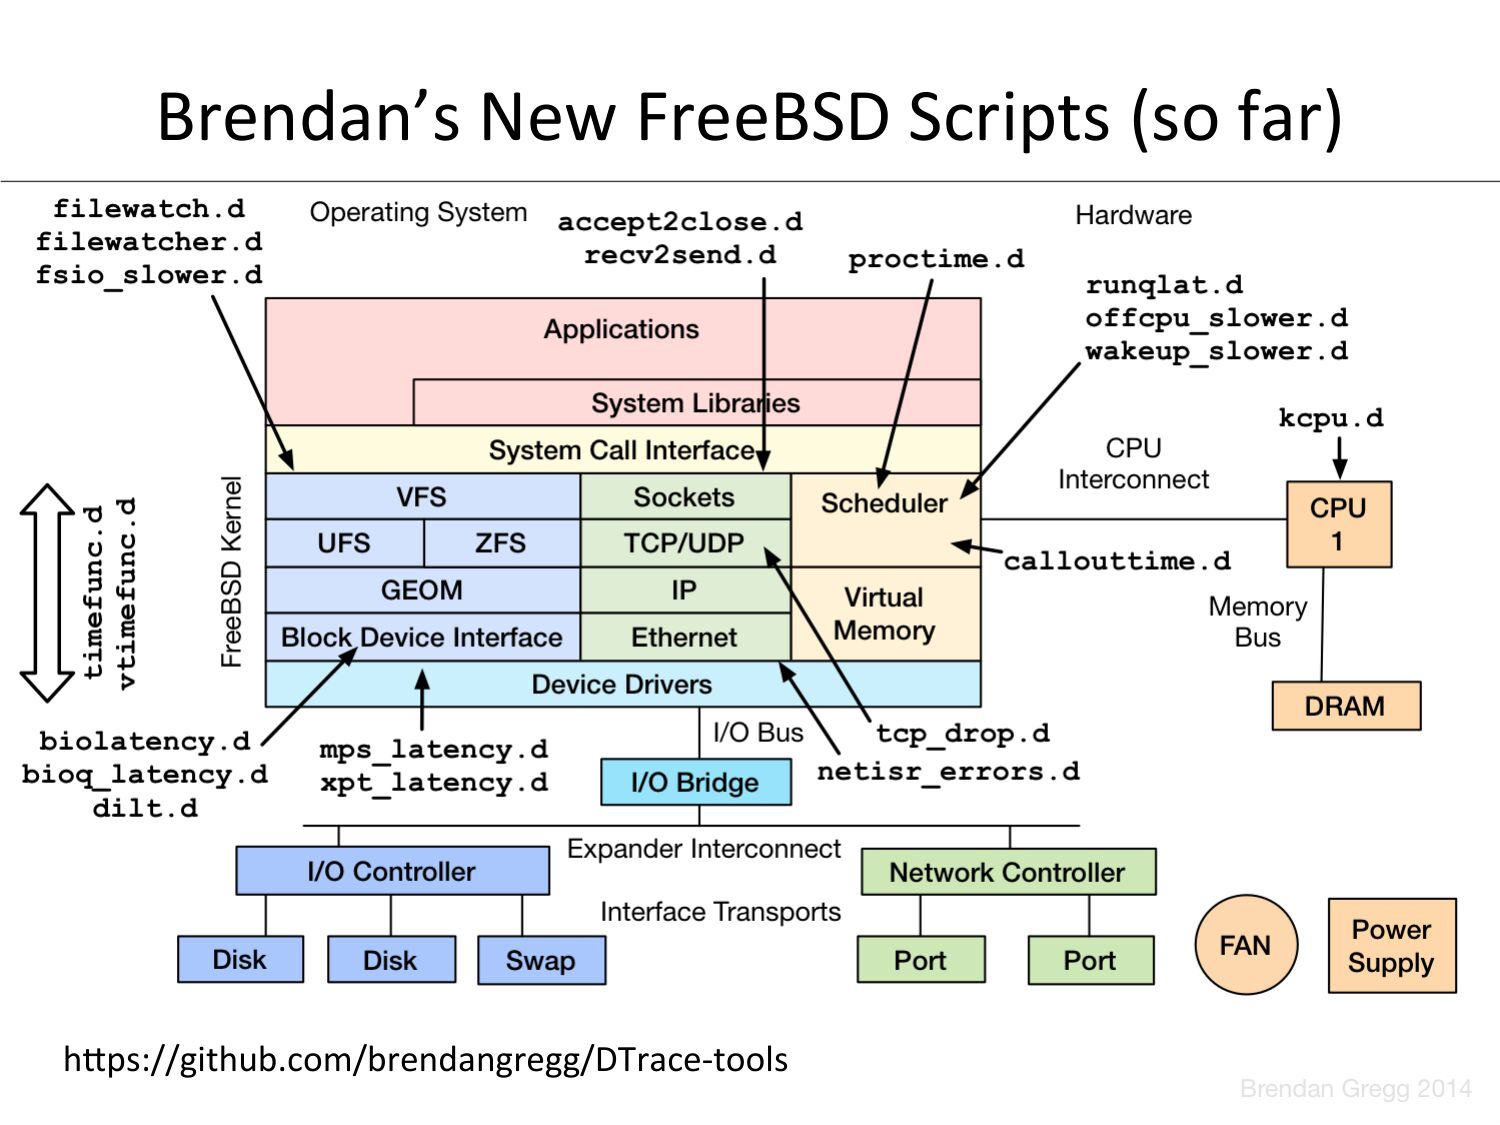
Brendan’s New FreeBSD Scripts (so far) hpps://github.com/brendangregg/DTrace-‐toolsslide 56:
DEMOslide 57:
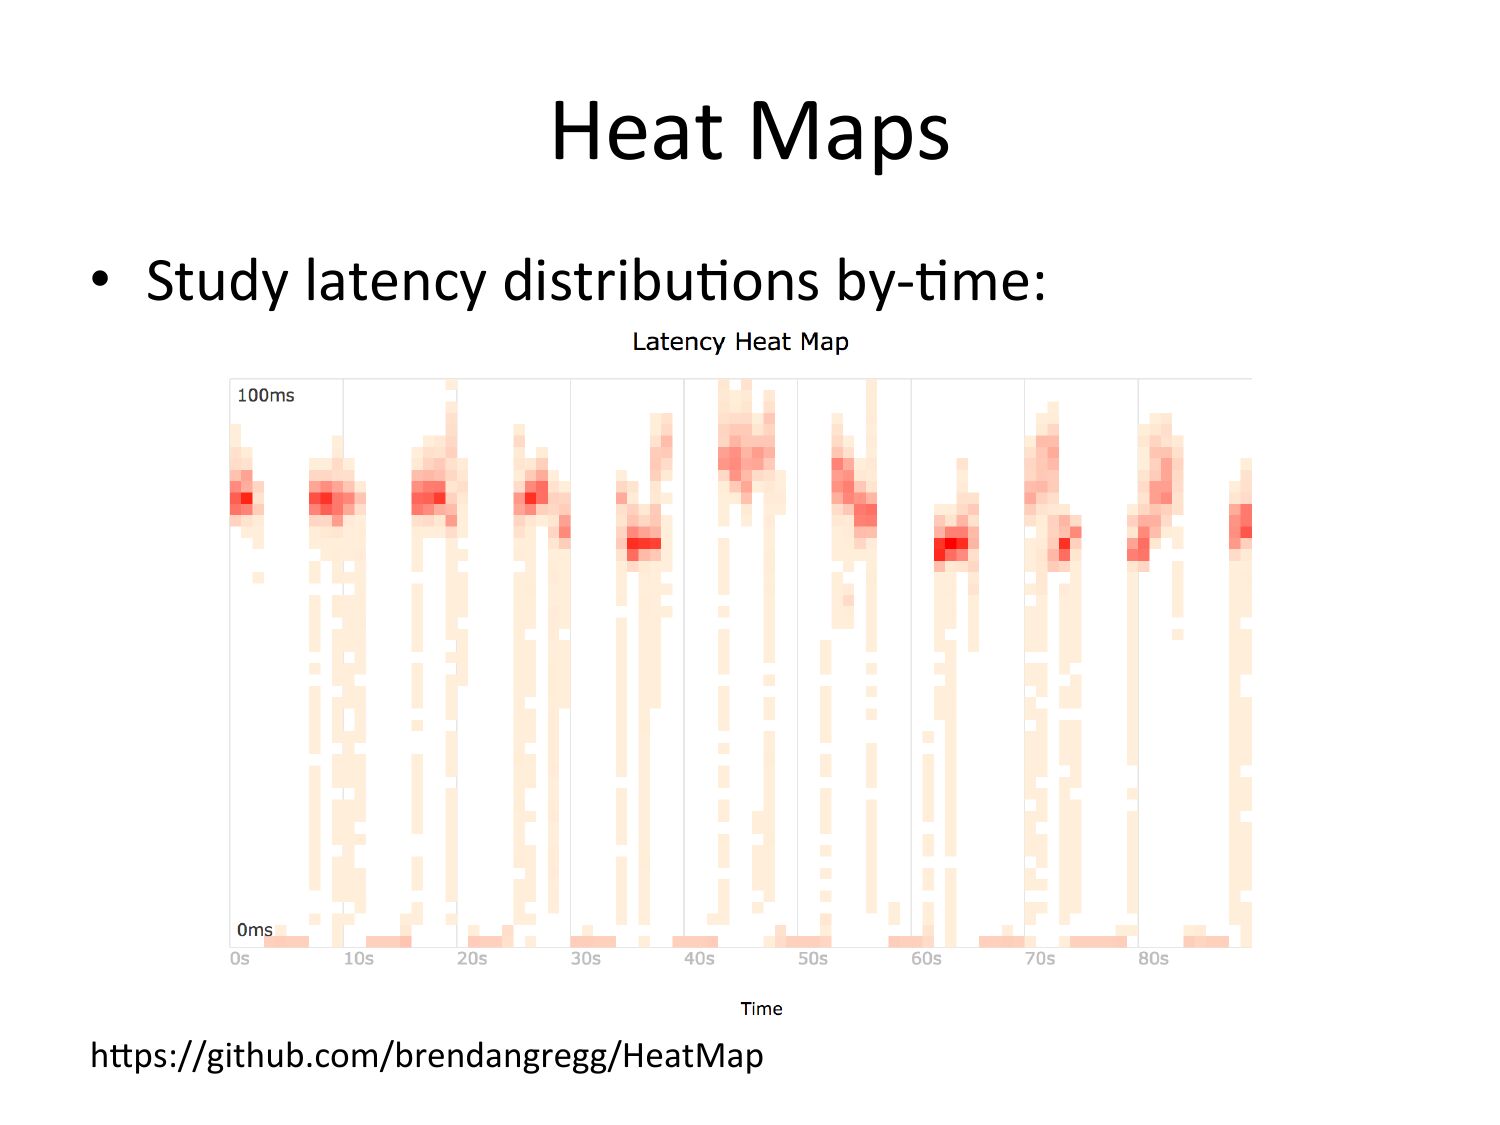
Heat Maps • Study latency distribuOons by-‐Ome: hpps://github.com/brendangregg/HeatMapslide 58:
Summary

A
  brief
  discussion
  of
  5
  facets
  of
  performance
  analysis

on
  FreeBSD

1. Observability
  Tools

2. Methodologies

3. Benchmarking

4. Tracing

5. Counters
slide 59:
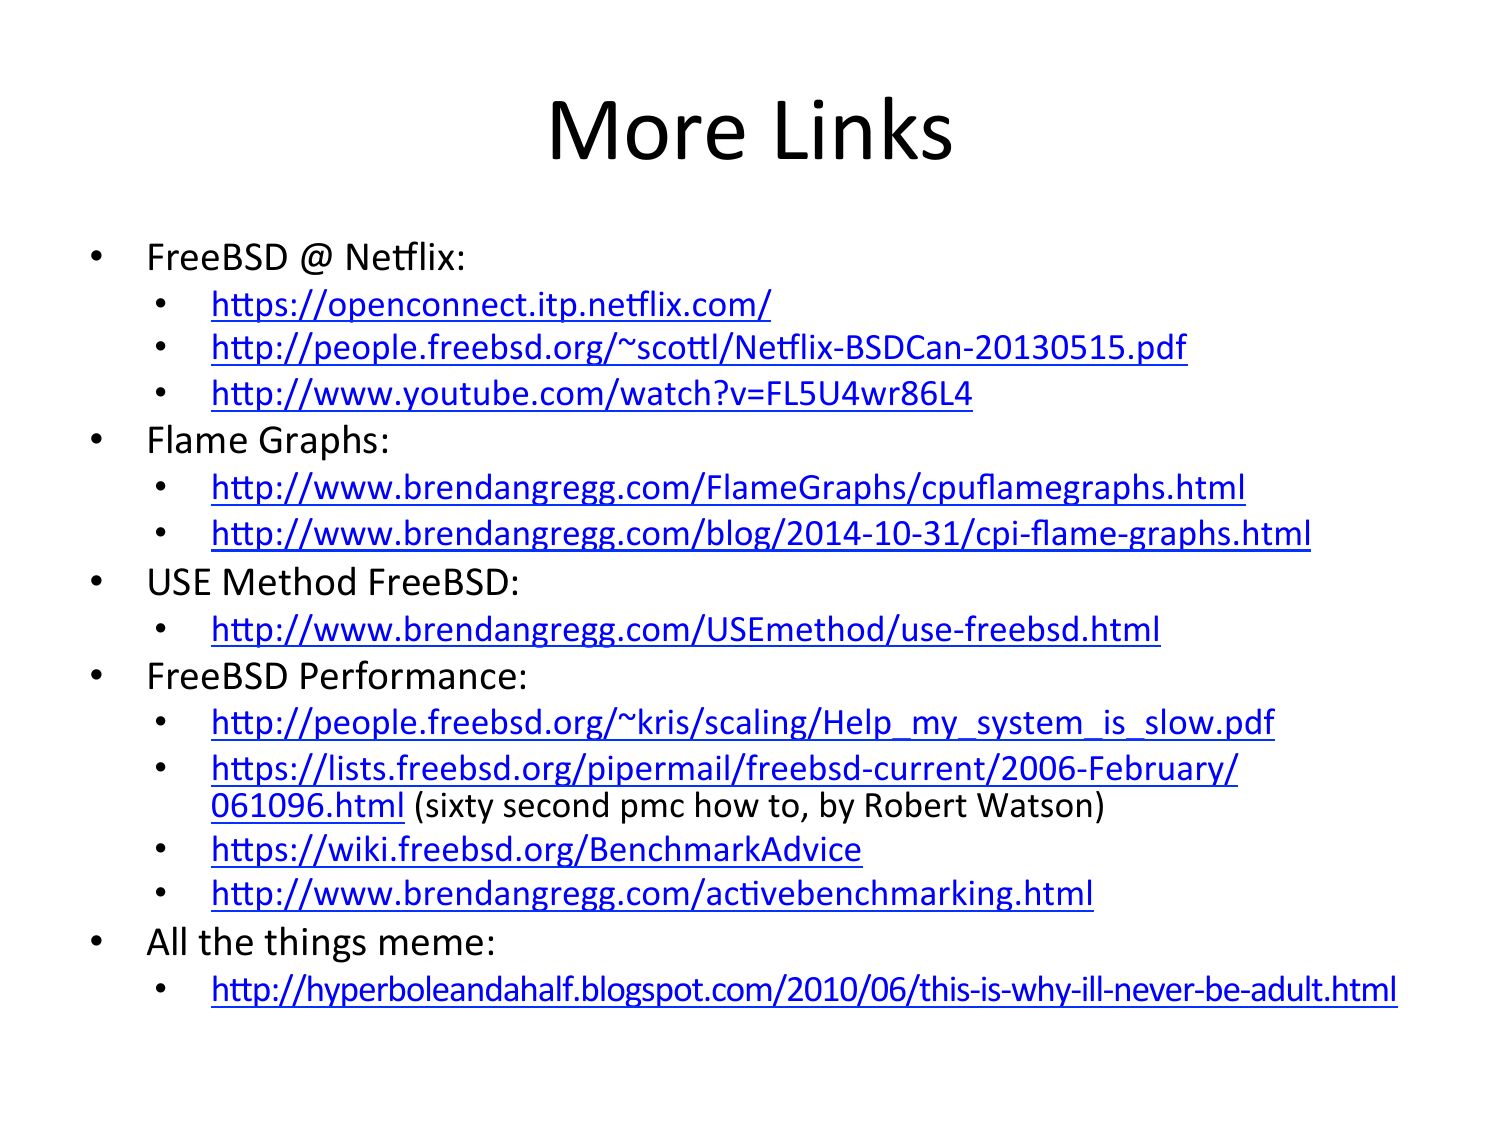
More Links FreeBSD @ NeVlix: Flame Graphs: hpp://www.brendangregg.com/USEmethod/use-‐freebsd.html FreeBSD Performance: hpp://www.brendangregg.com/FlameGraphs/cpuflamegraphs.html hpp://www.brendangregg.com/blog/2014-‐10-‐31/cpi-‐flame-‐graphs.html USE Method FreeBSD: hpps://openconnect.itp.neVlix.com/ hpp://people.freebsd.org/~scopl/NeVlix-‐BSDCan-‐20130515.pdf hpp://www.youtube.com/watch?v=FL5U4wr86L4 hpp://people.freebsd.org/~kris/scaling/Help_my_system_is_slow.pdf hpps://lists.freebsd.org/pipermail/freebsd-‐current/2006-‐February/ 061096.html (sixty second pmc how to, by Robert Watson) hpps://wiki.freebsd.org/BenchmarkAdvice hpp://www.brendangregg.com/acOvebenchmarking.html All the things meme: hpp://hyperboleandahalf.blogspot.com/2010/06/this-‐is-‐why-‐ill-‐never-‐be-‐adult.htmlslide 60:
Thanks

• QuesOons?

• hpp://slideshare.net/brendangregg


• hpp://www.brendangregg.com

• bgregg@neVlix.com

• @brendangregg
