Netflix Engineering: RxNetty vs Tomcat Performance Results
A 2015 performance study by Brendan Gregg, Nitesh Kant, and Ben Christensen. Original is in https://github.com/Netflix-Skunkworks/WSPerfLab/tree/master/test-results| next prev 1/36 | |
| next prev 2/36 | |
| next prev 3/36 | |
| next prev 4/36 | |
| next prev 5/36 | |
| next prev 6/36 | |
| next prev 7/36 | |
| next prev 8/36 | |
| next prev 9/36 | |
| next prev 10/36 | |
| next prev 11/36 | |
| next prev 12/36 | |
| next prev 13/36 | |
| next prev 14/36 | |
| next prev 15/36 | |
| next prev 16/36 | |
| next prev 17/36 | |
| next prev 18/36 | |
| next prev 19/36 | |
| next prev 20/36 | |
| next prev 21/36 | |
| next prev 22/36 | |
| next prev 23/36 | |
| next prev 24/36 | |
| next prev 25/36 | |
| next prev 26/36 | |
| next prev 27/36 | |
| next prev 28/36 | |
| next prev 29/36 | |
| next prev 30/36 | |
| next prev 31/36 | |
| next prev 32/36 | |
| next prev 33/36 | |
| next prev 34/36 | |
| next prev 35/36 | |
| next prev 36/36 |
PDF: RxNetty_vs_Tomcat_April2015.pdf
Keywords (from pdftotext):
slide 1:
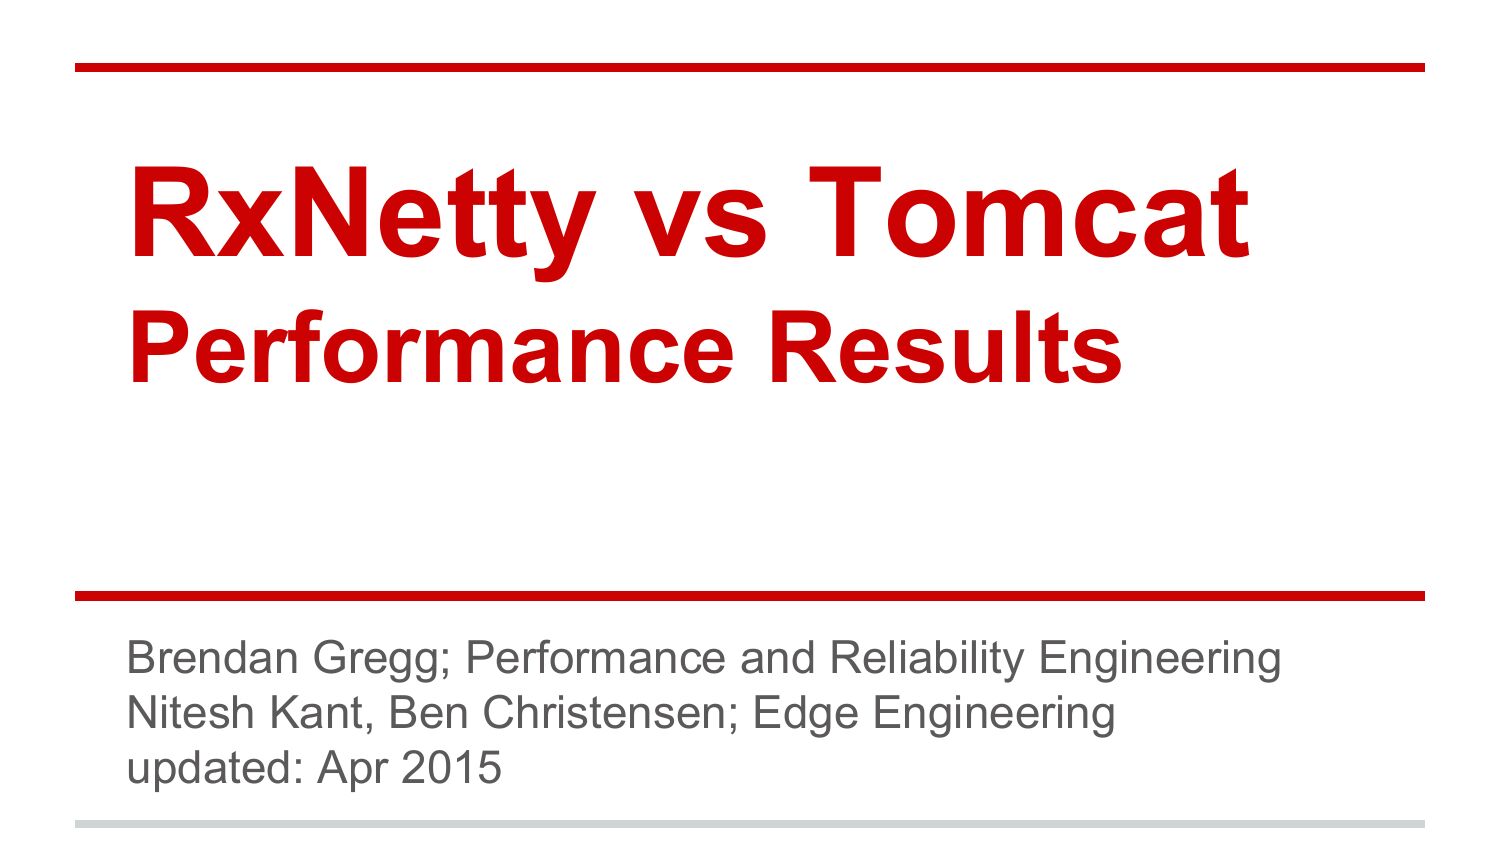
RxNetty vs Tomcat
Performance Results
Brendan Gregg; Performance and Reliability Engineering
Nitesh Kant, Ben Christensen; Edge Engineering
updated: Apr 2015
slide 2:
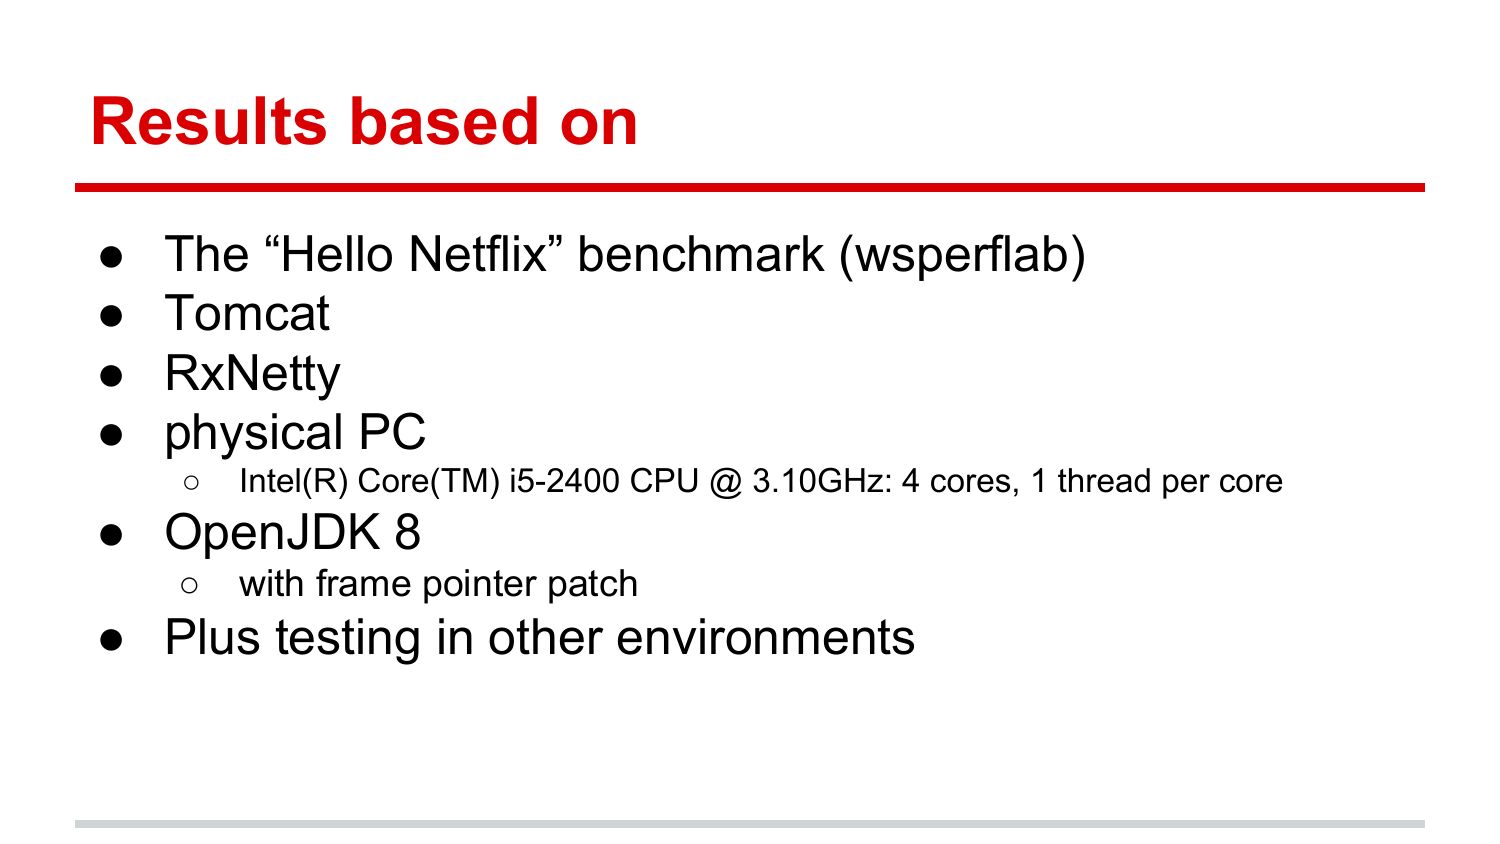
Results based on
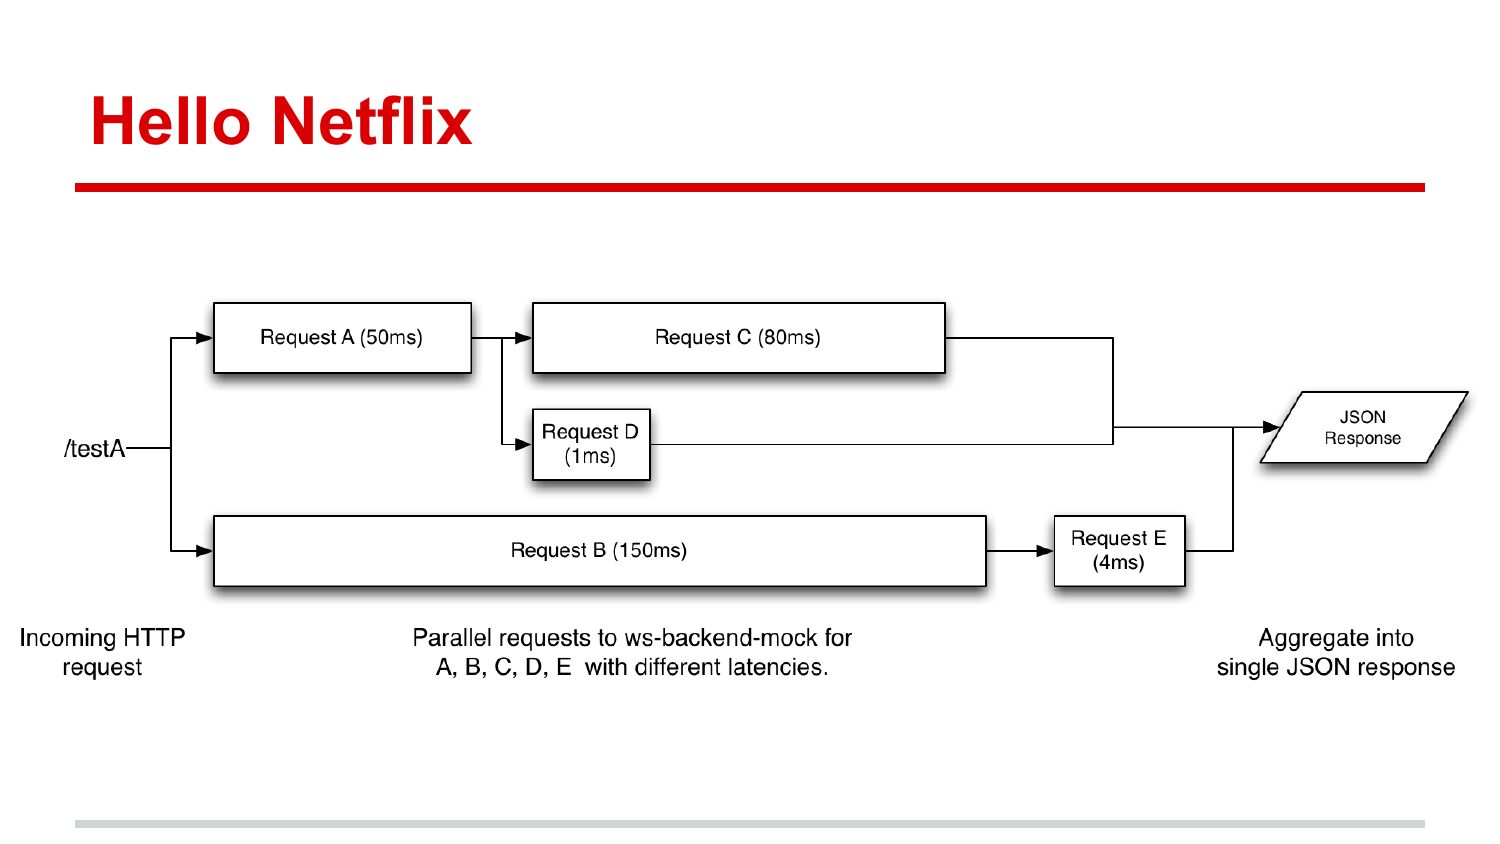
The “Hello Netflix” benchmark (wsperflab)
Tomcat
RxNetty
physical PC
Intel(R) Core(TM) i5-2400 CPU @ 3.10GHz: 4 cores, 1 thread per core
● OpenJDK 8
with frame pointer patch
● Plus testing in other environments
slide 3:
Hello Netflixslide 4:
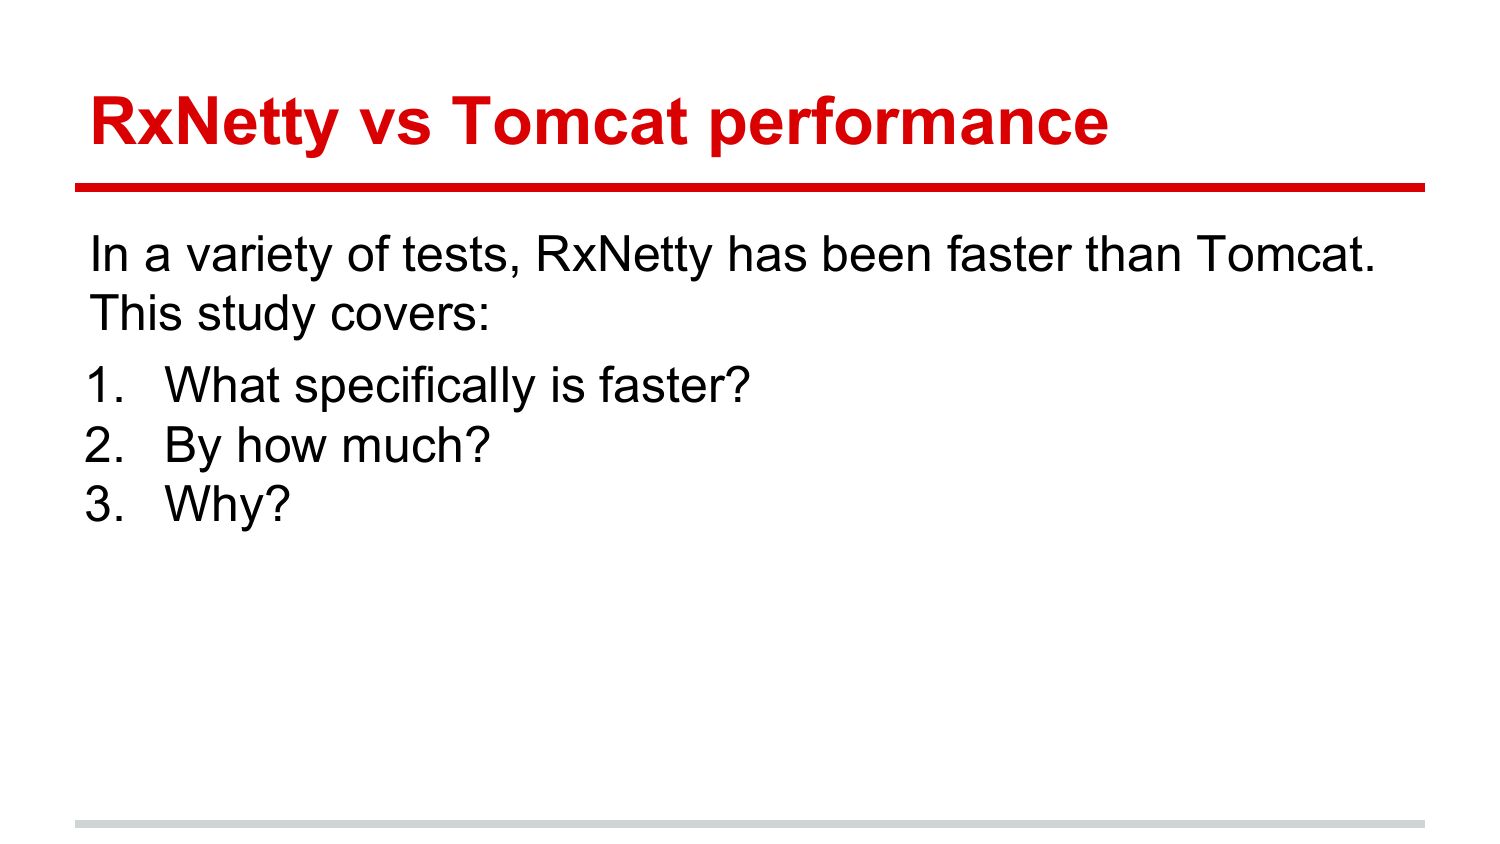
RxNetty vs Tomcat performance
In a variety of tests, RxNetty has been faster than Tomcat.
This study covers:
1. What specifically is faster?
2. By how much?
3. Why?
slide 5:
1. What specifically is faster?slide 6:
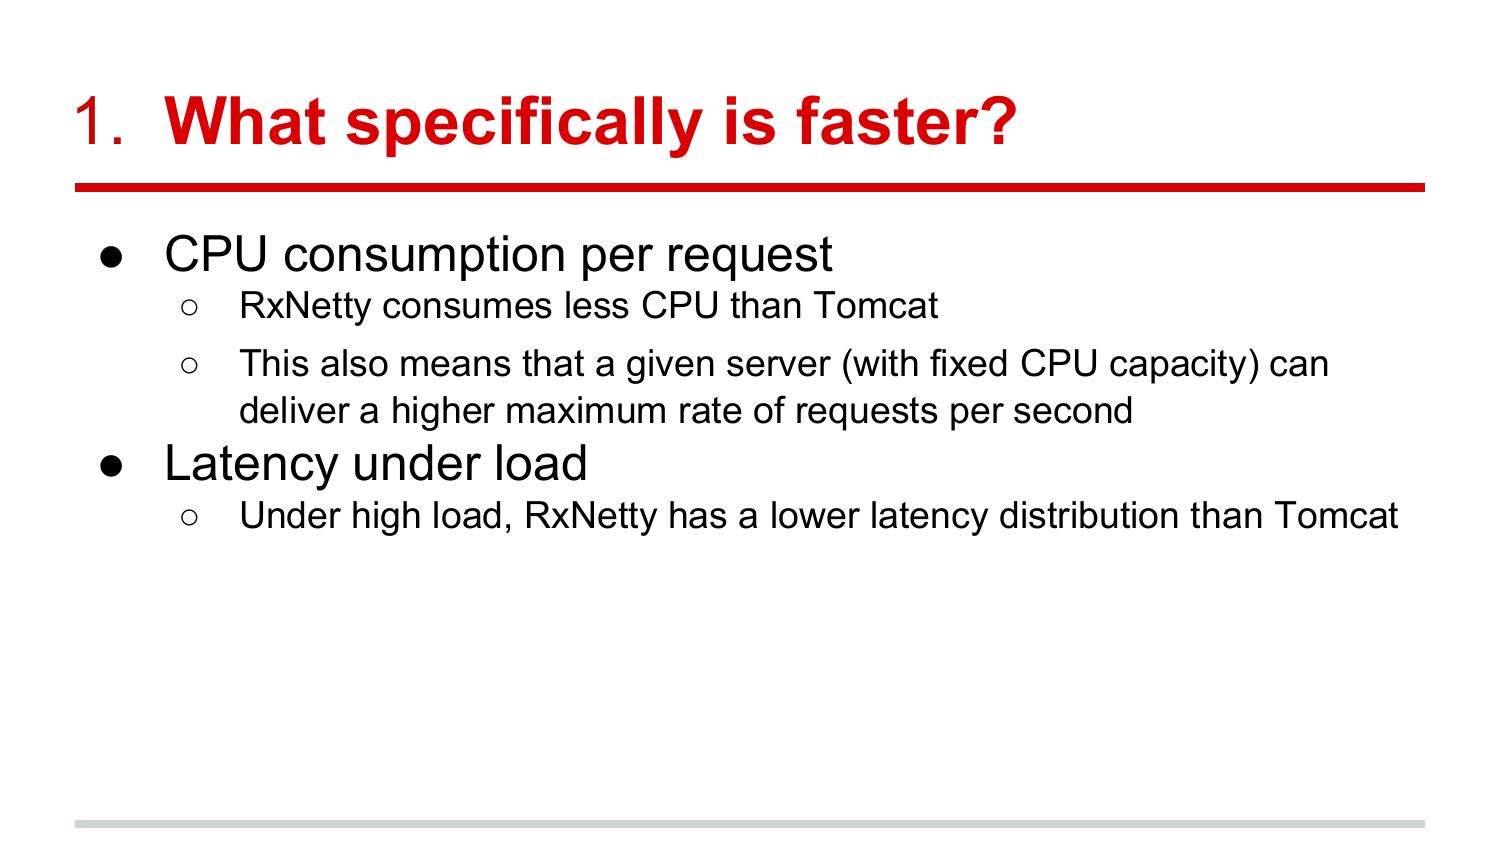
1. What specifically is faster?
● CPU consumption per request
RxNetty consumes less CPU than Tomcat
This also means that a given server (with fixed CPU capacity) can
deliver a higher maximum rate of requests per second
● Latency under load
Under high load, RxNetty has a lower latency distribution than Tomcat
slide 7:
2. By how much?slide 8:
2. By how much?
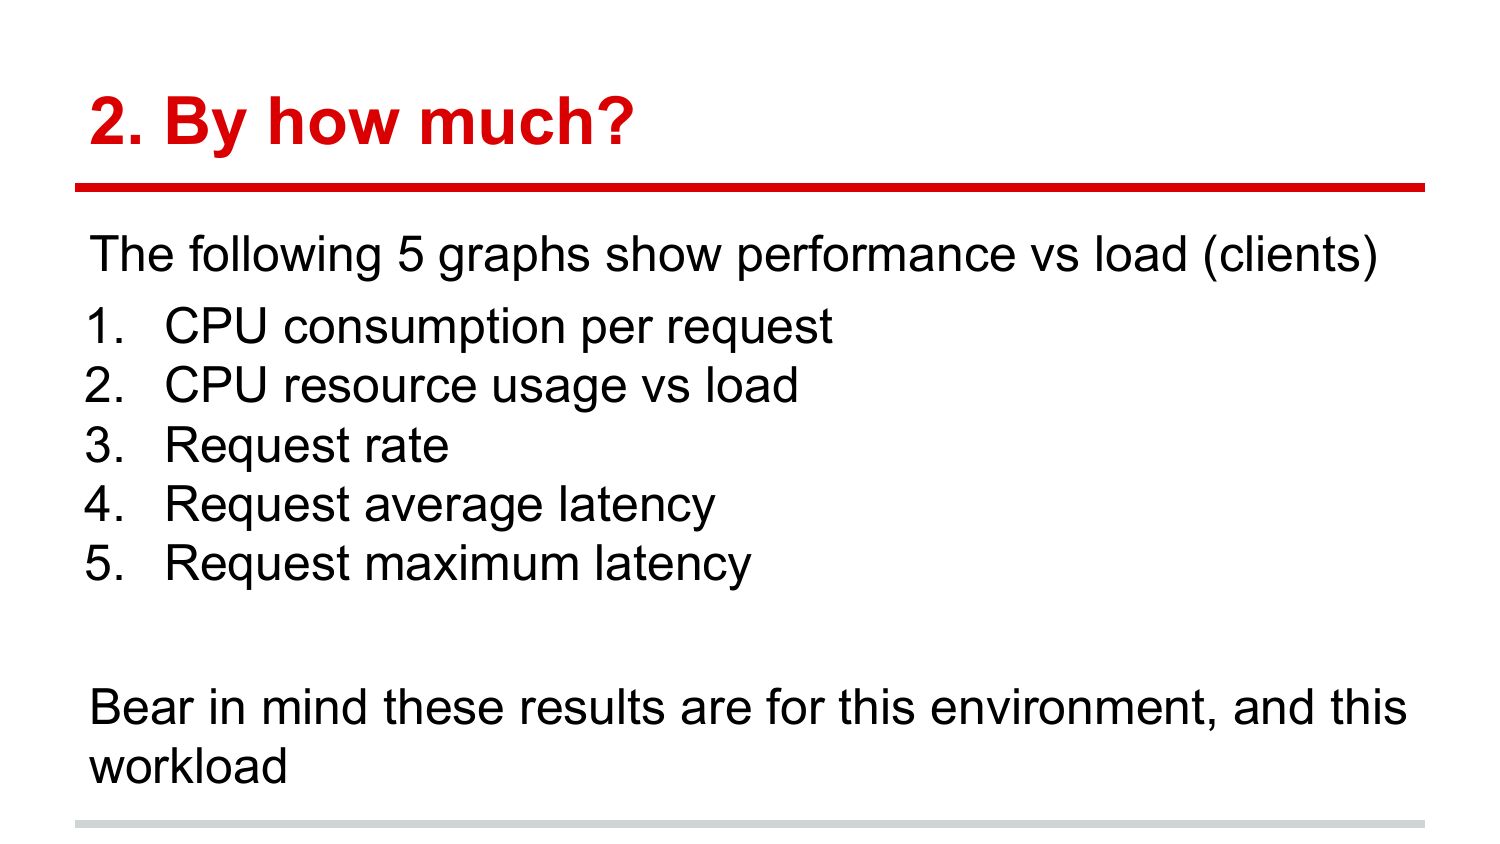
The following 5 graphs show performance vs load (clients)
1. CPU consumption per request
2. CPU resource usage vs load
3. Request rate
4. Request average latency
5. Request maximum latency
Bear in mind these results are for this environment, and this
workload
slide 9:
2.1. CPU Consumption Per Request
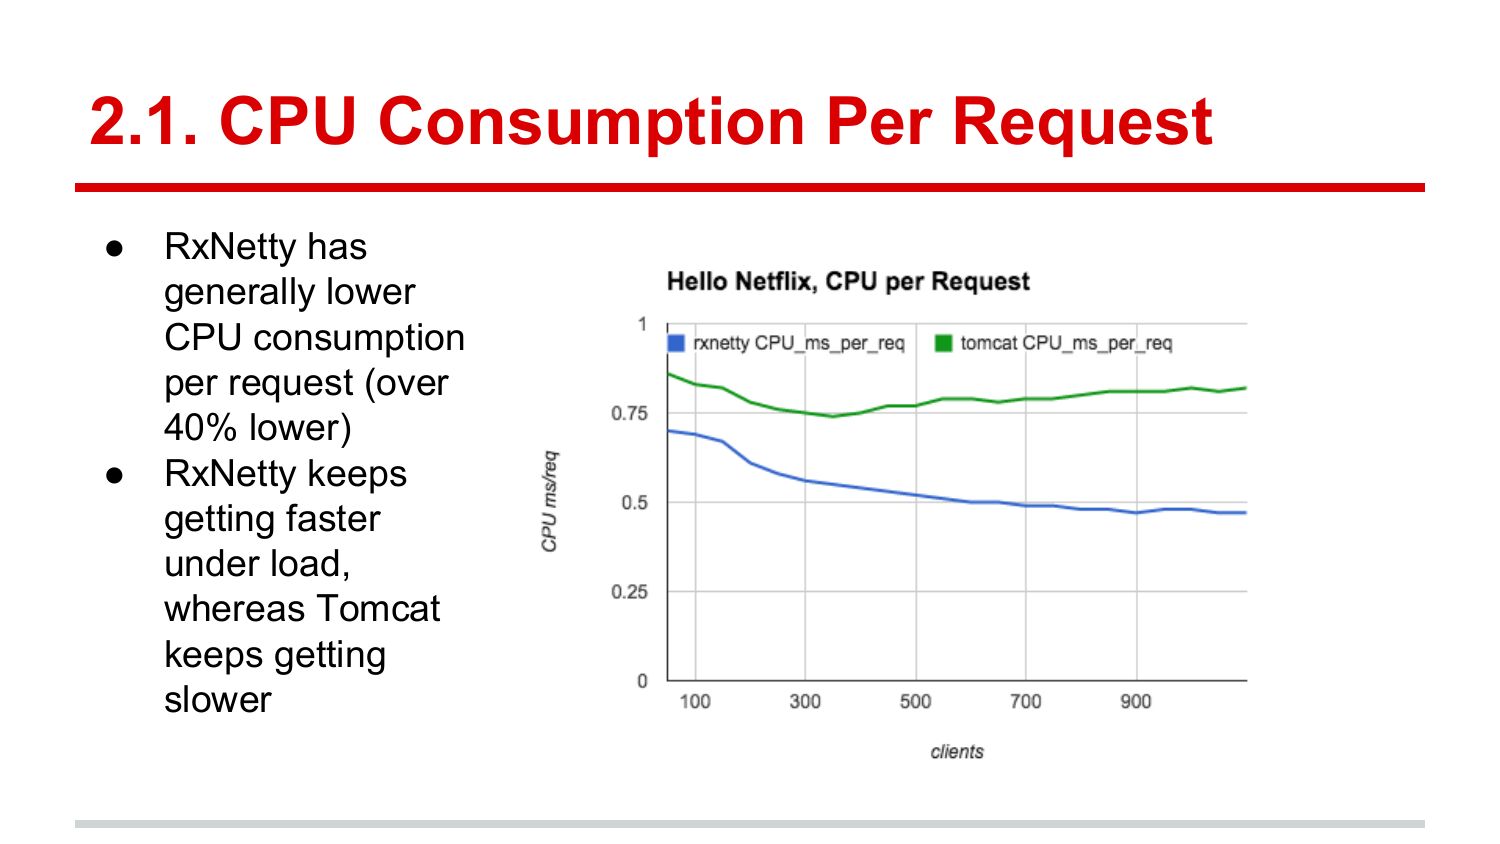
RxNetty has
generally lower
CPU consumption
per request (over
40% lower)
RxNetty keeps
getting faster
under load,
whereas Tomcat
keeps getting
slower
slide 10:
2.2. CPU Resource Usage vs Load
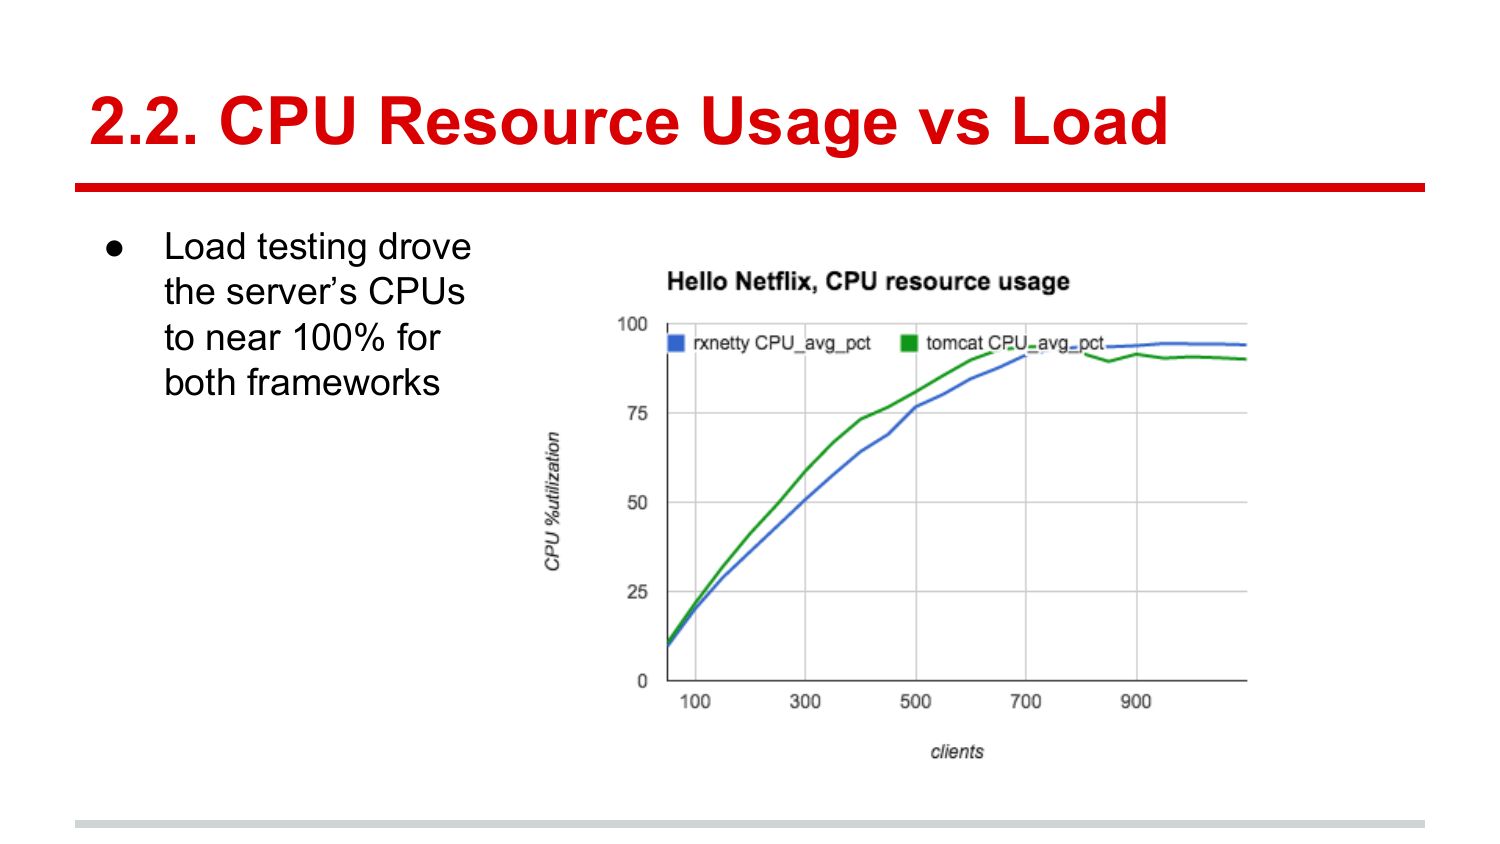
Load testing drove
the server’s CPUs
to near 100% for
both frameworks
slide 11:
2.3. Request Rate
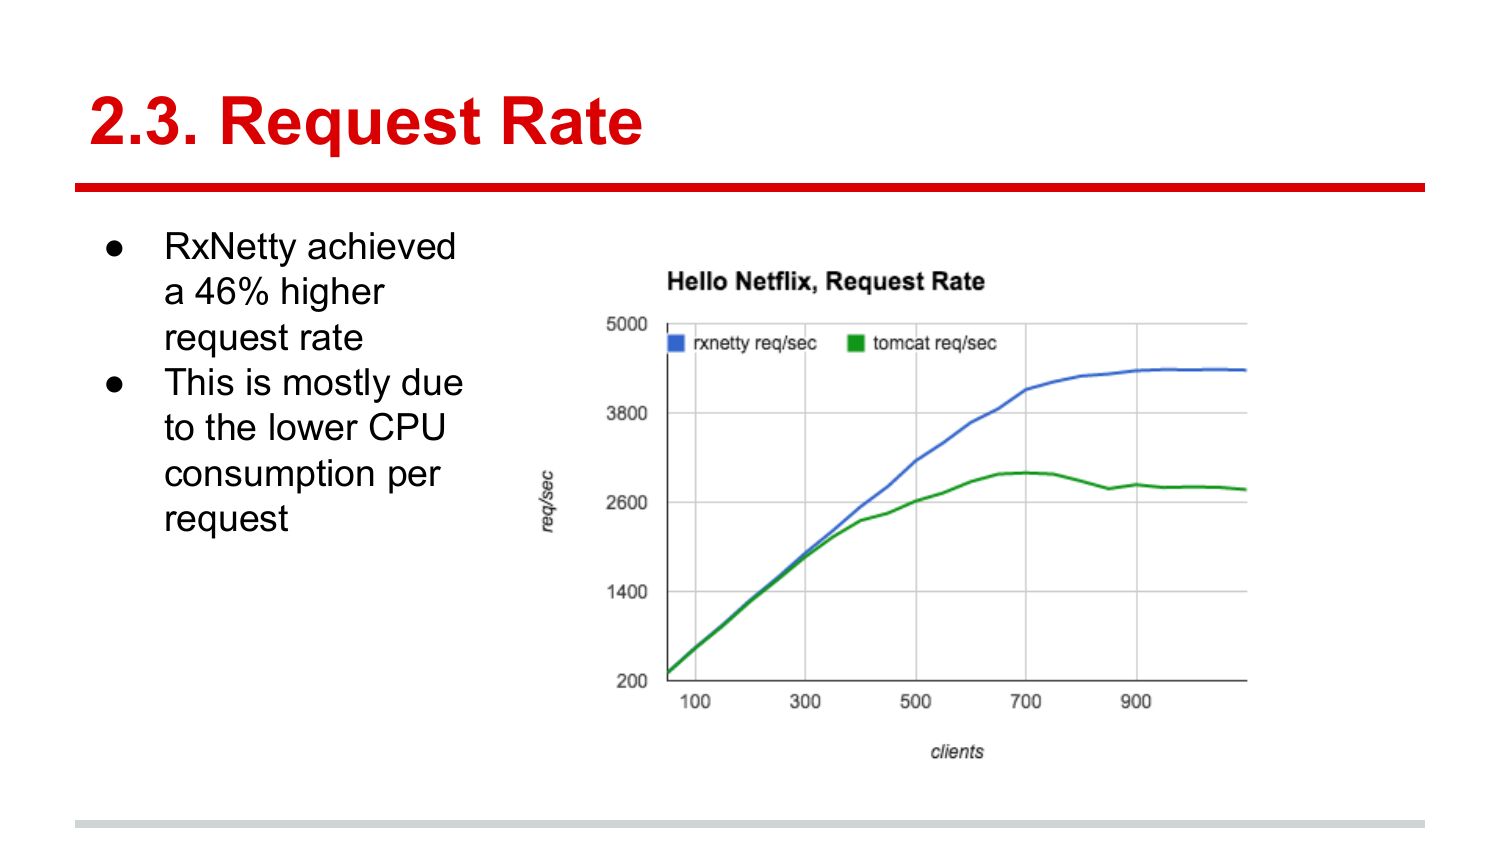
RxNetty achieved
a 46% higher
request rate
This is mostly due
to the lower CPU
consumption per
request
slide 12:
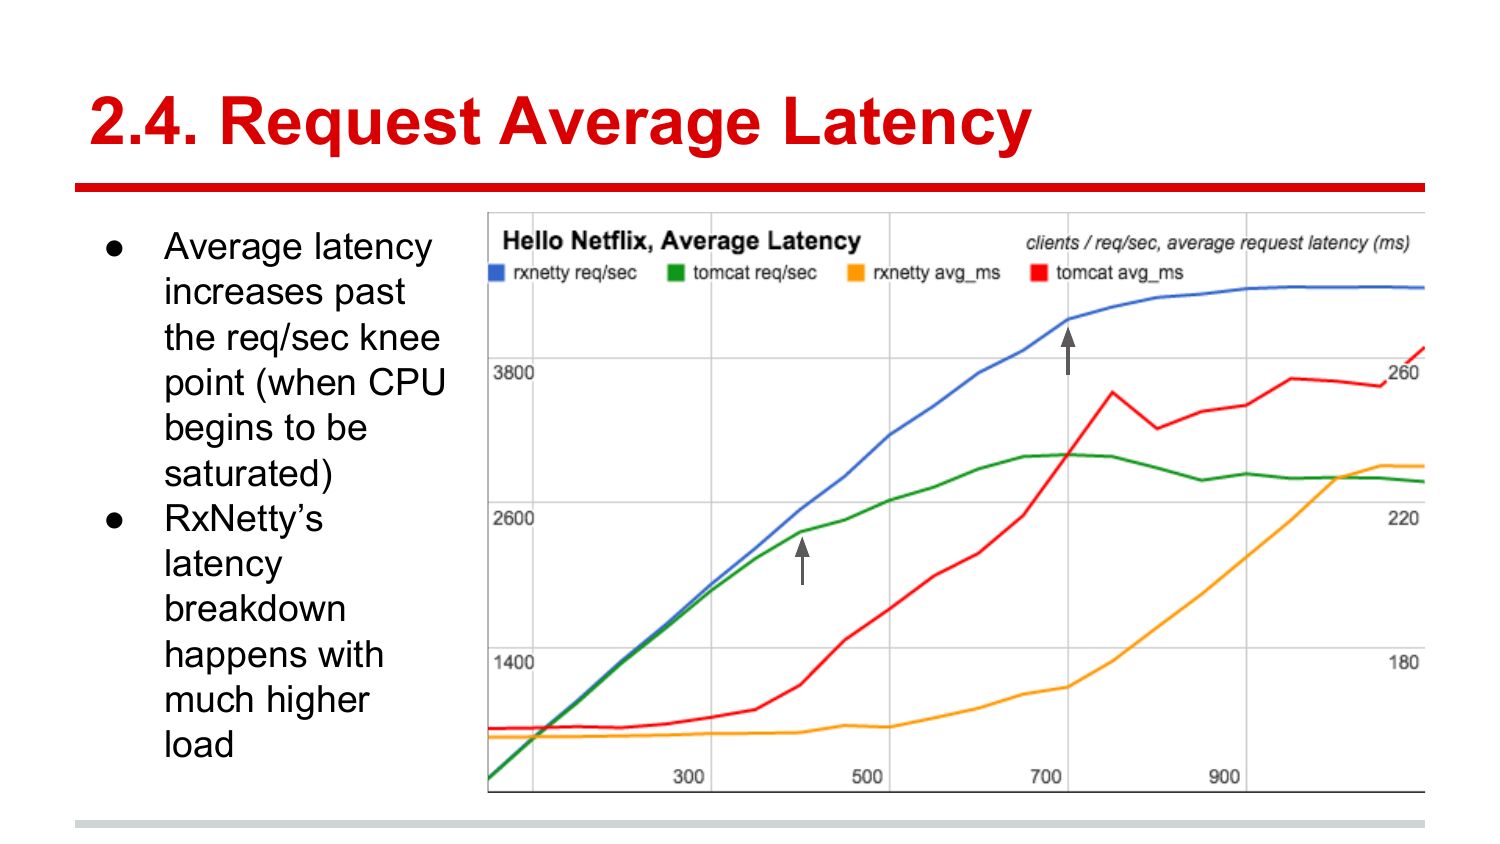
2.4. Request Average Latency
Average latency
increases past
the req/sec knee
point (when CPU
begins to be
saturated)
RxNetty’s
latency
breakdown
happens with
much higher
load
slide 13:
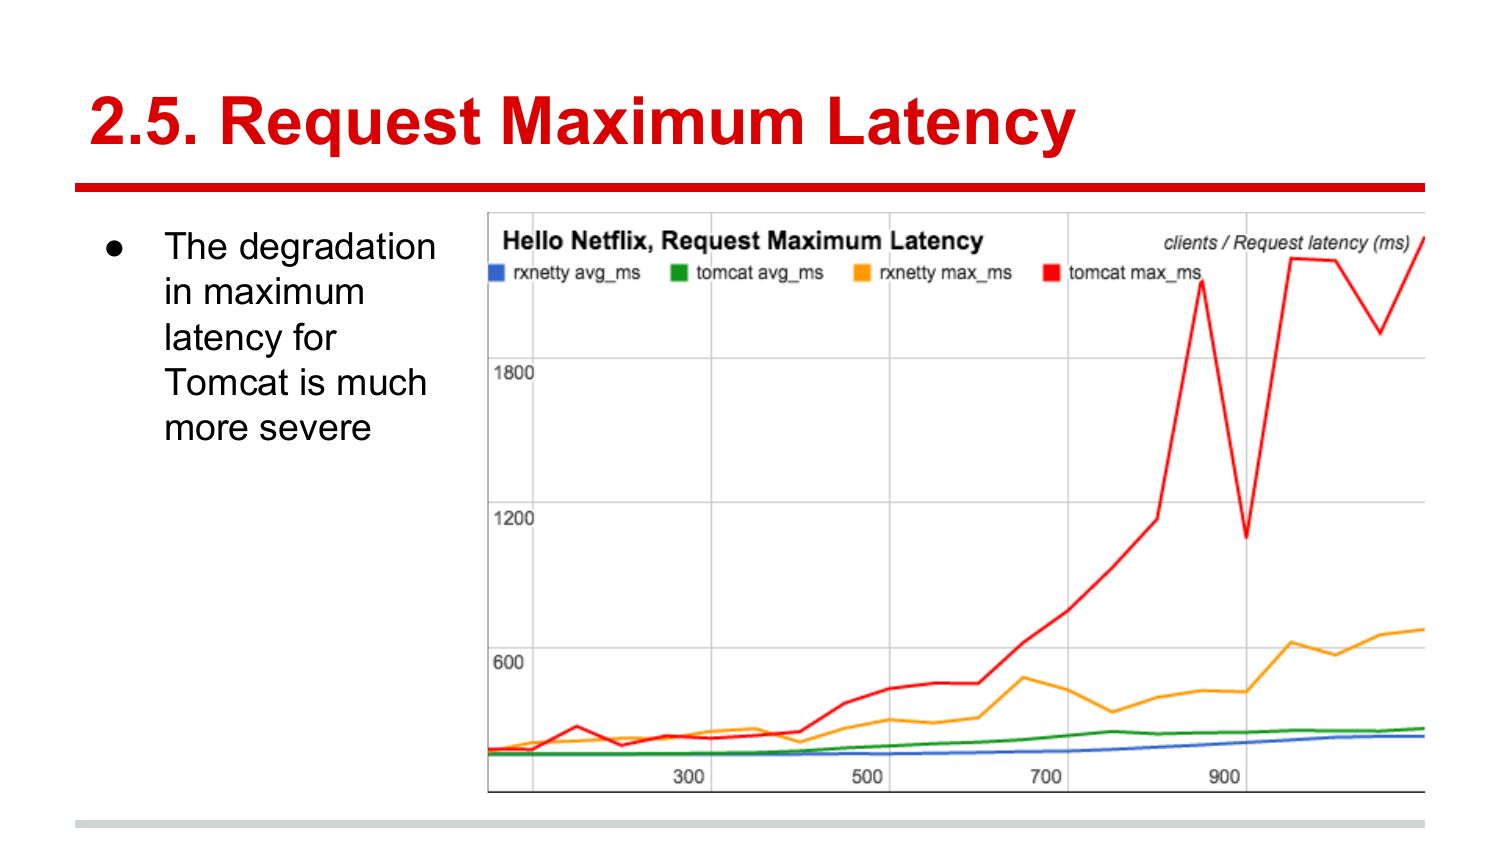
2.5. Request Maximum Latency
The degradation
in maximum
latency for
Tomcat is much
more severe
slide 14:
3. Why?slide 15:
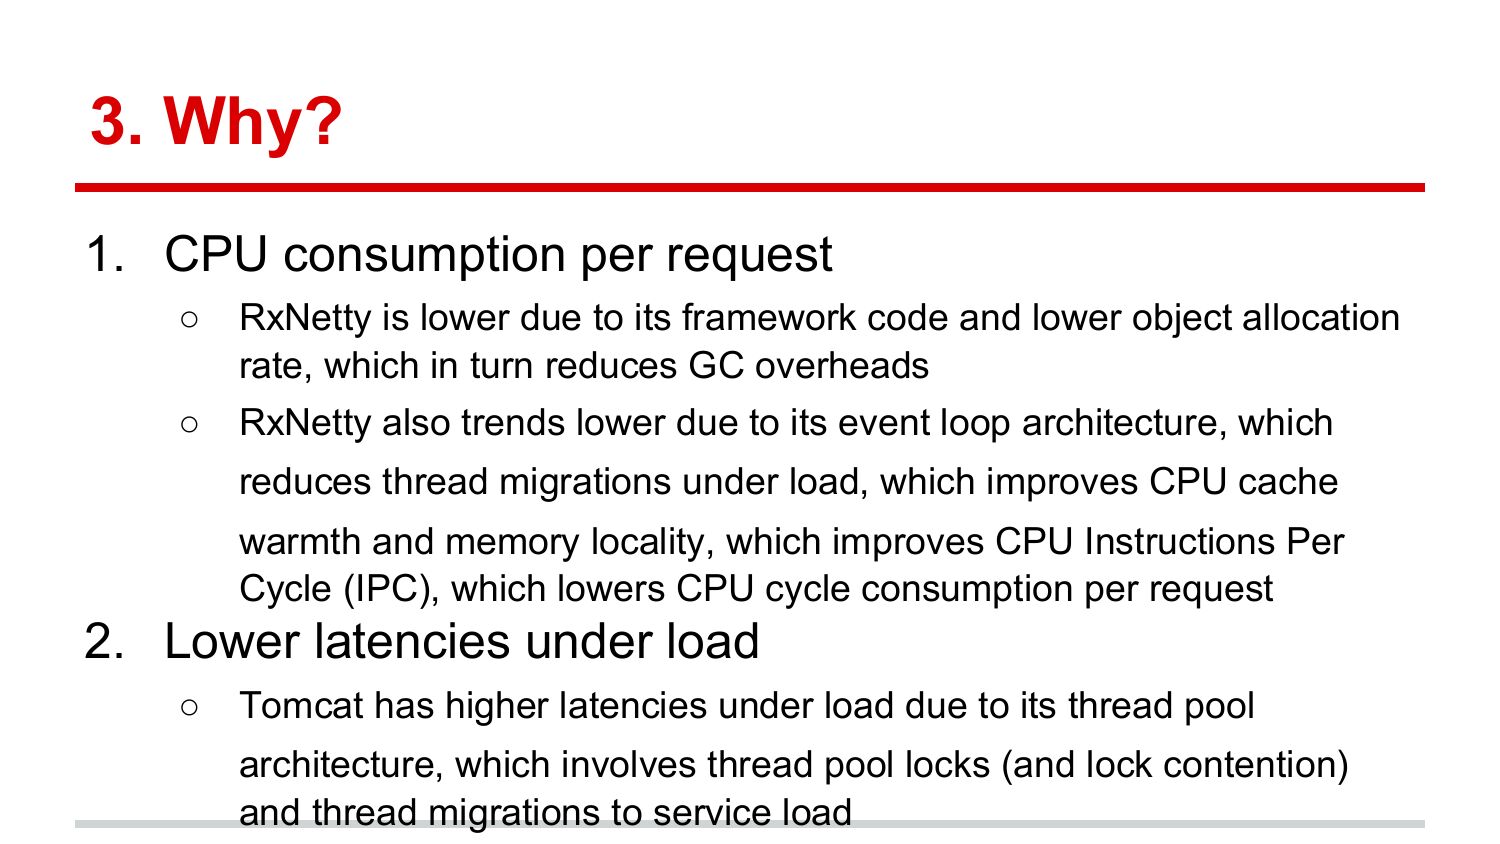
3. Why?
1. CPU consumption per request
RxNetty is lower due to its framework code and lower object allocation
rate, which in turn reduces GC overheads
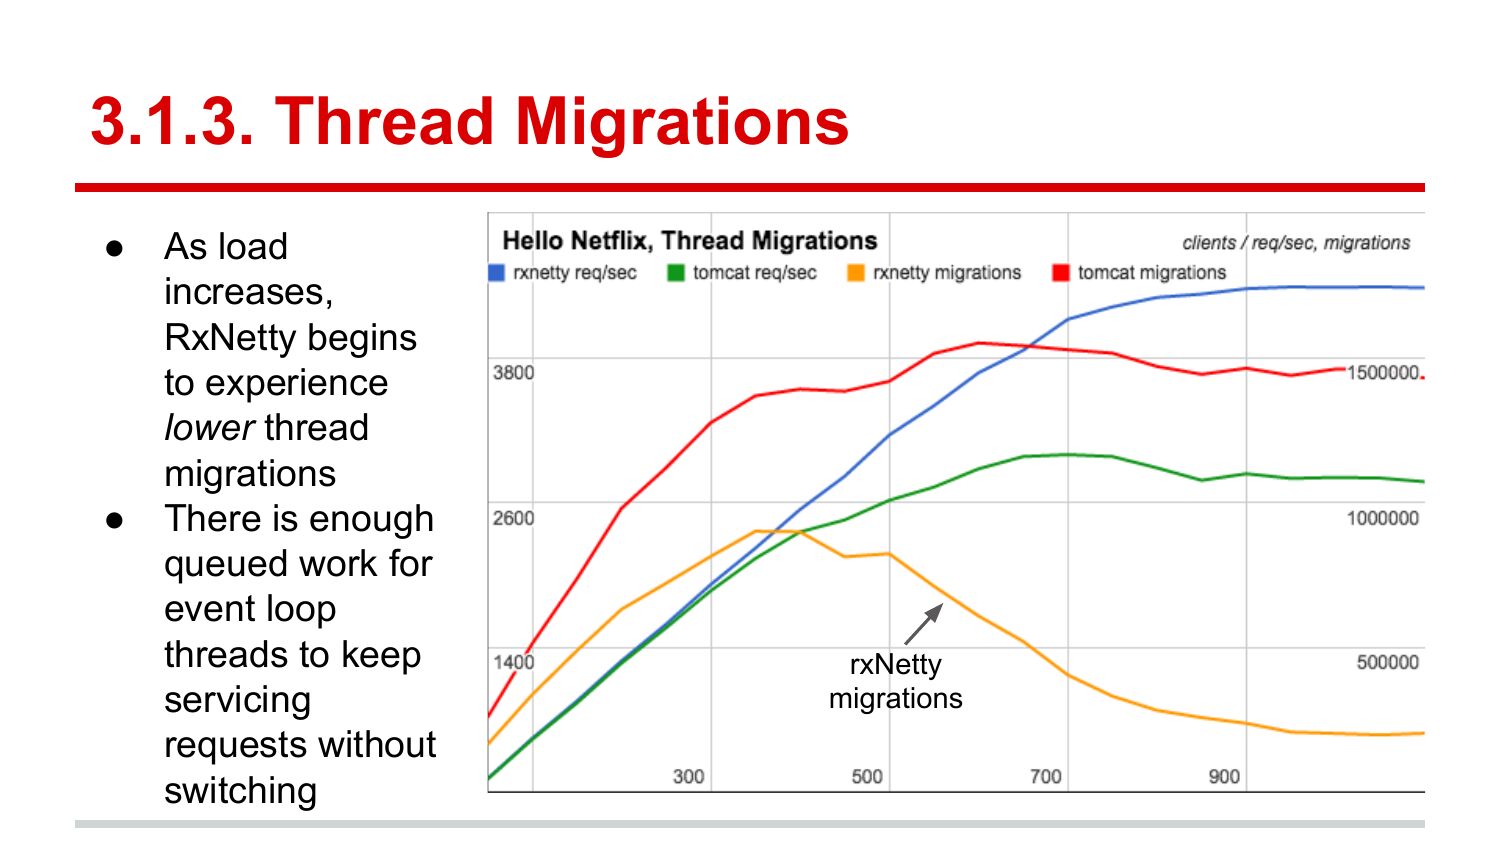
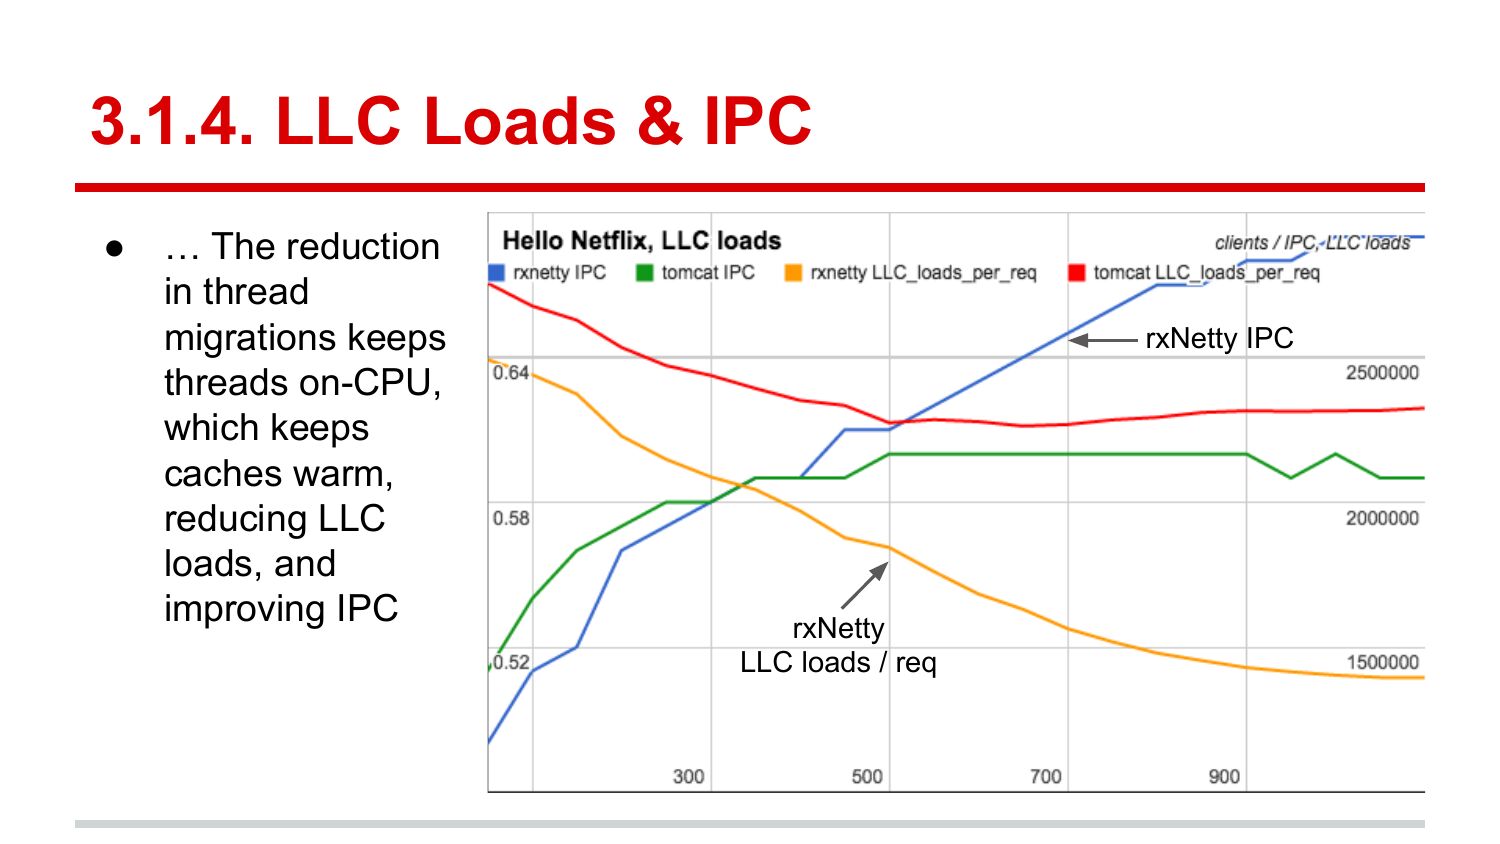
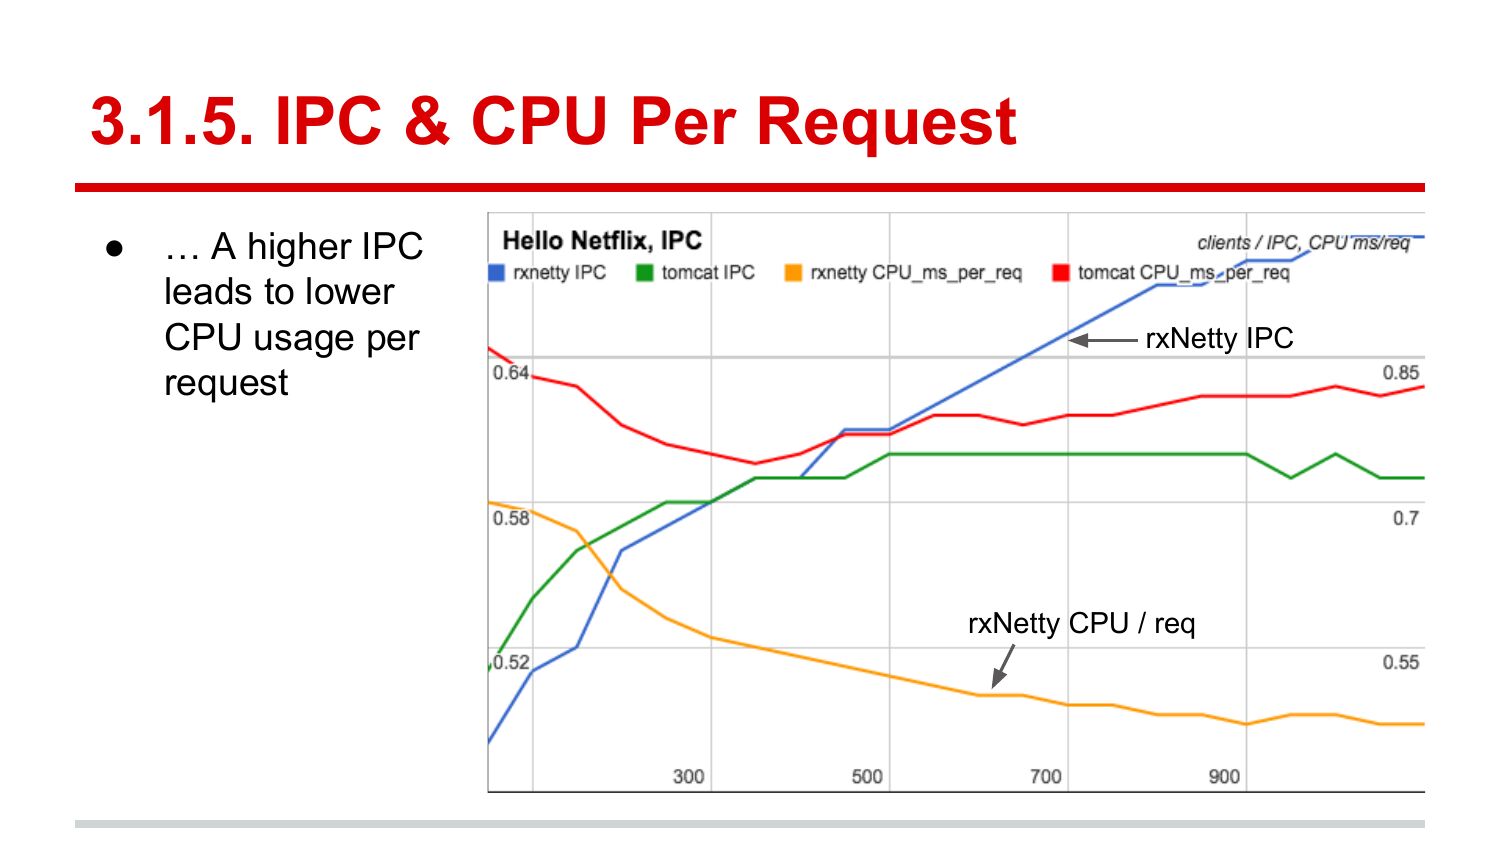
RxNetty also trends lower due to its event loop architecture, which
reduces thread migrations under load, which improves CPU cache
warmth and memory locality, which improves CPU Instructions Per
Cycle (IPC), which lowers CPU cycle consumption per request
2. Lower latencies under load
Tomcat has higher latencies under load due to its thread pool
architecture, which involves thread pool locks (and lock contention)
and thread migrations to service load
slide 16:
3.1. CPU Consumption Per Request
Studied using:
1. Kernel CPU flame graphs
2. User CPU flame graphs
3. Migration rates
4. Last Level Cache (LLC) Loads & IPC
5. IPC & CPU per request
slide 17:
3.1.1. Kernel CPU Flame Graphsslide 18:
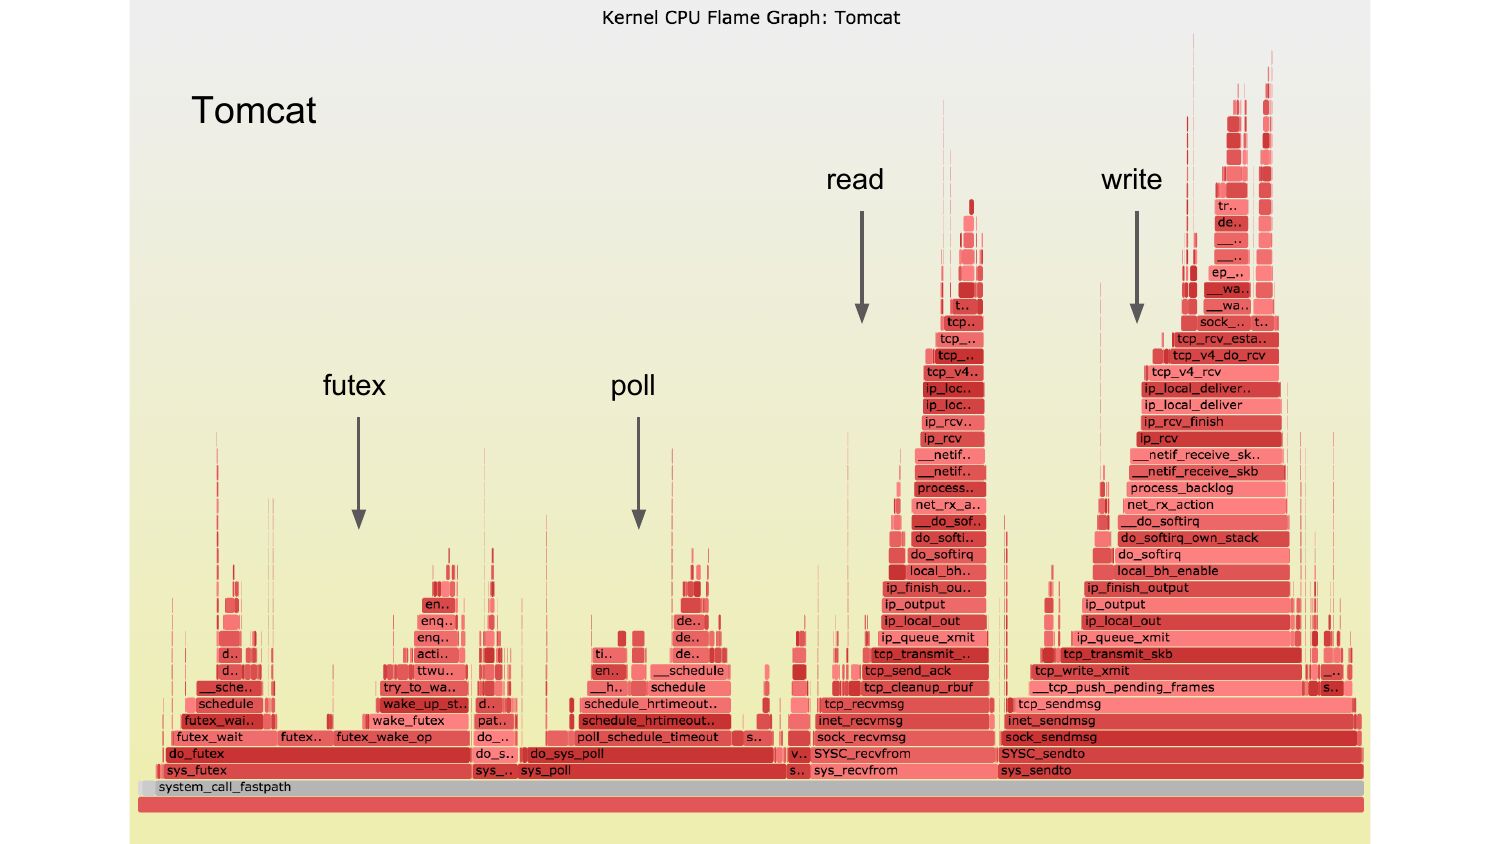
Tomcat
read
futex
poll
write
slide 19:
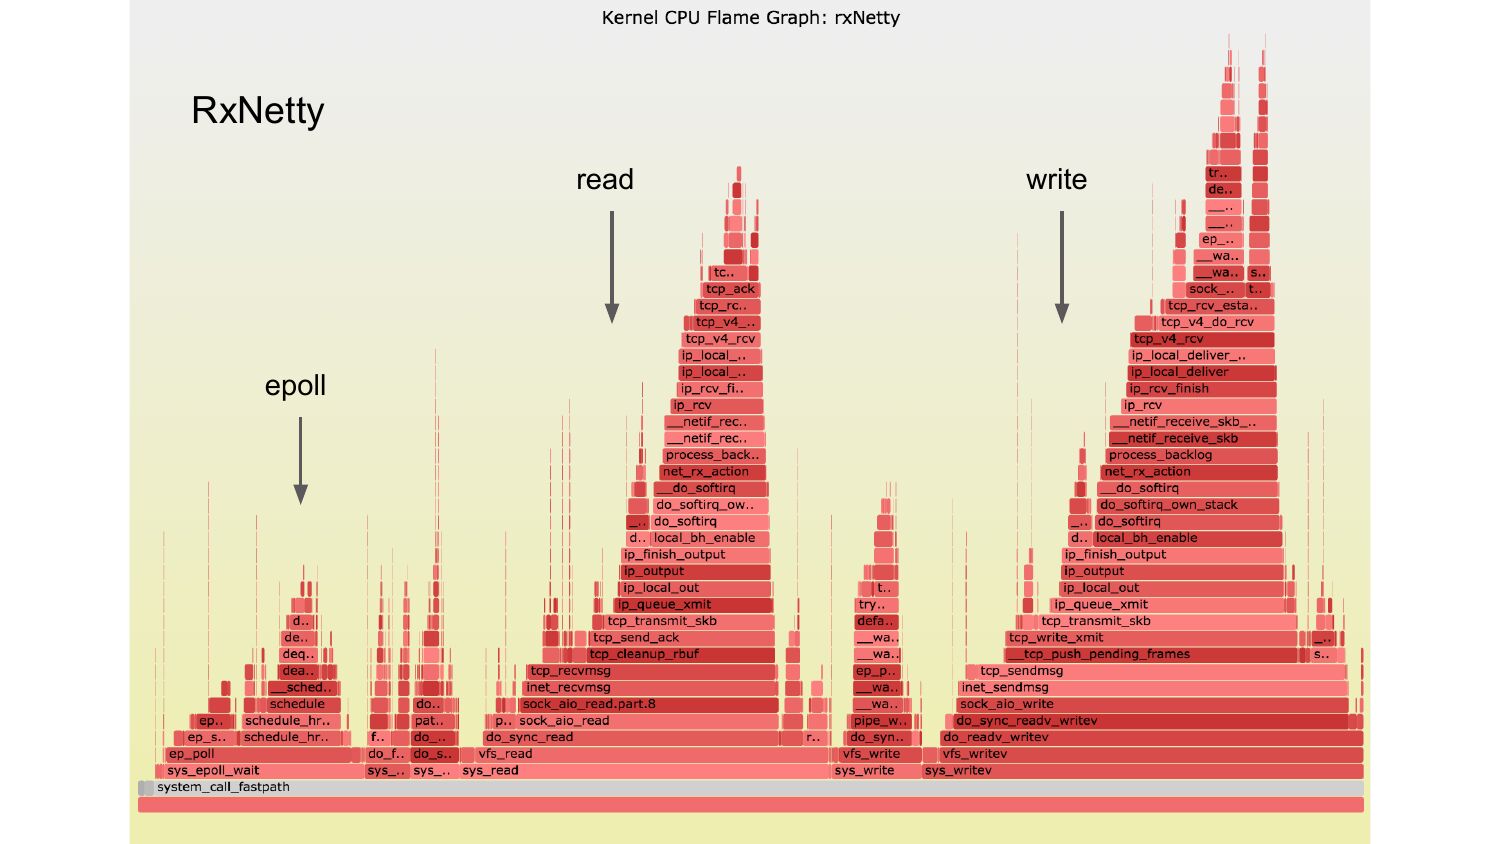
RxNetty
read
epoll
write
slide 20:
3.1.1. Kernel CPU Time Differences
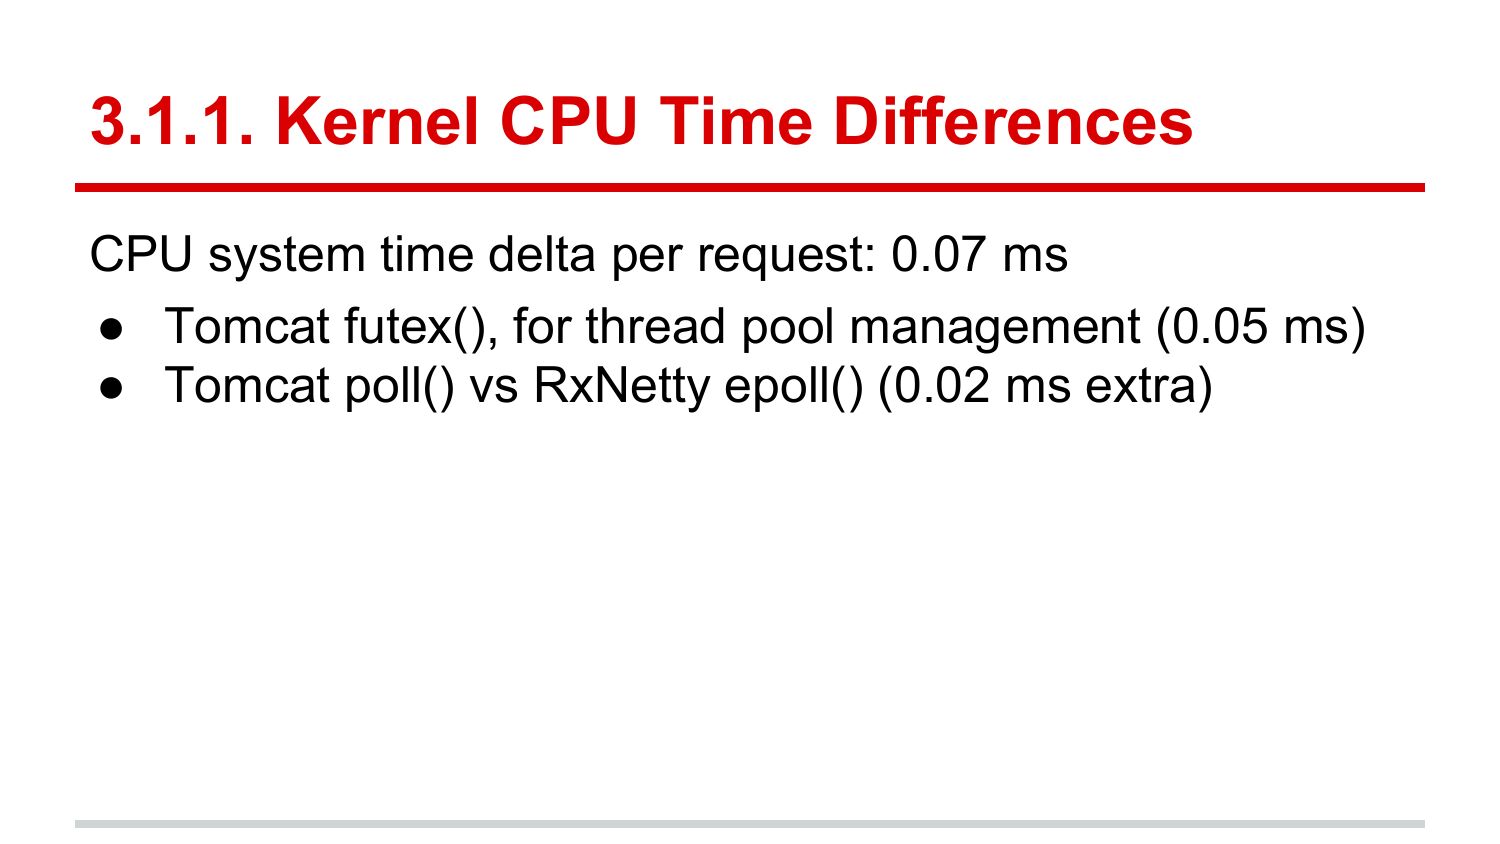
CPU system time delta per request: 0.07 ms
● Tomcat futex(), for thread pool management (0.05 ms)
● Tomcat poll() vs RxNetty epoll() (0.02 ms extra)
slide 21:
3.1.2. User CPU Flame Graphsslide 22:
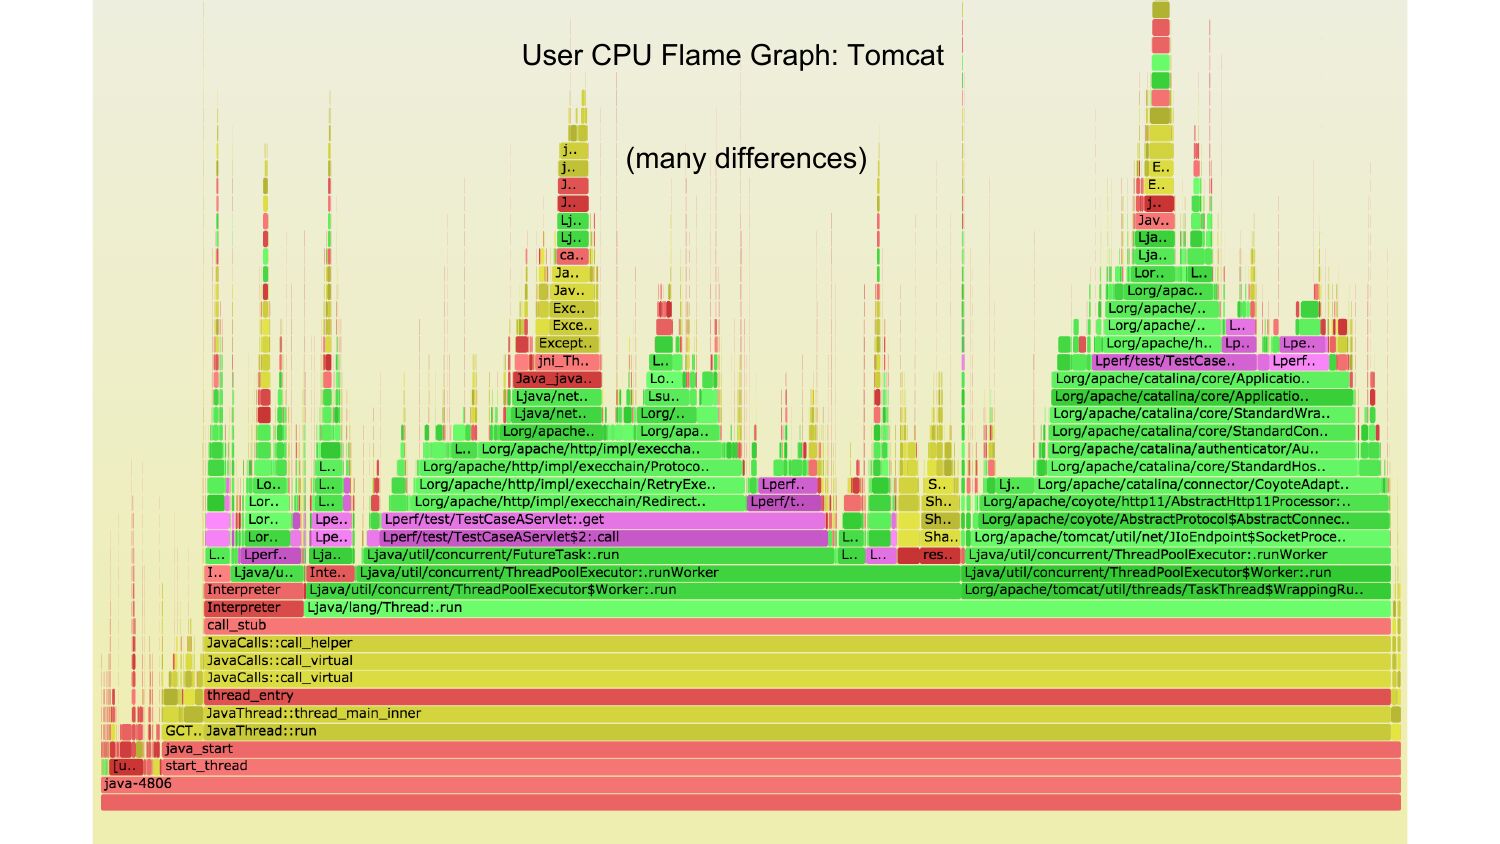
User CPU Flame Graph: Tomcat
(many differences)
slide 23:
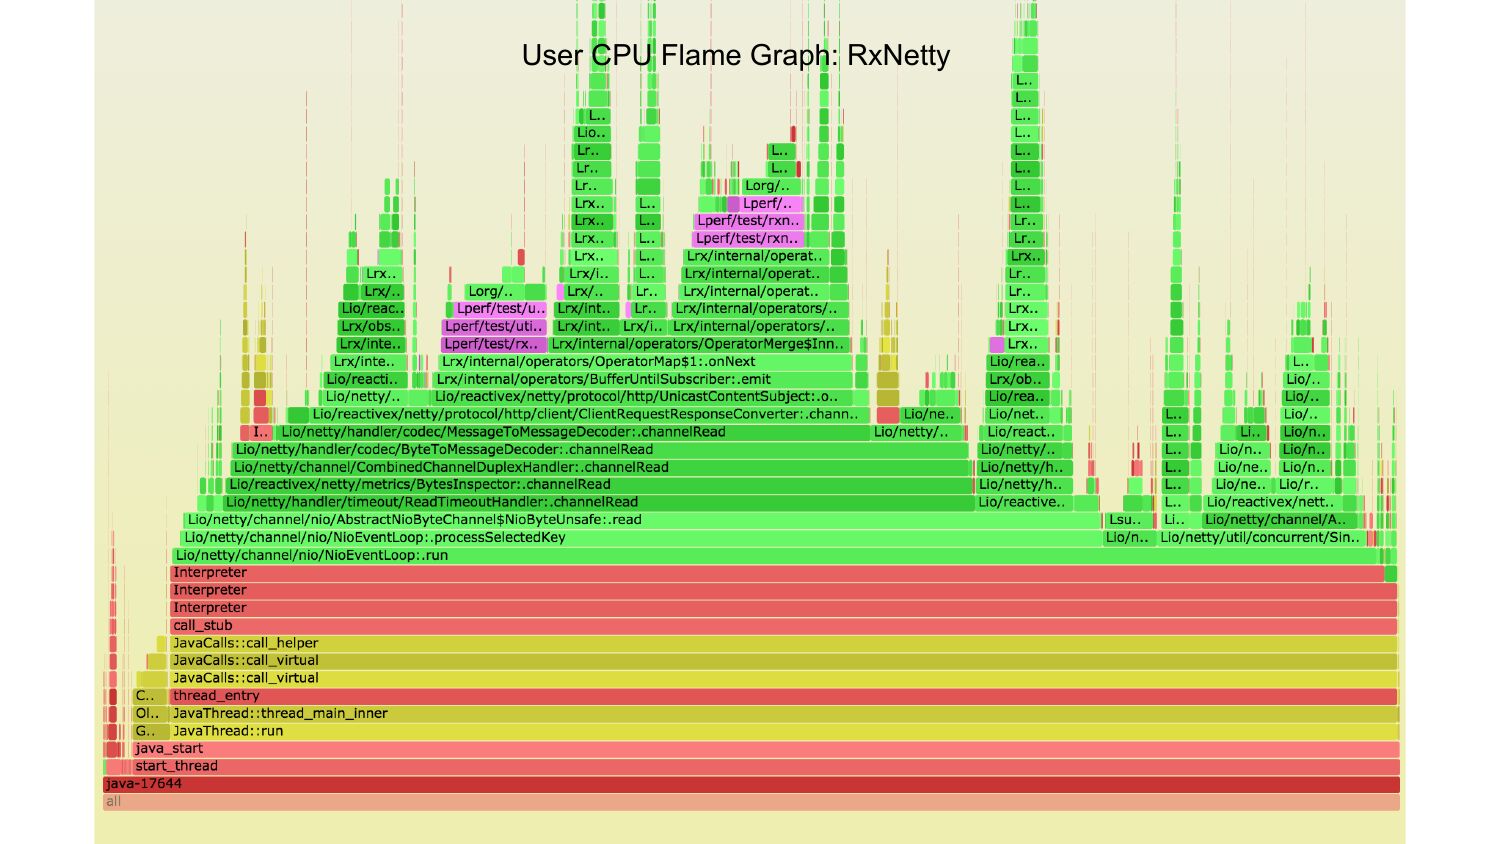
User CPU Flame Graph: RxNettyslide 24:
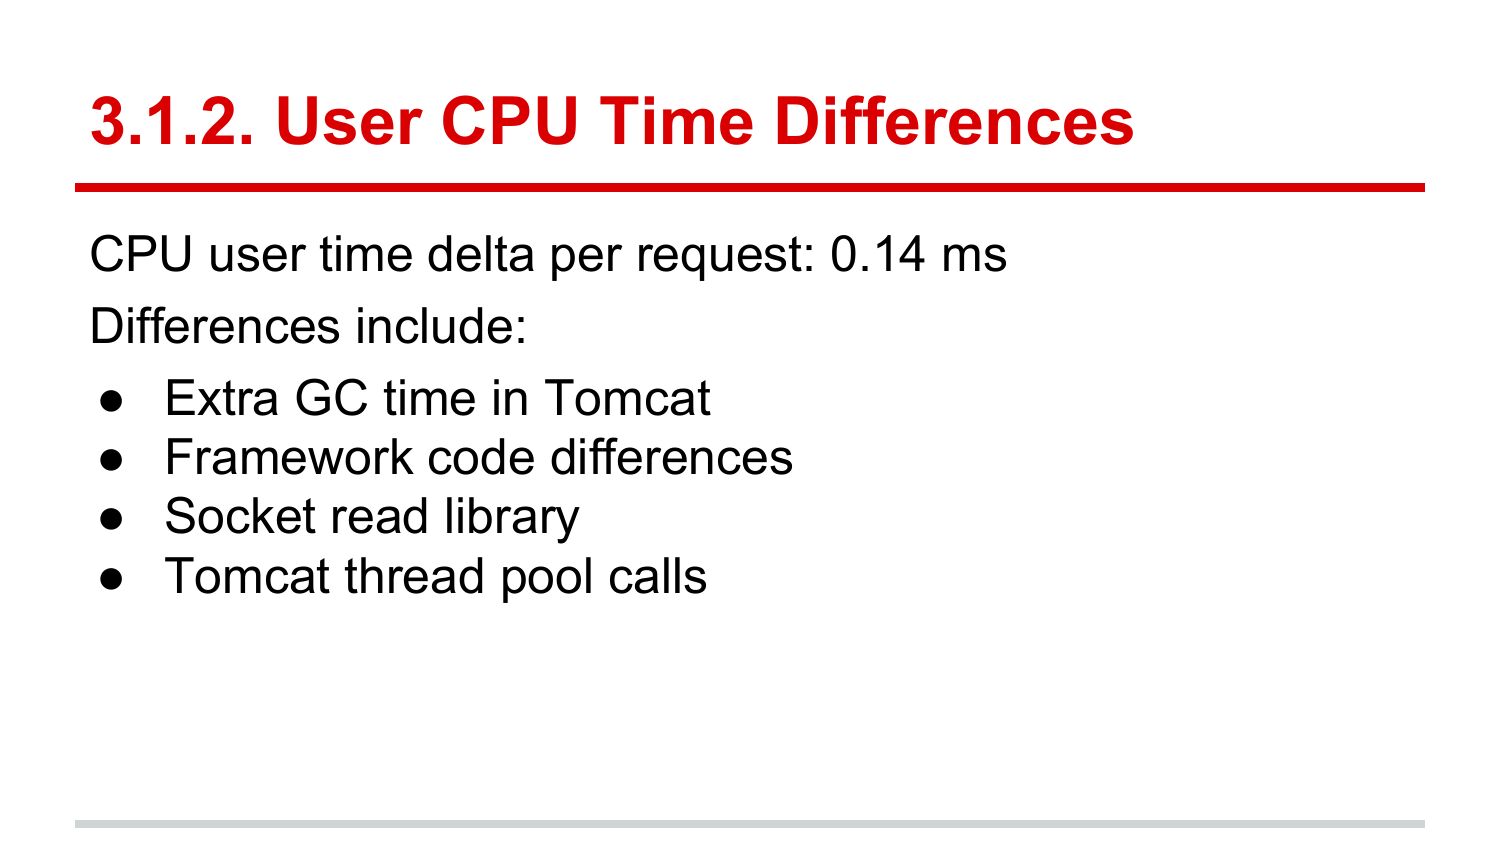
3.1.2. User CPU Time Differences
CPU user time delta per request: 0.14 ms
Differences include:
● Extra GC time in Tomcat
● Framework code differences
● Socket read library
● Tomcat thread pool calls
slide 25:
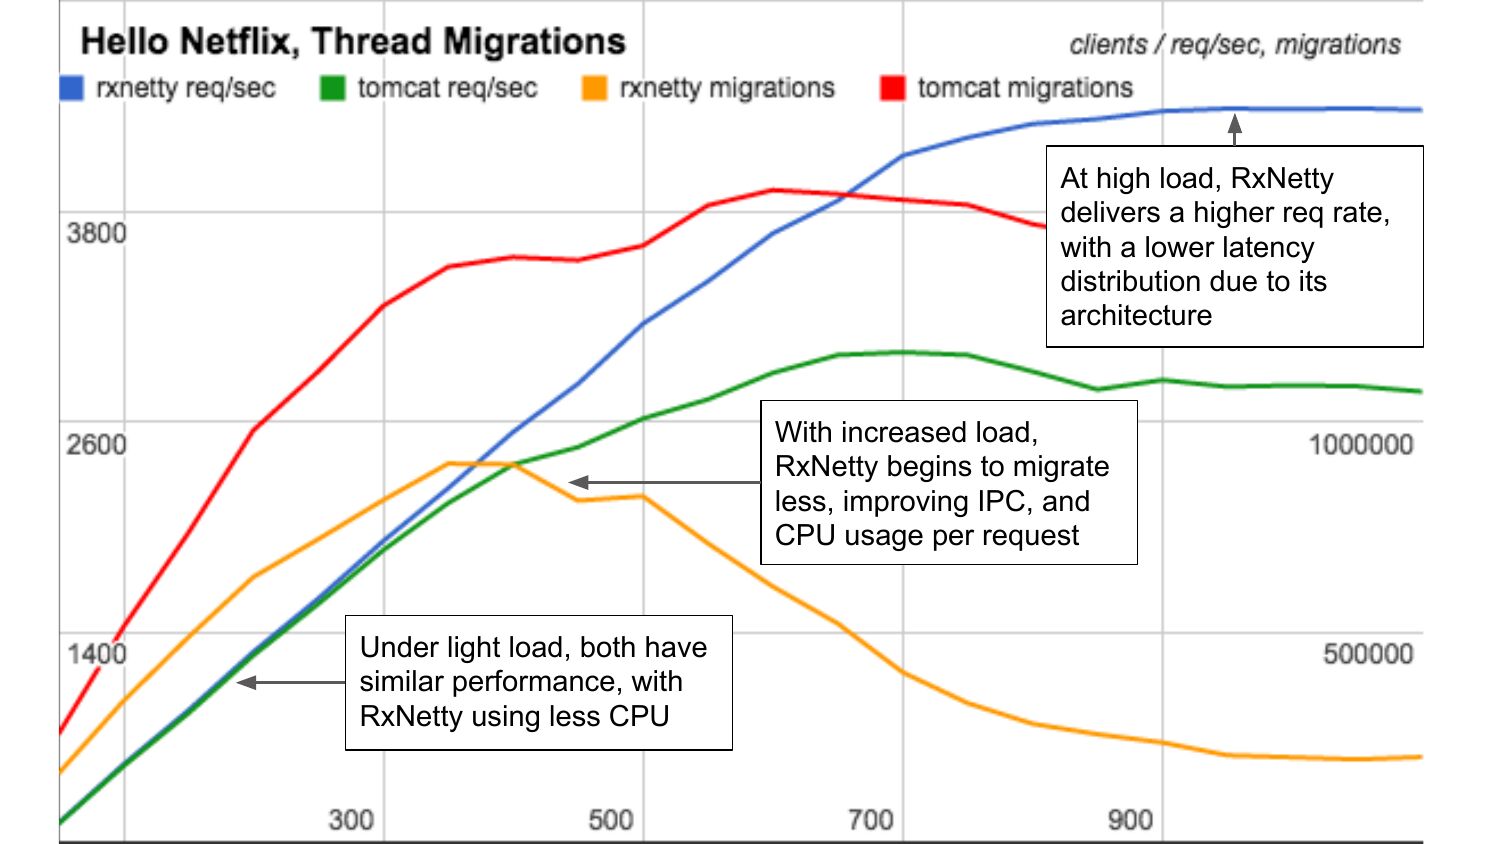
3.1.3. Thread Migrations
As load
increases,
RxNetty begins
to experience
lower thread
migrations
There is enough
queued work for
event loop
threads to keep
servicing
requests without
switching
rxNetty
migrations
slide 26:
3.1.4. LLC Loads & IPC
… The reduction
in thread
migrations keeps
threads on-CPU,
which keeps
caches warm,
reducing LLC
loads, and
improving IPC
rxNetty IPC
rxNetty
LLC loads / req
slide 27:
3.1.5. IPC & CPU Per Request
… A higher IPC
leads to lower
CPU usage per
request
rxNetty IPC
rxNetty CPU / req
slide 28:
3.2. Lower Latencies Under Load
Studied using:
1. Migration rates (previous graph)
2. Context-switch flame graphs
3. Chain graphs
slide 29:
3.2.2. Context Switch Flame Graphs
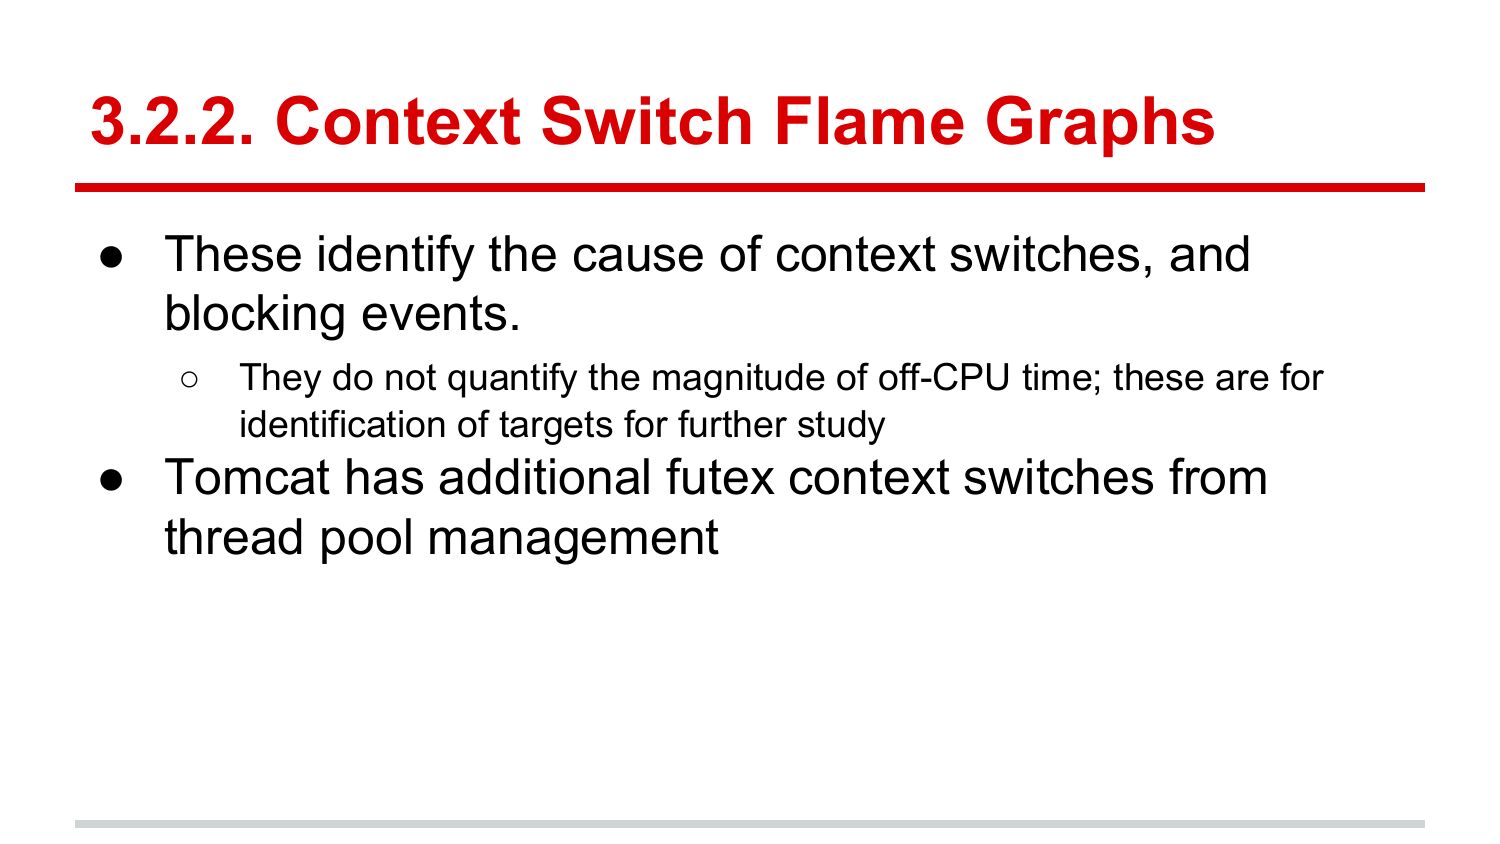
● These identify the cause of context switches, and
blocking events.
They do not quantify the magnitude of off-CPU time; these are for
identification of targets for further study
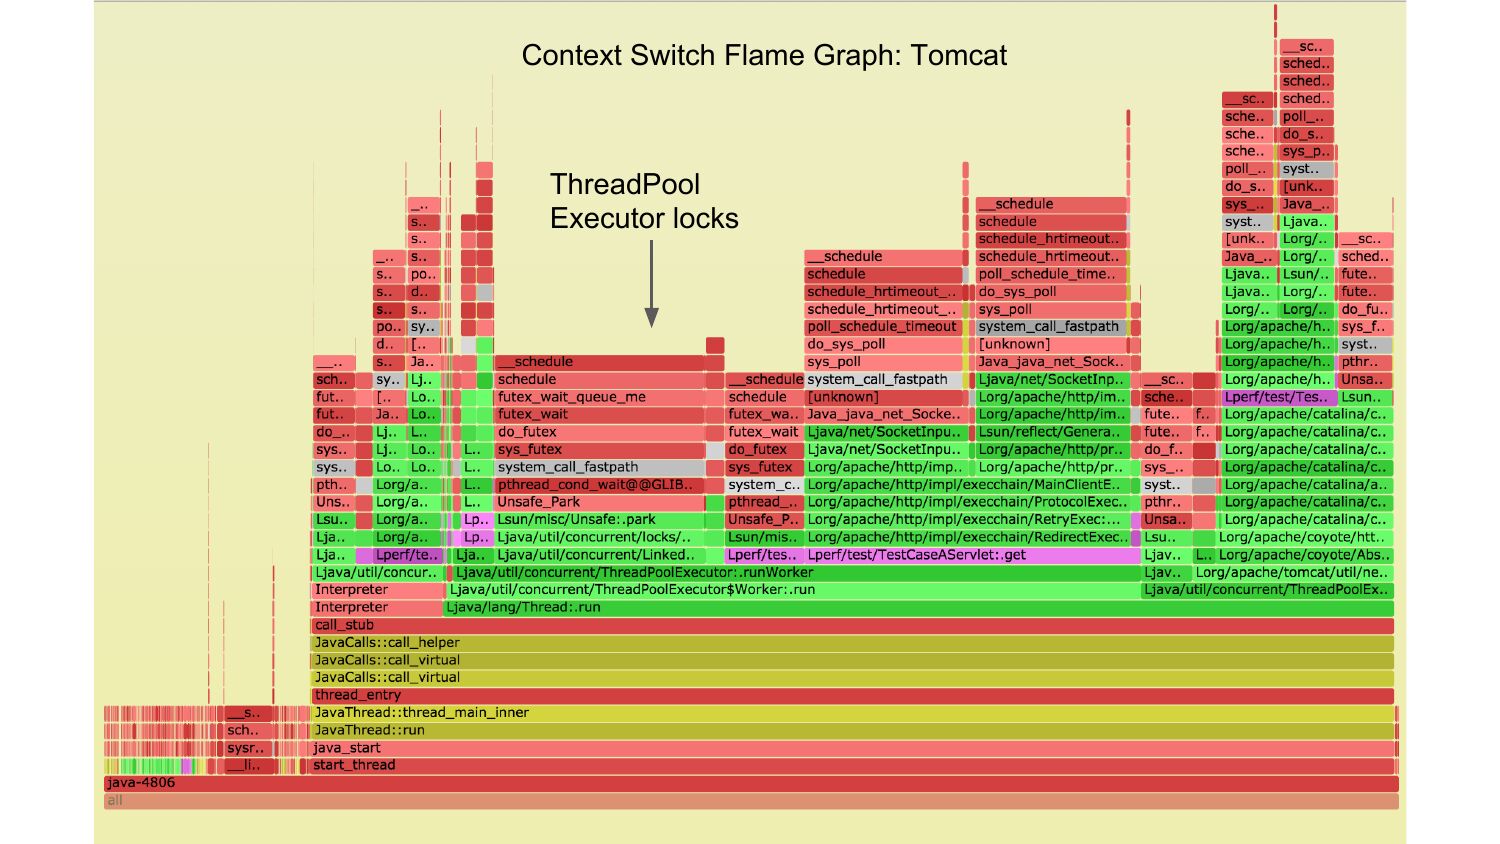
● Tomcat has additional futex context switches from
thread pool management
slide 30:
Context Switch Flame Graph: Tomcat
ThreadPool
Executor locks
slide 31:
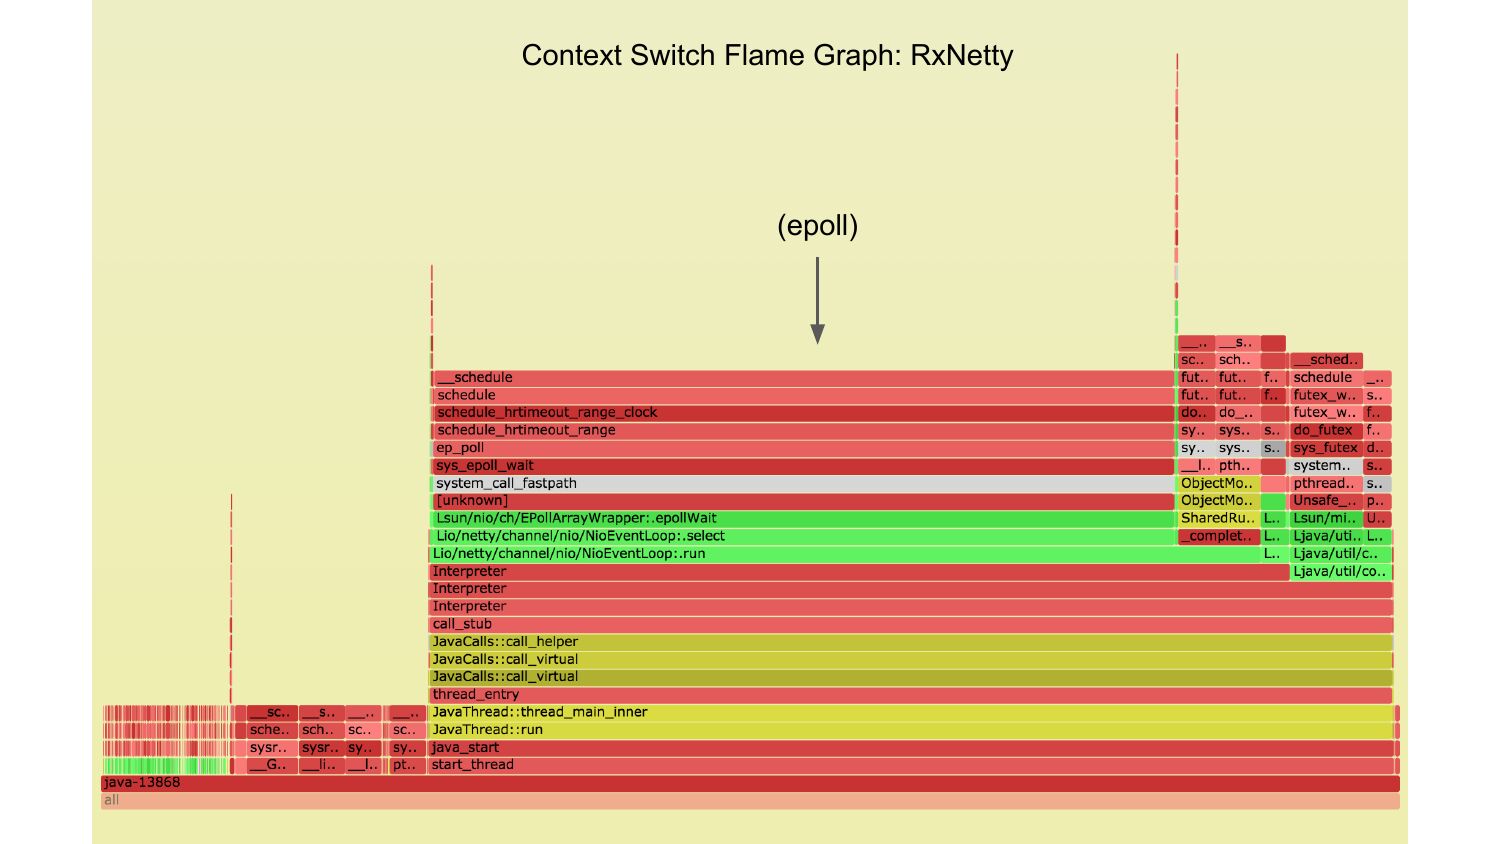
Context Switch Flame Graph: RxNetty
(epoll)
slide 32:
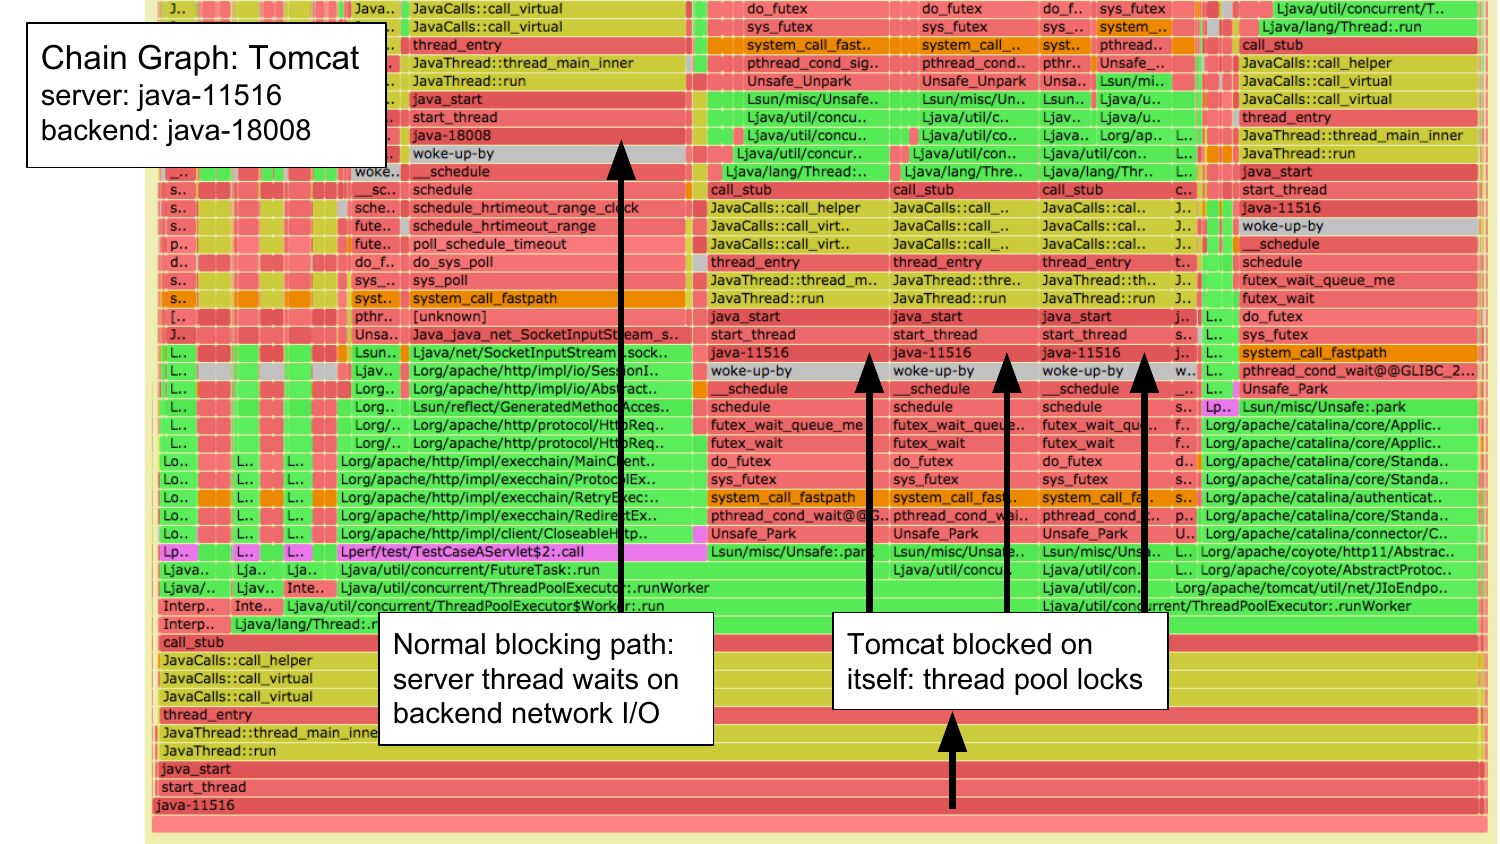
3.2.3. Chain Graphs
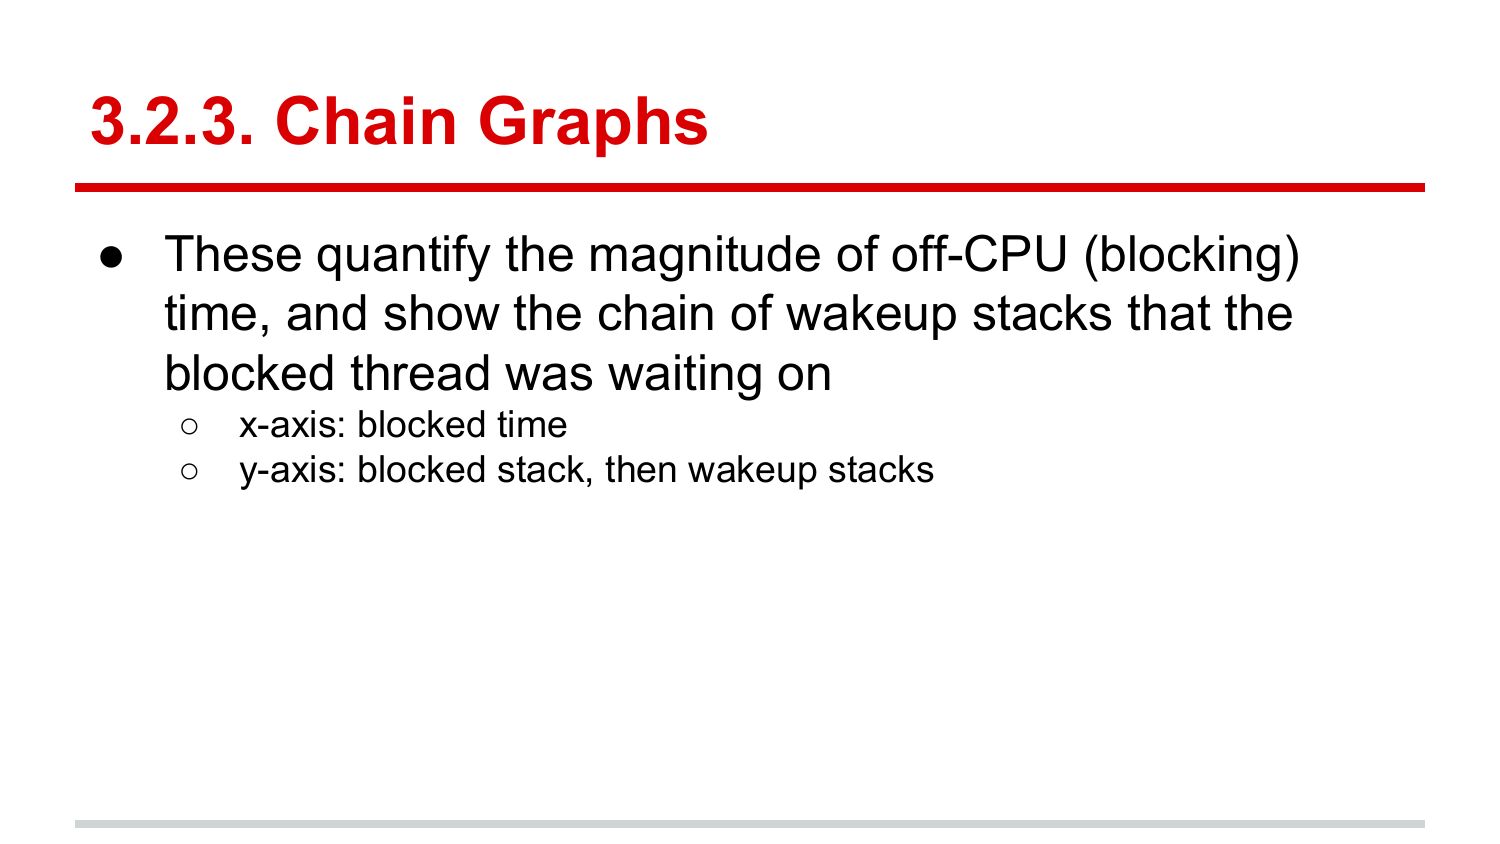
● These quantify the magnitude of off-CPU (blocking)
time, and show the chain of wakeup stacks that the
blocked thread was waiting on
x-axis: blocked time
y-axis: blocked stack, then wakeup stacks
slide 33:
Chain Graph: Tomcat
Chain Graph: Tomcat
server: java-11516
backend: java-18008
XXX
Normal blocking path:
server thread waits on
backend network I/O
Tomcat blocked on
itself: thread pool locks
slide 34:
Reasoning
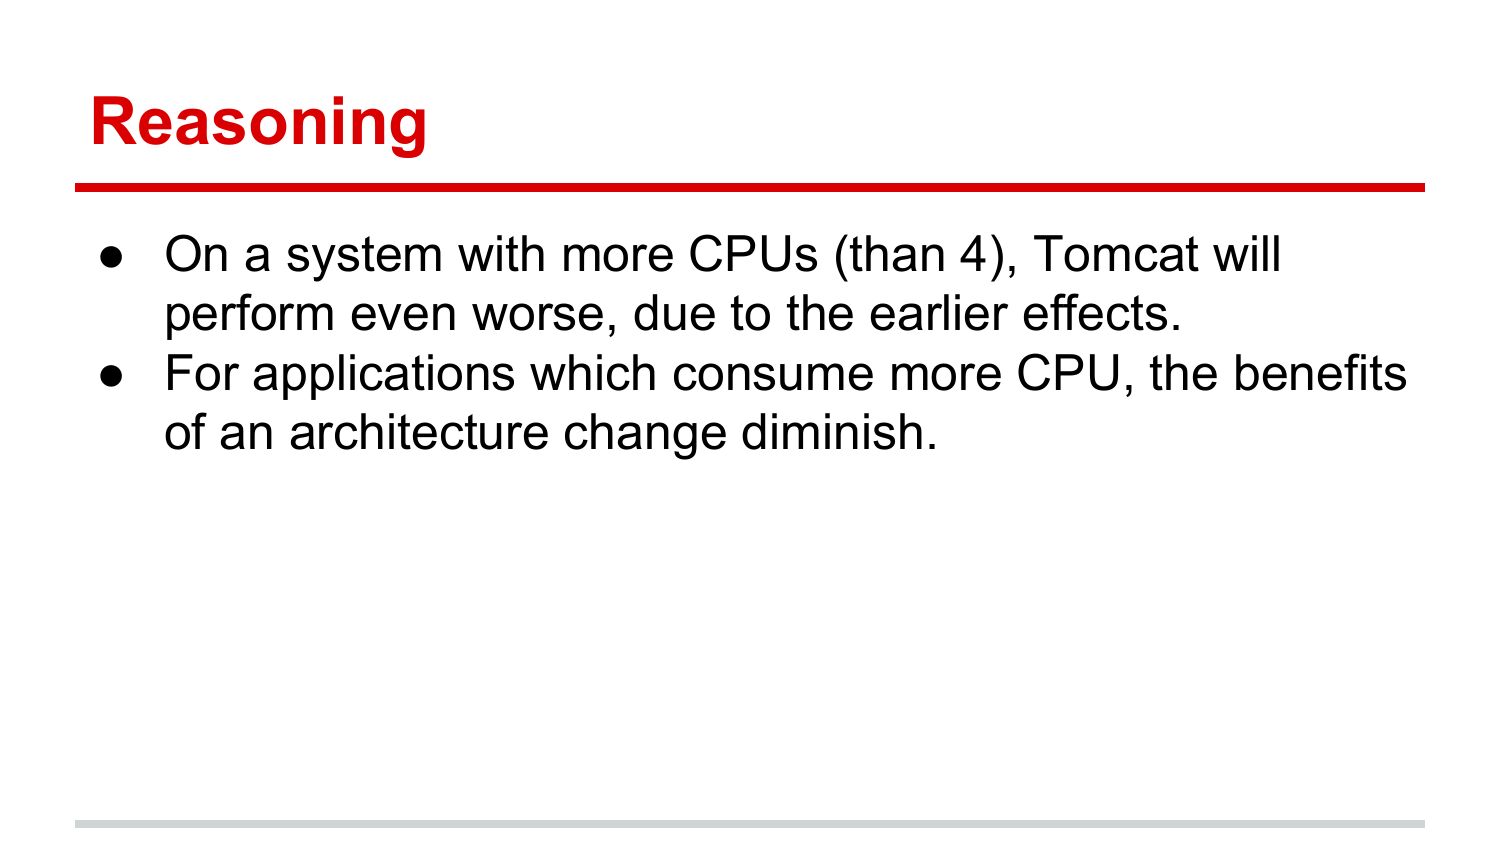
● On a system with more CPUs (than 4), Tomcat will
perform even worse, due to the earlier effects.
● For applications which consume more CPU, the benefits
of an architecture change diminish.
slide 35:
Summaryslide 36:
At high load, RxNetty
delivers a higher req rate,
with a lower latency
distribution due to its
architecture
With increased load,
RxNetty begins to migrate
less, improving IPC, and
CPU usage per request
Under light load, both have
similar performance, with
RxNetty using less CPU
