SF meetup 2013: The New Systems Performance
A brief talk on systems performance for the July 2013 meetup "A Midsummer Night's System" by Brendan Gregg.Video: http://www.youtube.com/watch?v=P3SGzykDE4Q
Description: "This summarizes how systems performance has changed from the 1990's to today. This was the reason for writing a new book on systems performance, to provide a reference that is up to date, covering new tools, technologies, and methodologies."
| next prev 1/17 | |
| next prev 2/17 | |
| next prev 3/17 | |
| next prev 4/17 | |
| next prev 5/17 | |
| next prev 6/17 | |
| next prev 7/17 | |
| next prev 8/17 | |
| next prev 9/17 | |
| next prev 10/17 | |
| next prev 11/17 | |
| next prev 12/17 | |
| next prev 13/17 | |
| next prev 14/17 | |
| next prev 15/17 | |
| next prev 16/17 | |
| next prev 17/17 |
PDF: TheNewSystemsPerformance.pdf
Keywords (from pdftotext):
slide 1:
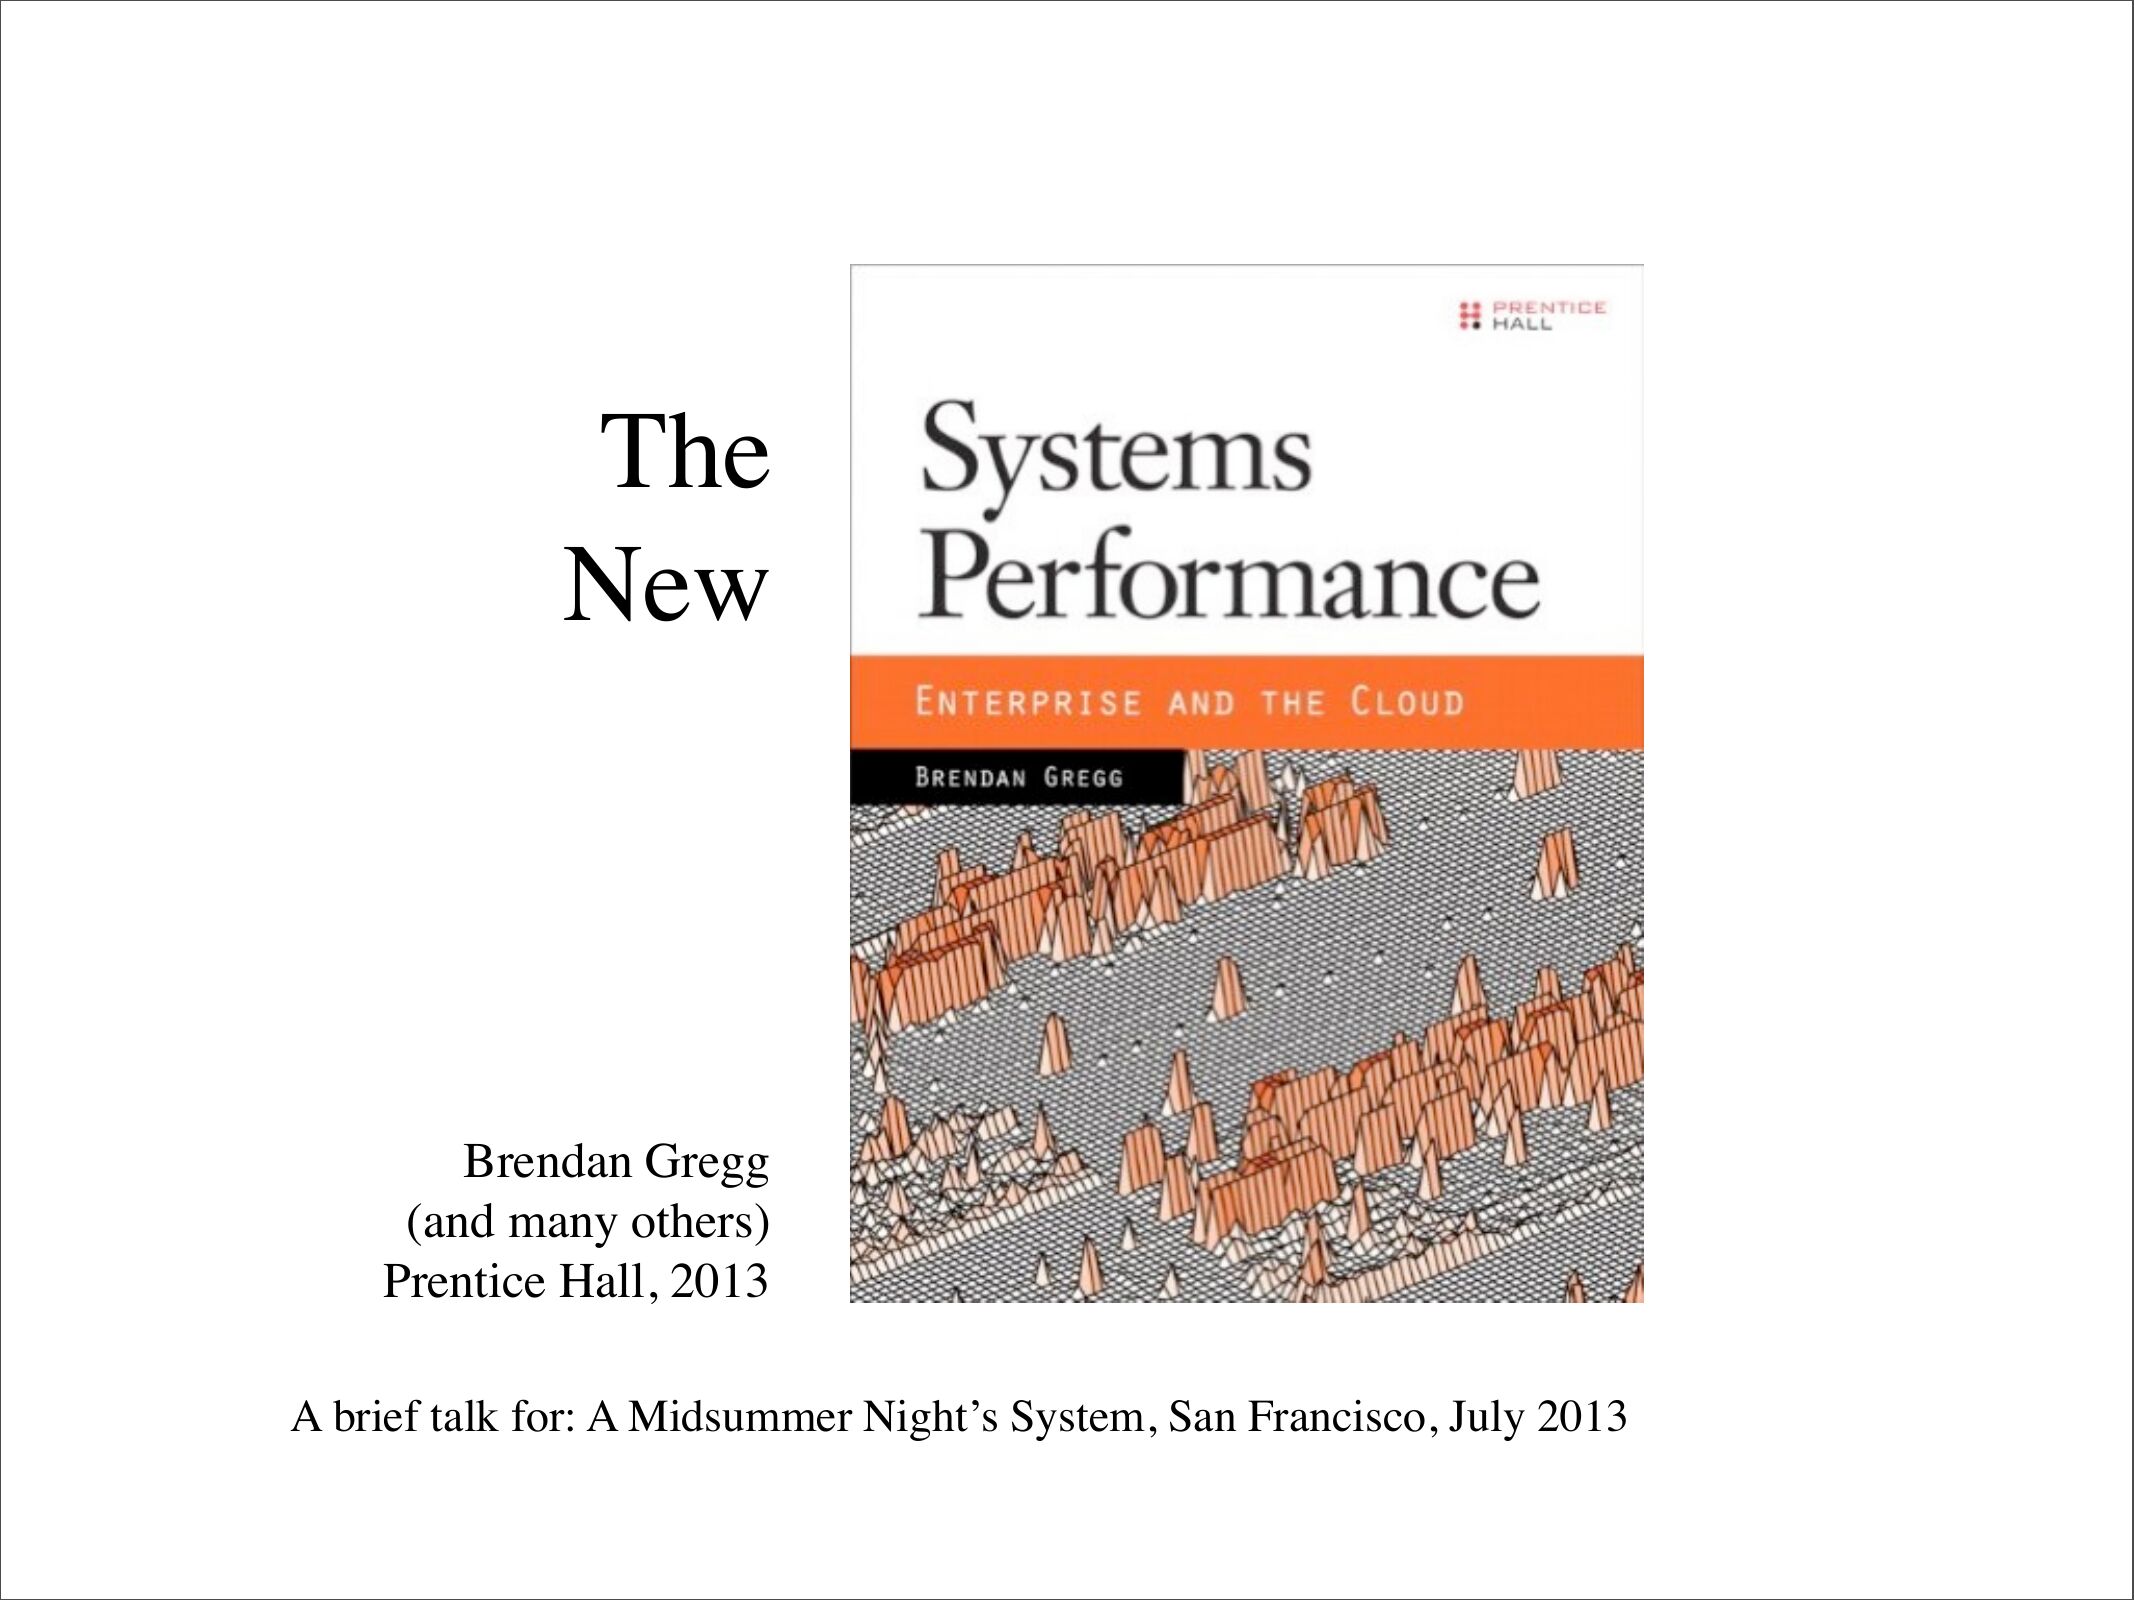
The
New
Brendan Gregg
(and many others)
Prentice Hall, 2013
A brief talk for: A Midsummer Night’s System, San Francisco, July 2013
slide 2:
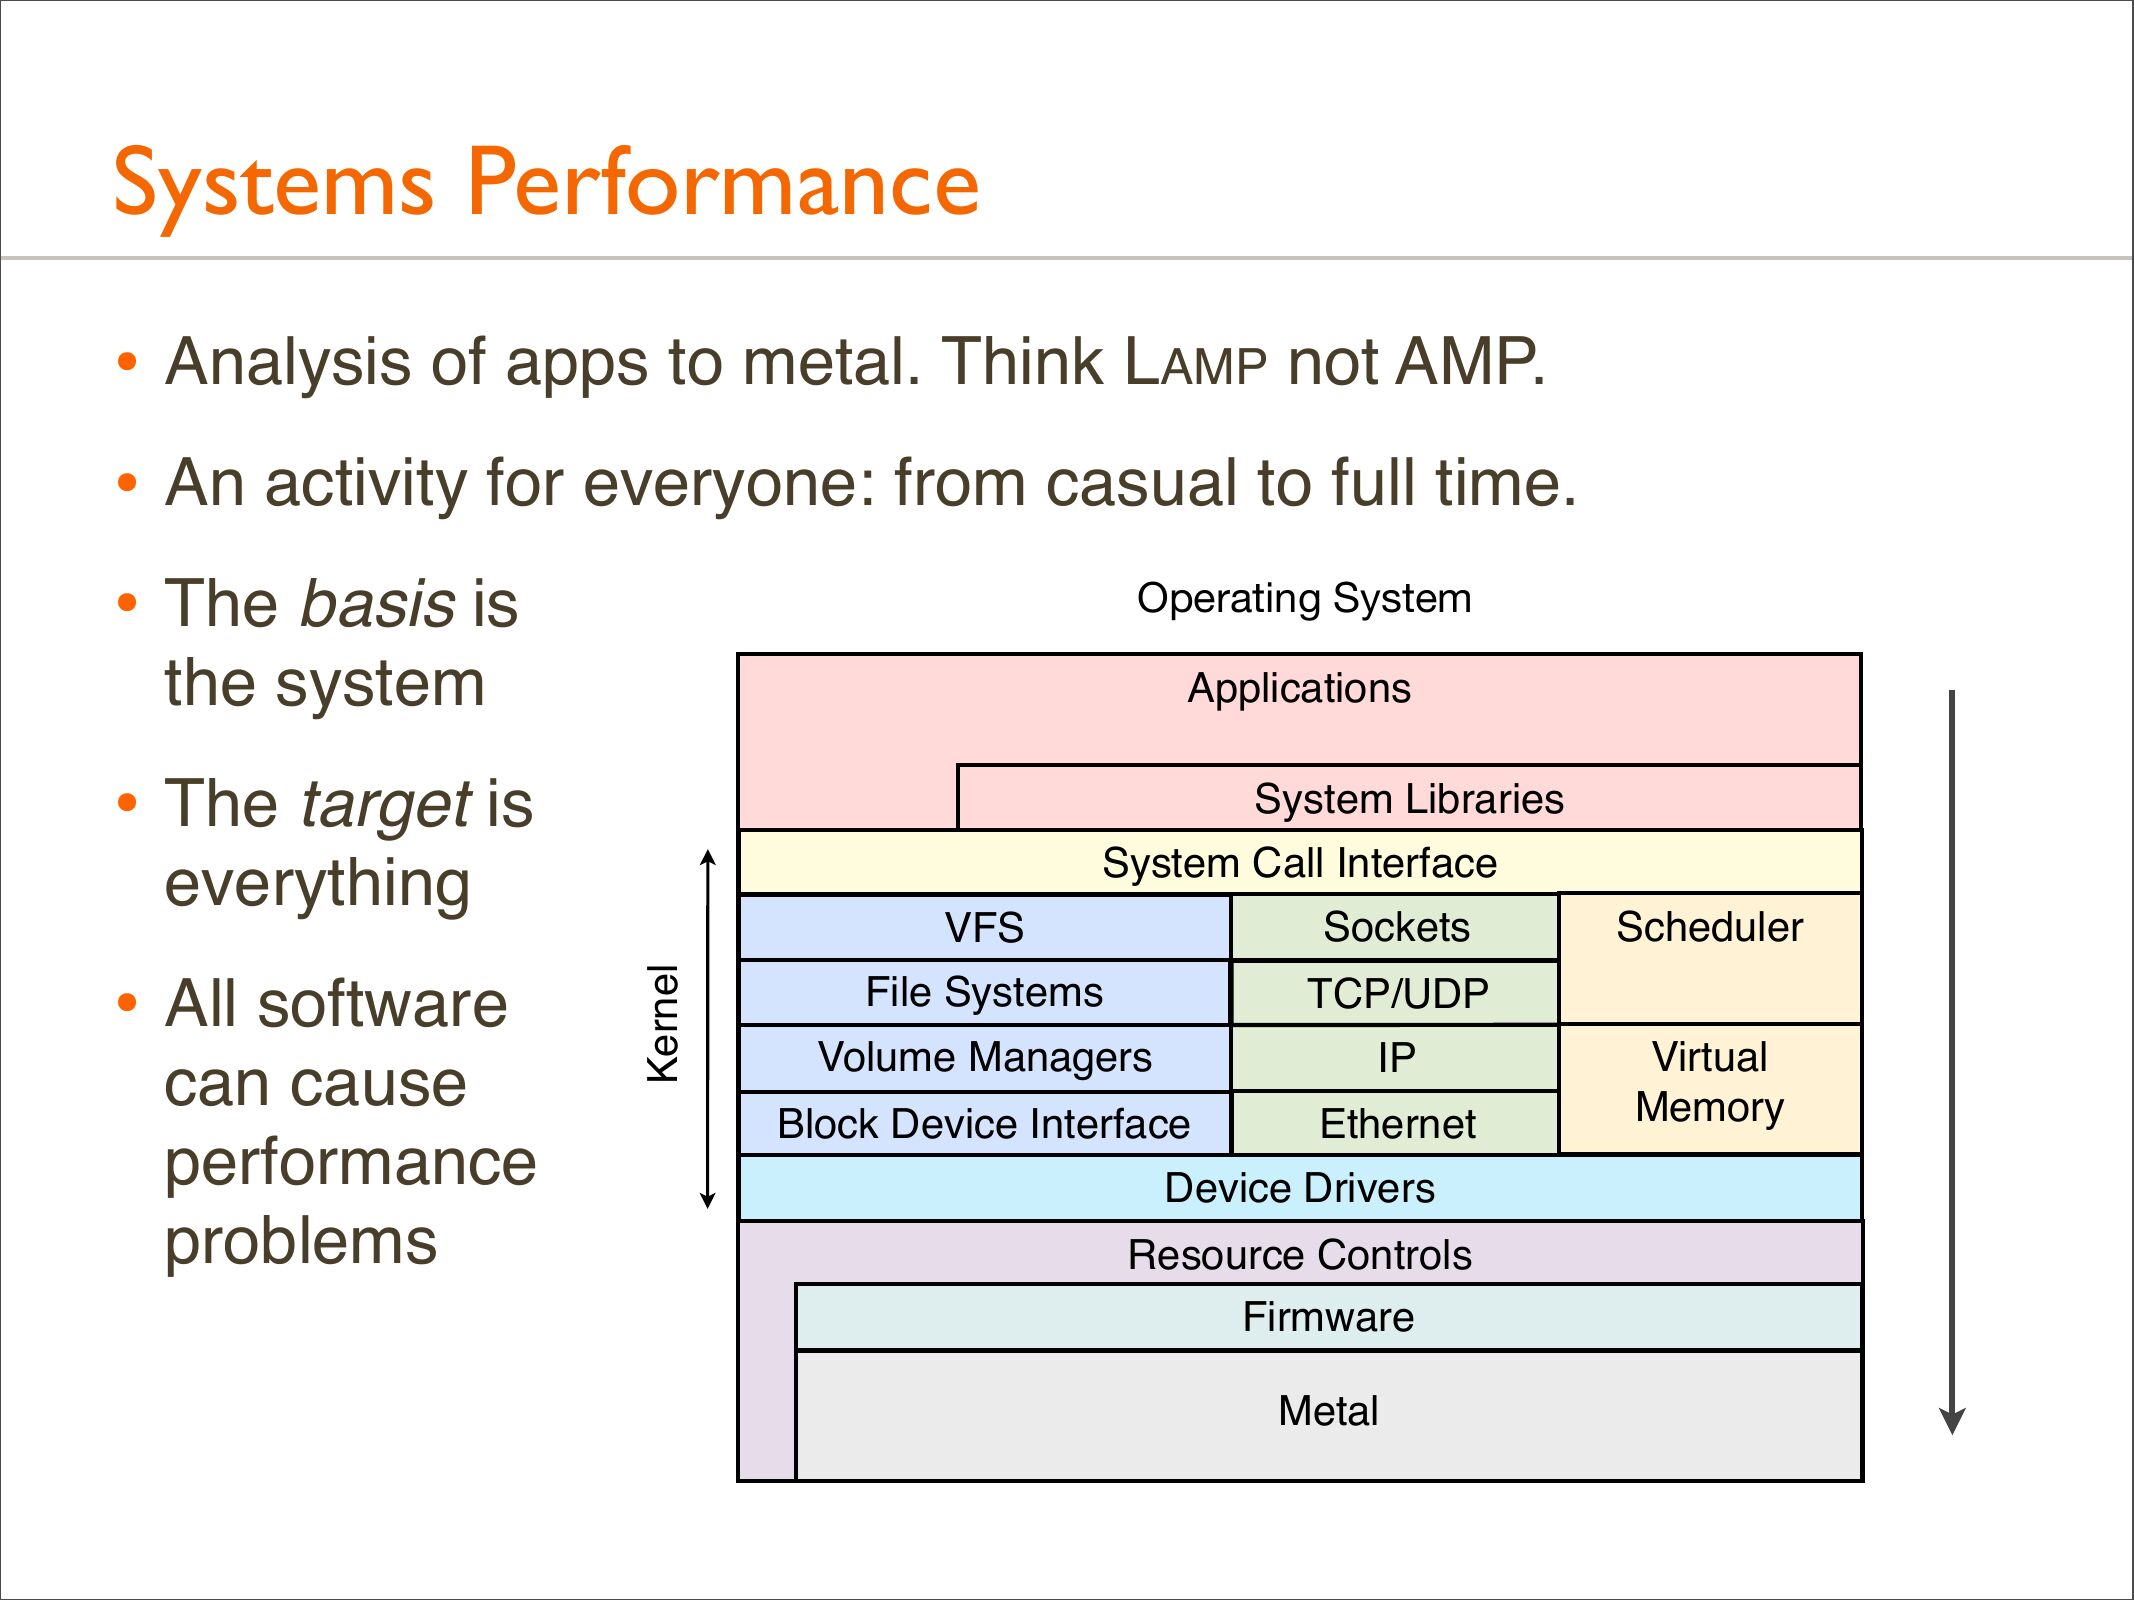
Systems Performance
• Analysis of apps to metal. Think LAMP not AMP.
• An activity for everyone: from casual to full time.
Operating System
• The basis is
the system
Applications
• The target is
System Libraries
System Call Interface
• All software
can cause
performance
problems
Kernel
everything
VFS
Sockets
File Systems
TCP/UDP
Volume Managers
Block Device Interface
Ethernet
Device Drivers
Resource Controls
Firmware
Metal
Scheduler
Virtual
Memory
slide 3:
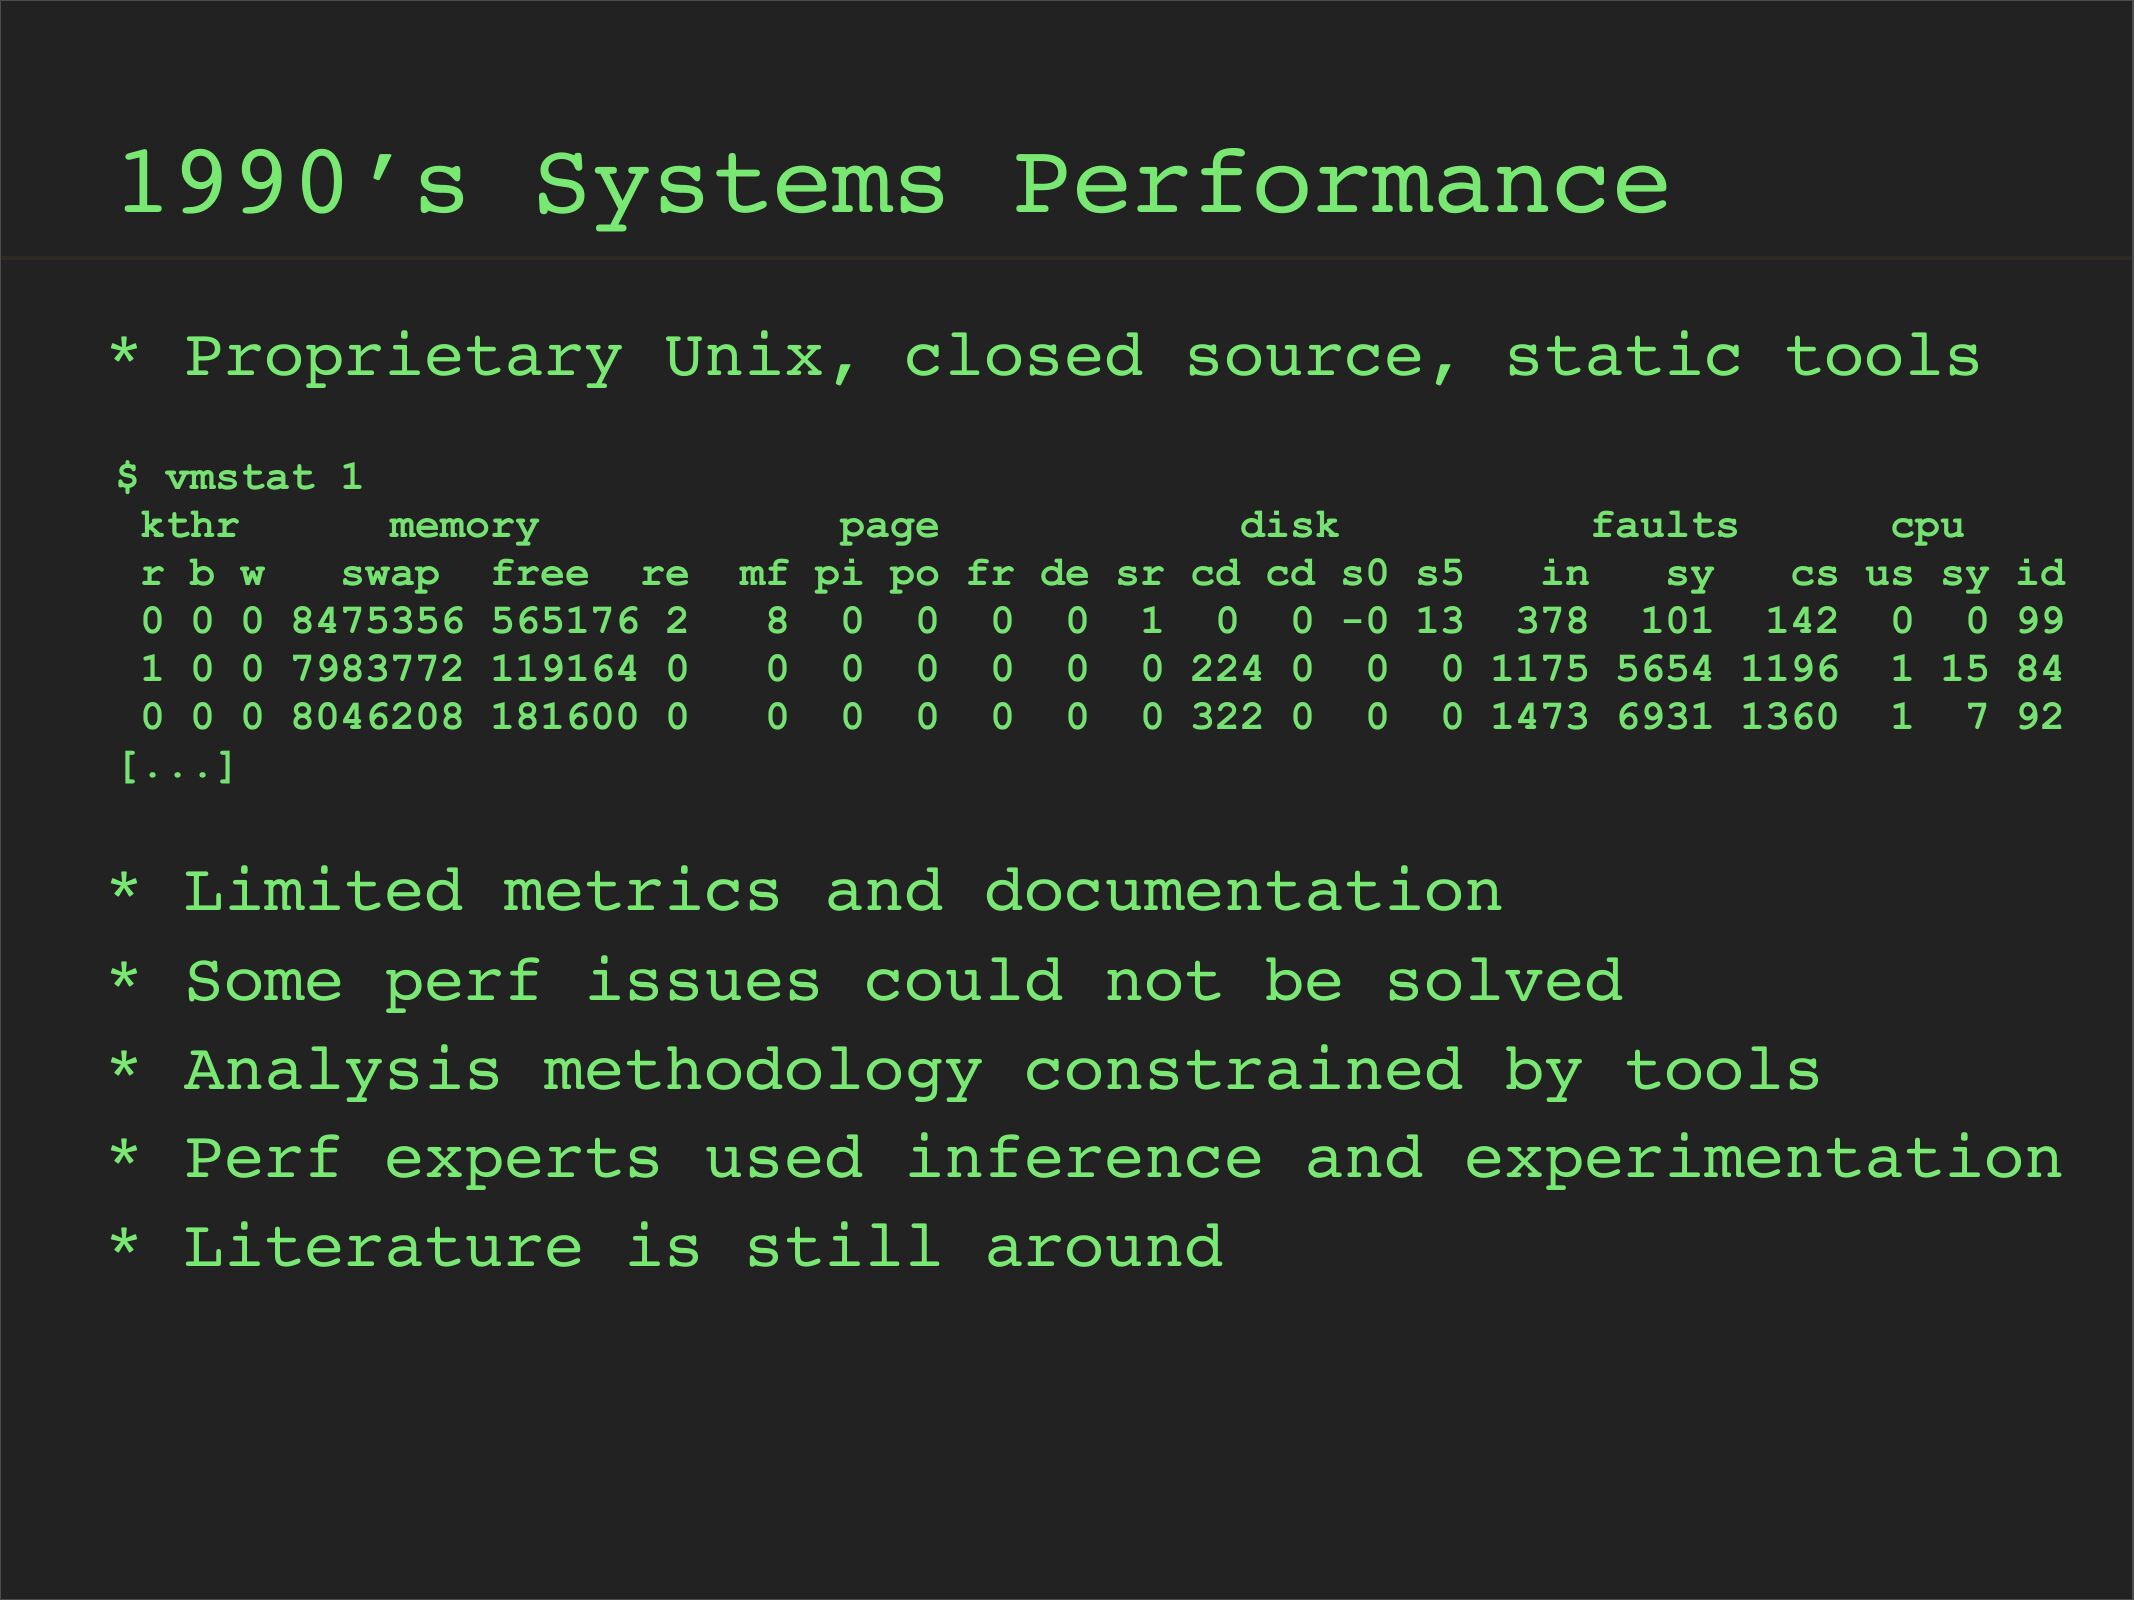
1990’s Systems Performance
* Proprietary Unix, closed source, static tools
$ vmstat 1
kthr
memory
r b w
swap free re
0 0 0 8475356 565176 2
1 0 0 7983772 119164 0
0 0 0 8046208 181600 0
[...]
page
disk
faults
cpu
mf pi po fr de sr cd cd s0 s5
cs us sy id
8 0 0 0 0 1 0 0 -0 13 378 101 142 0 0 99
0 0 0 0 0 0 224 0 0 0 1175 5654 1196 1 15 84
0 0 0 0 0 0 322 0 0 0 1473 6931 1360 1 7 92
* Limited metrics and documentation
* Some perf issues could not be solved
* Analysis methodology constrained by tools
* Perf experts used inference and experimentation
* Literature is still around
slide 4:
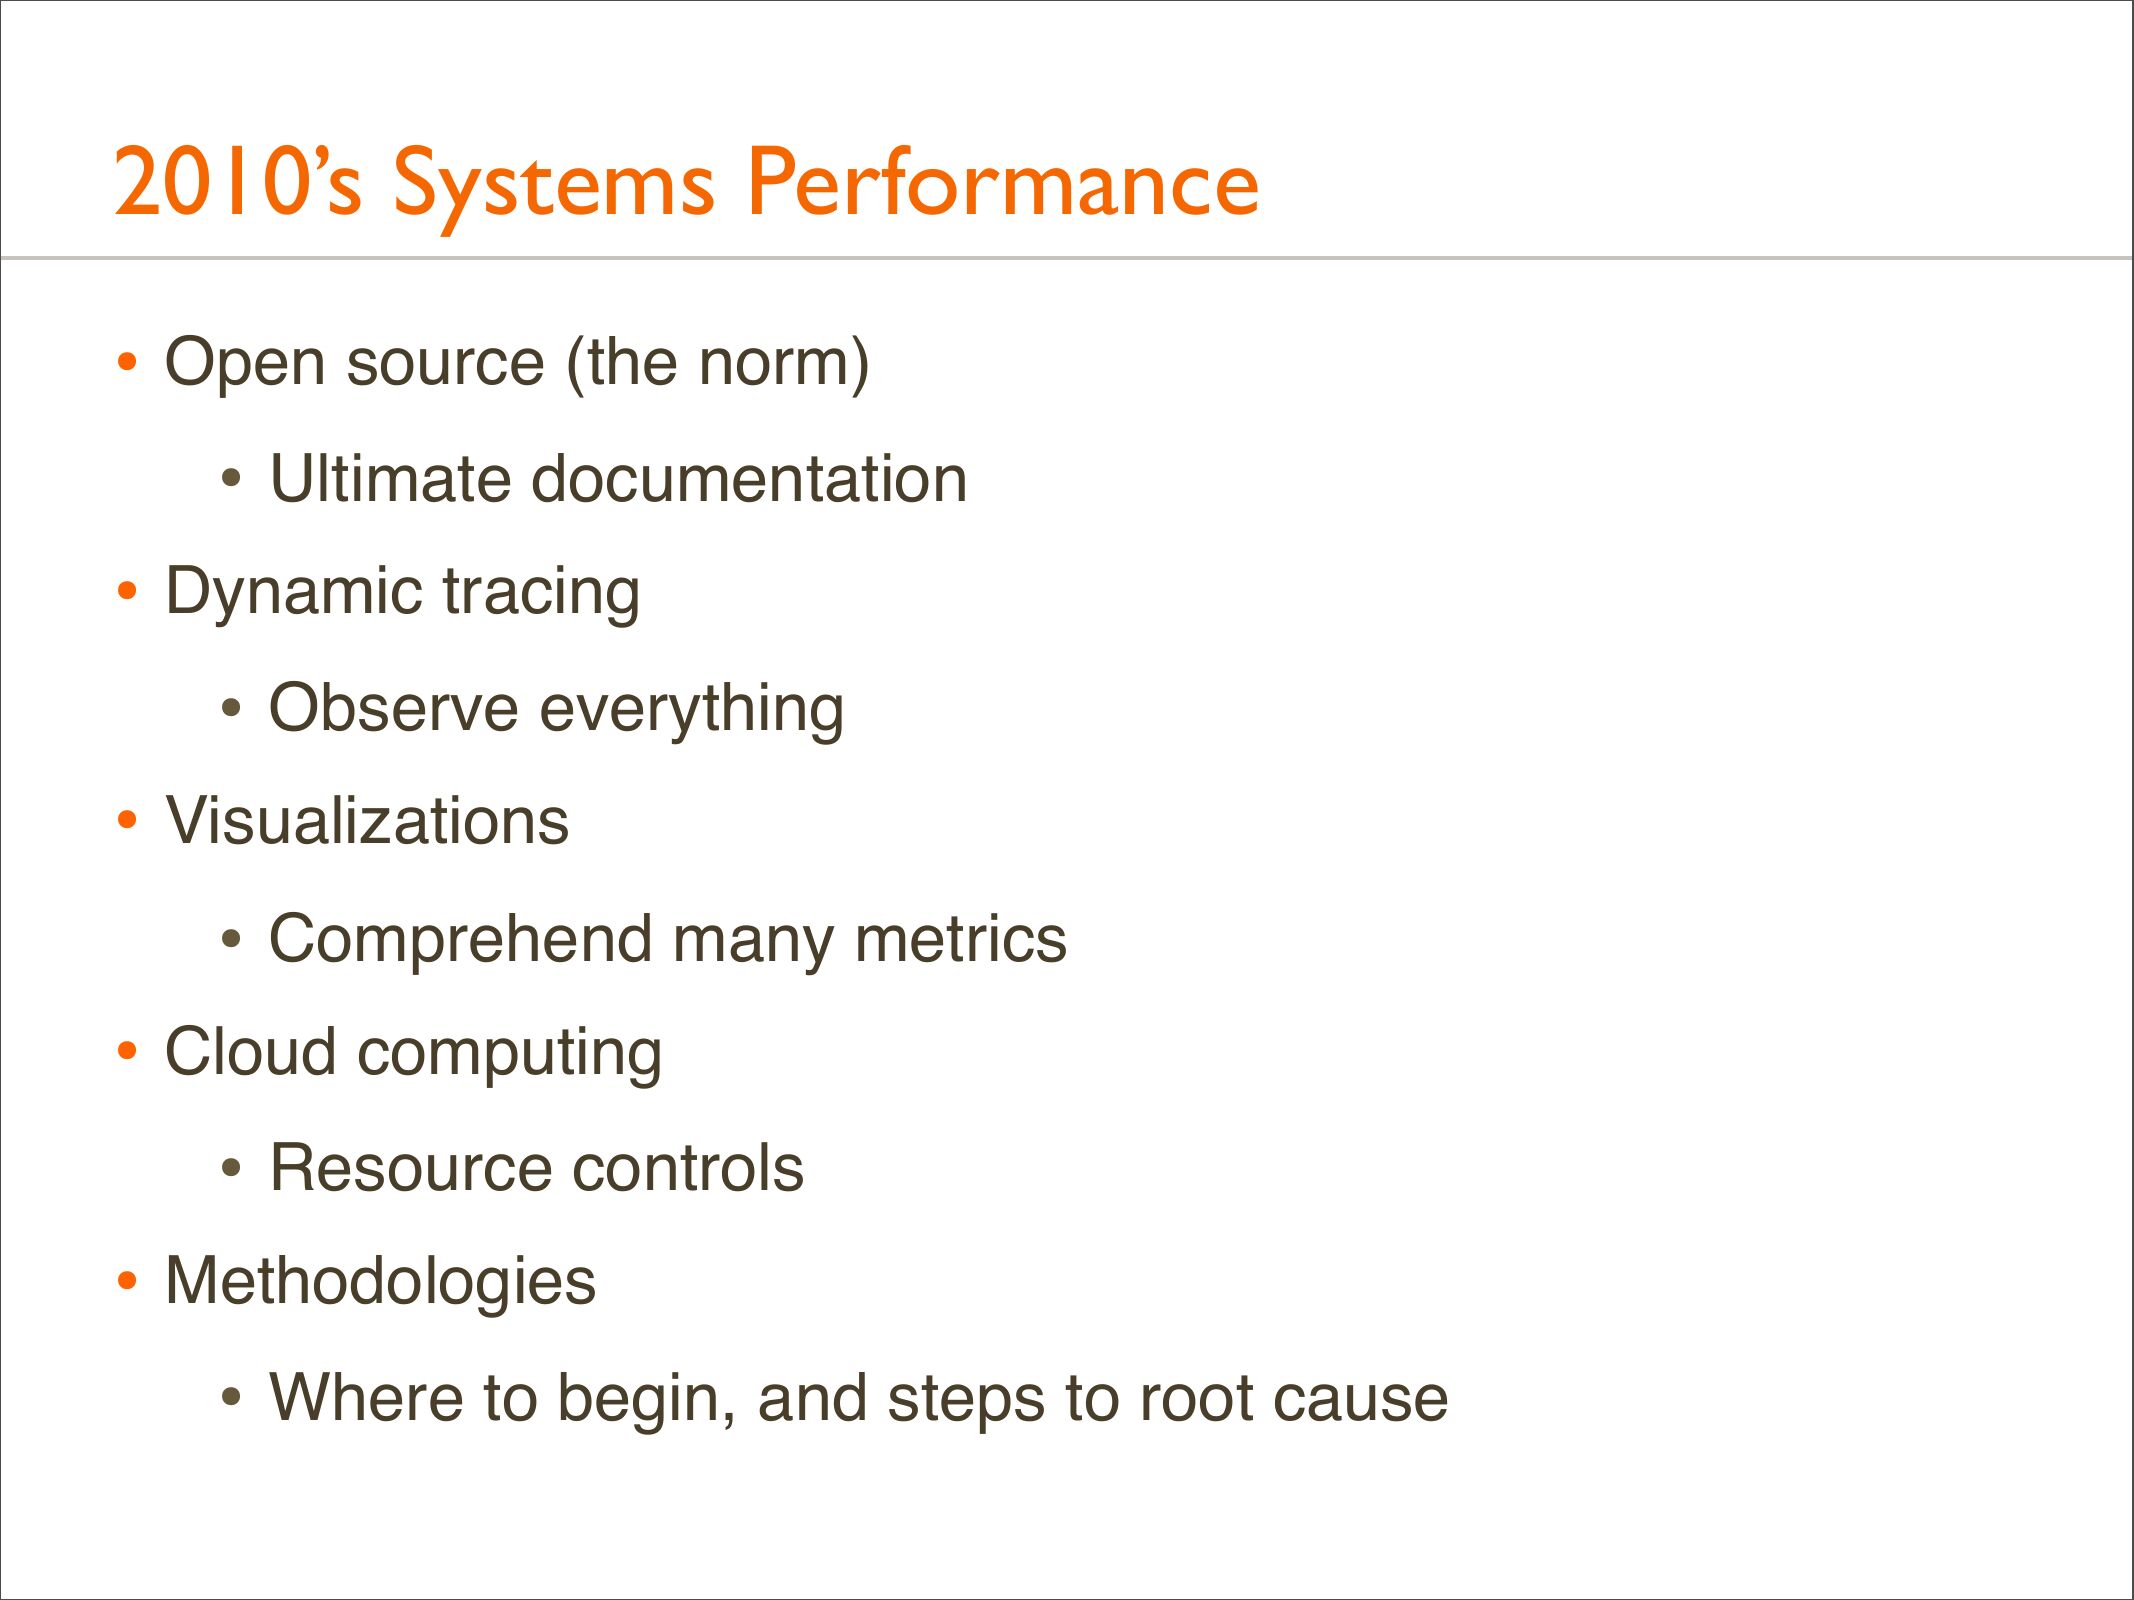
2010’s Systems Performance
• Open source (the norm)
• Ultimate documentation
• Dynamic tracing
• Observe everything
• Visualizations
• Comprehend many metrics
• Cloud computing
• Resource controls
• Methodologies
• Where to begin, and steps to root cause
slide 5:
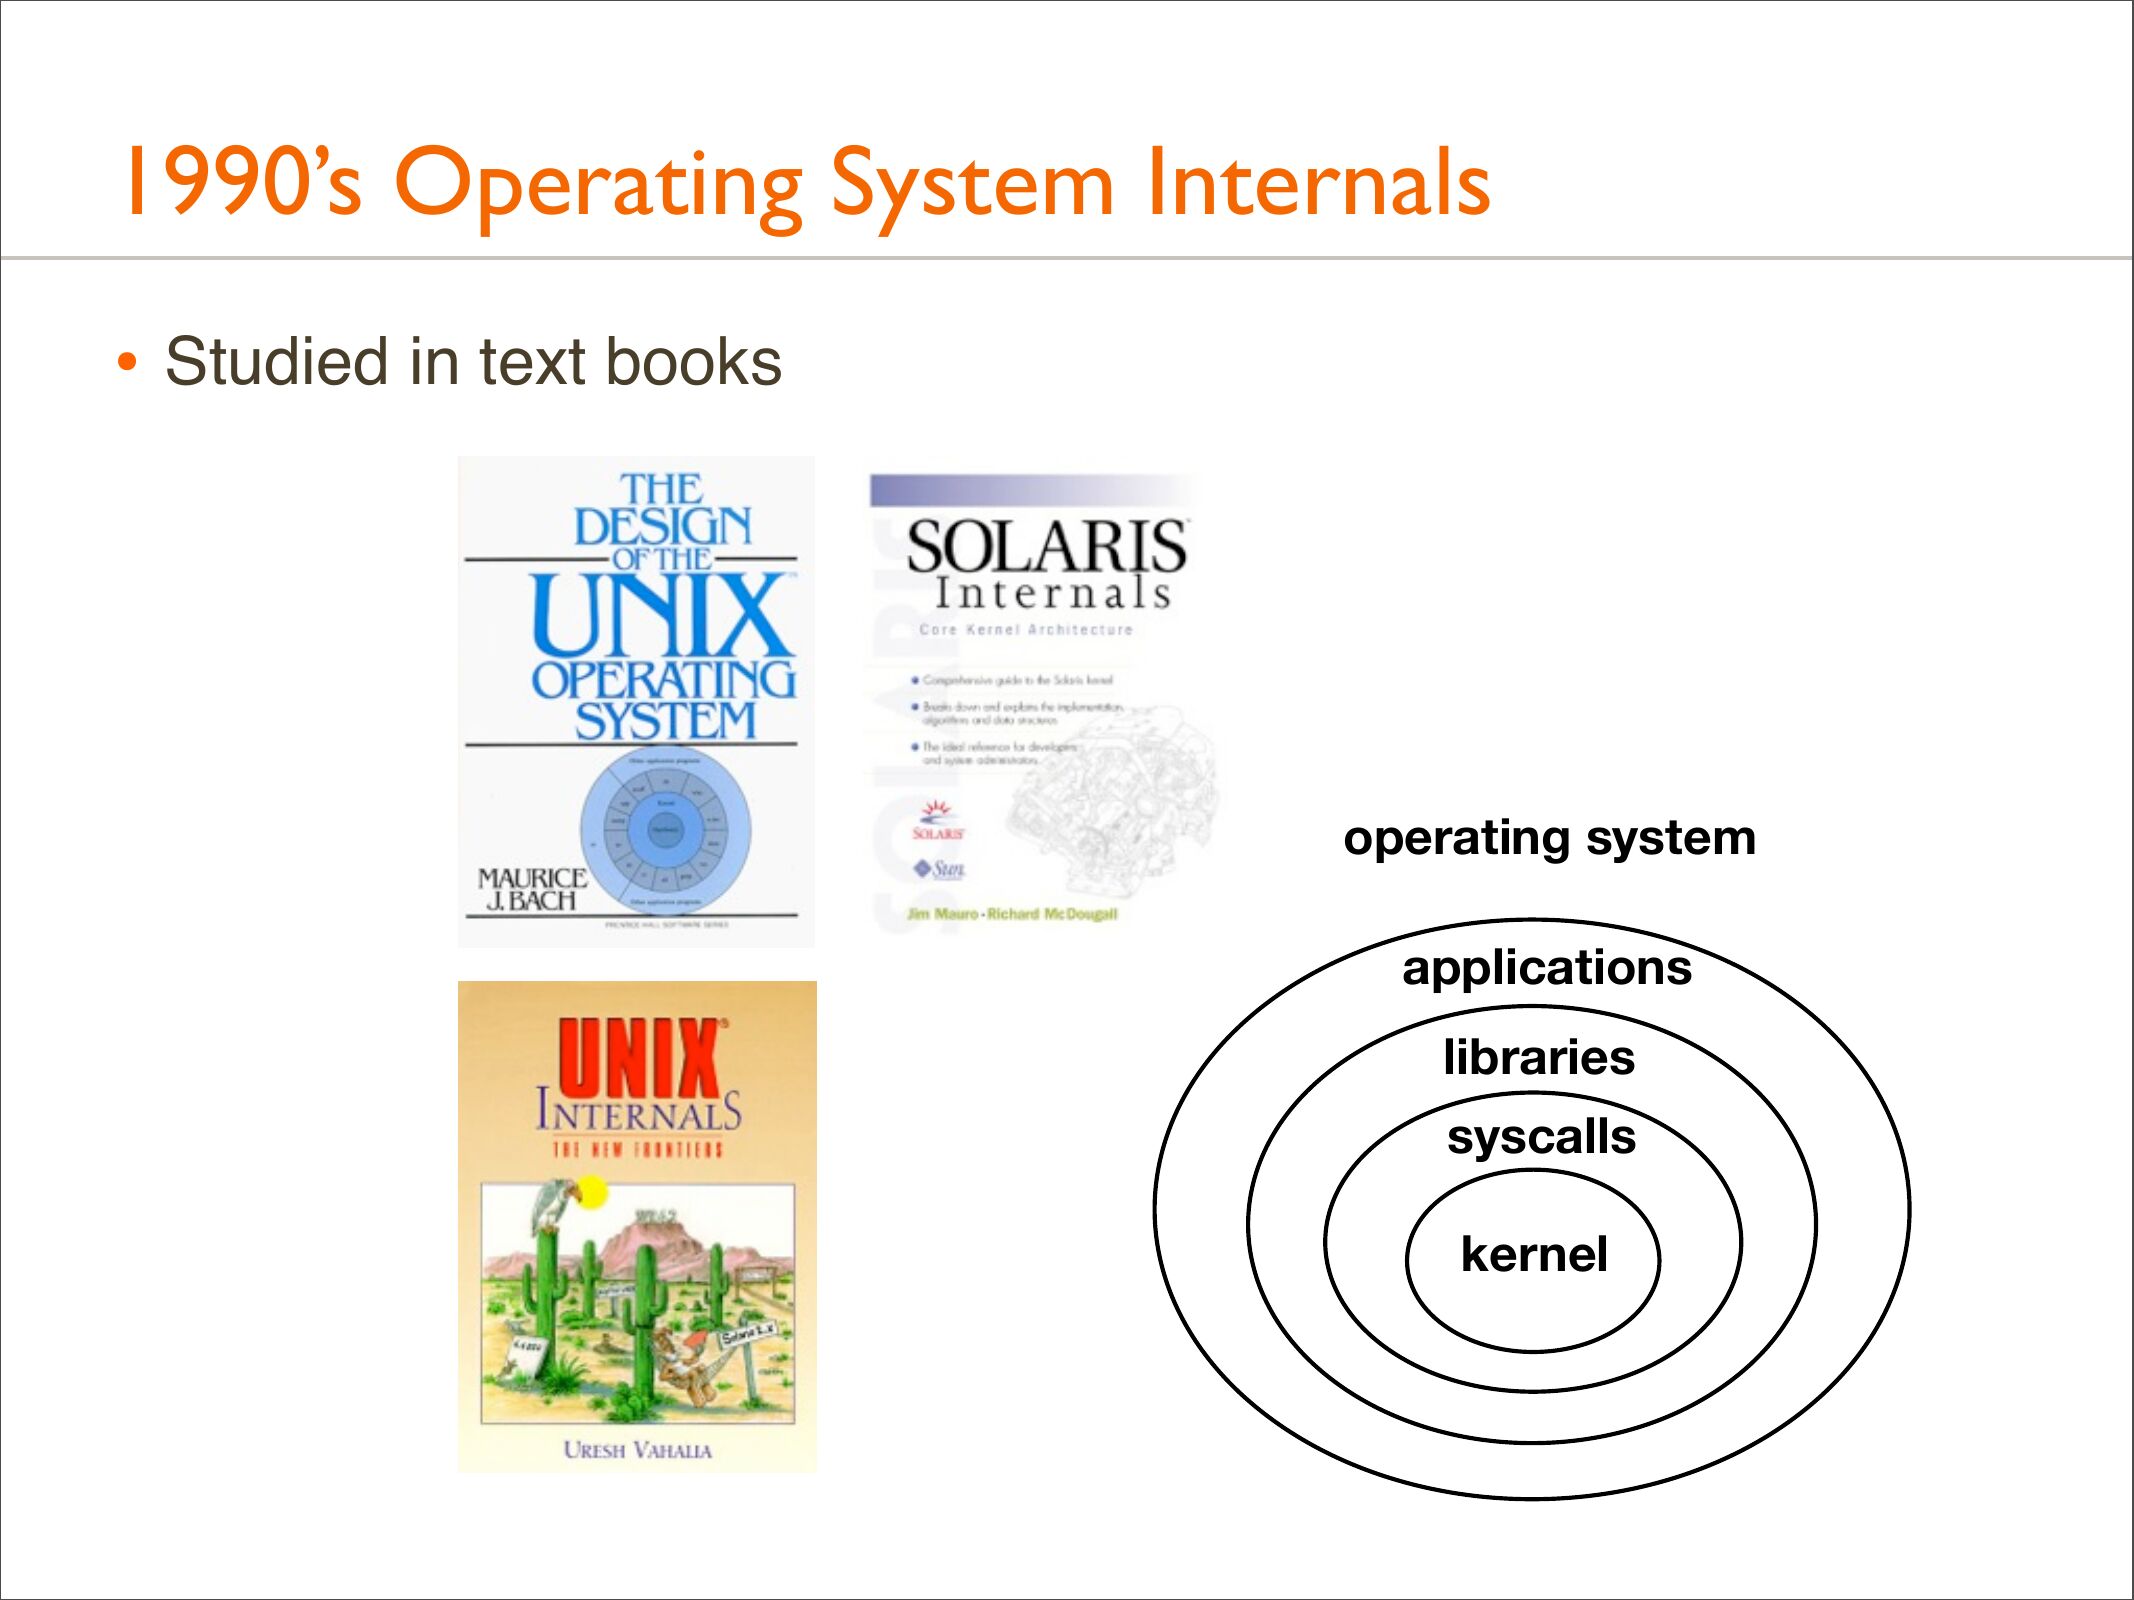
1990’s Operating System Internals
• Studied in text books
operating system
applications
libraries
syscalls
kernel
slide 6:
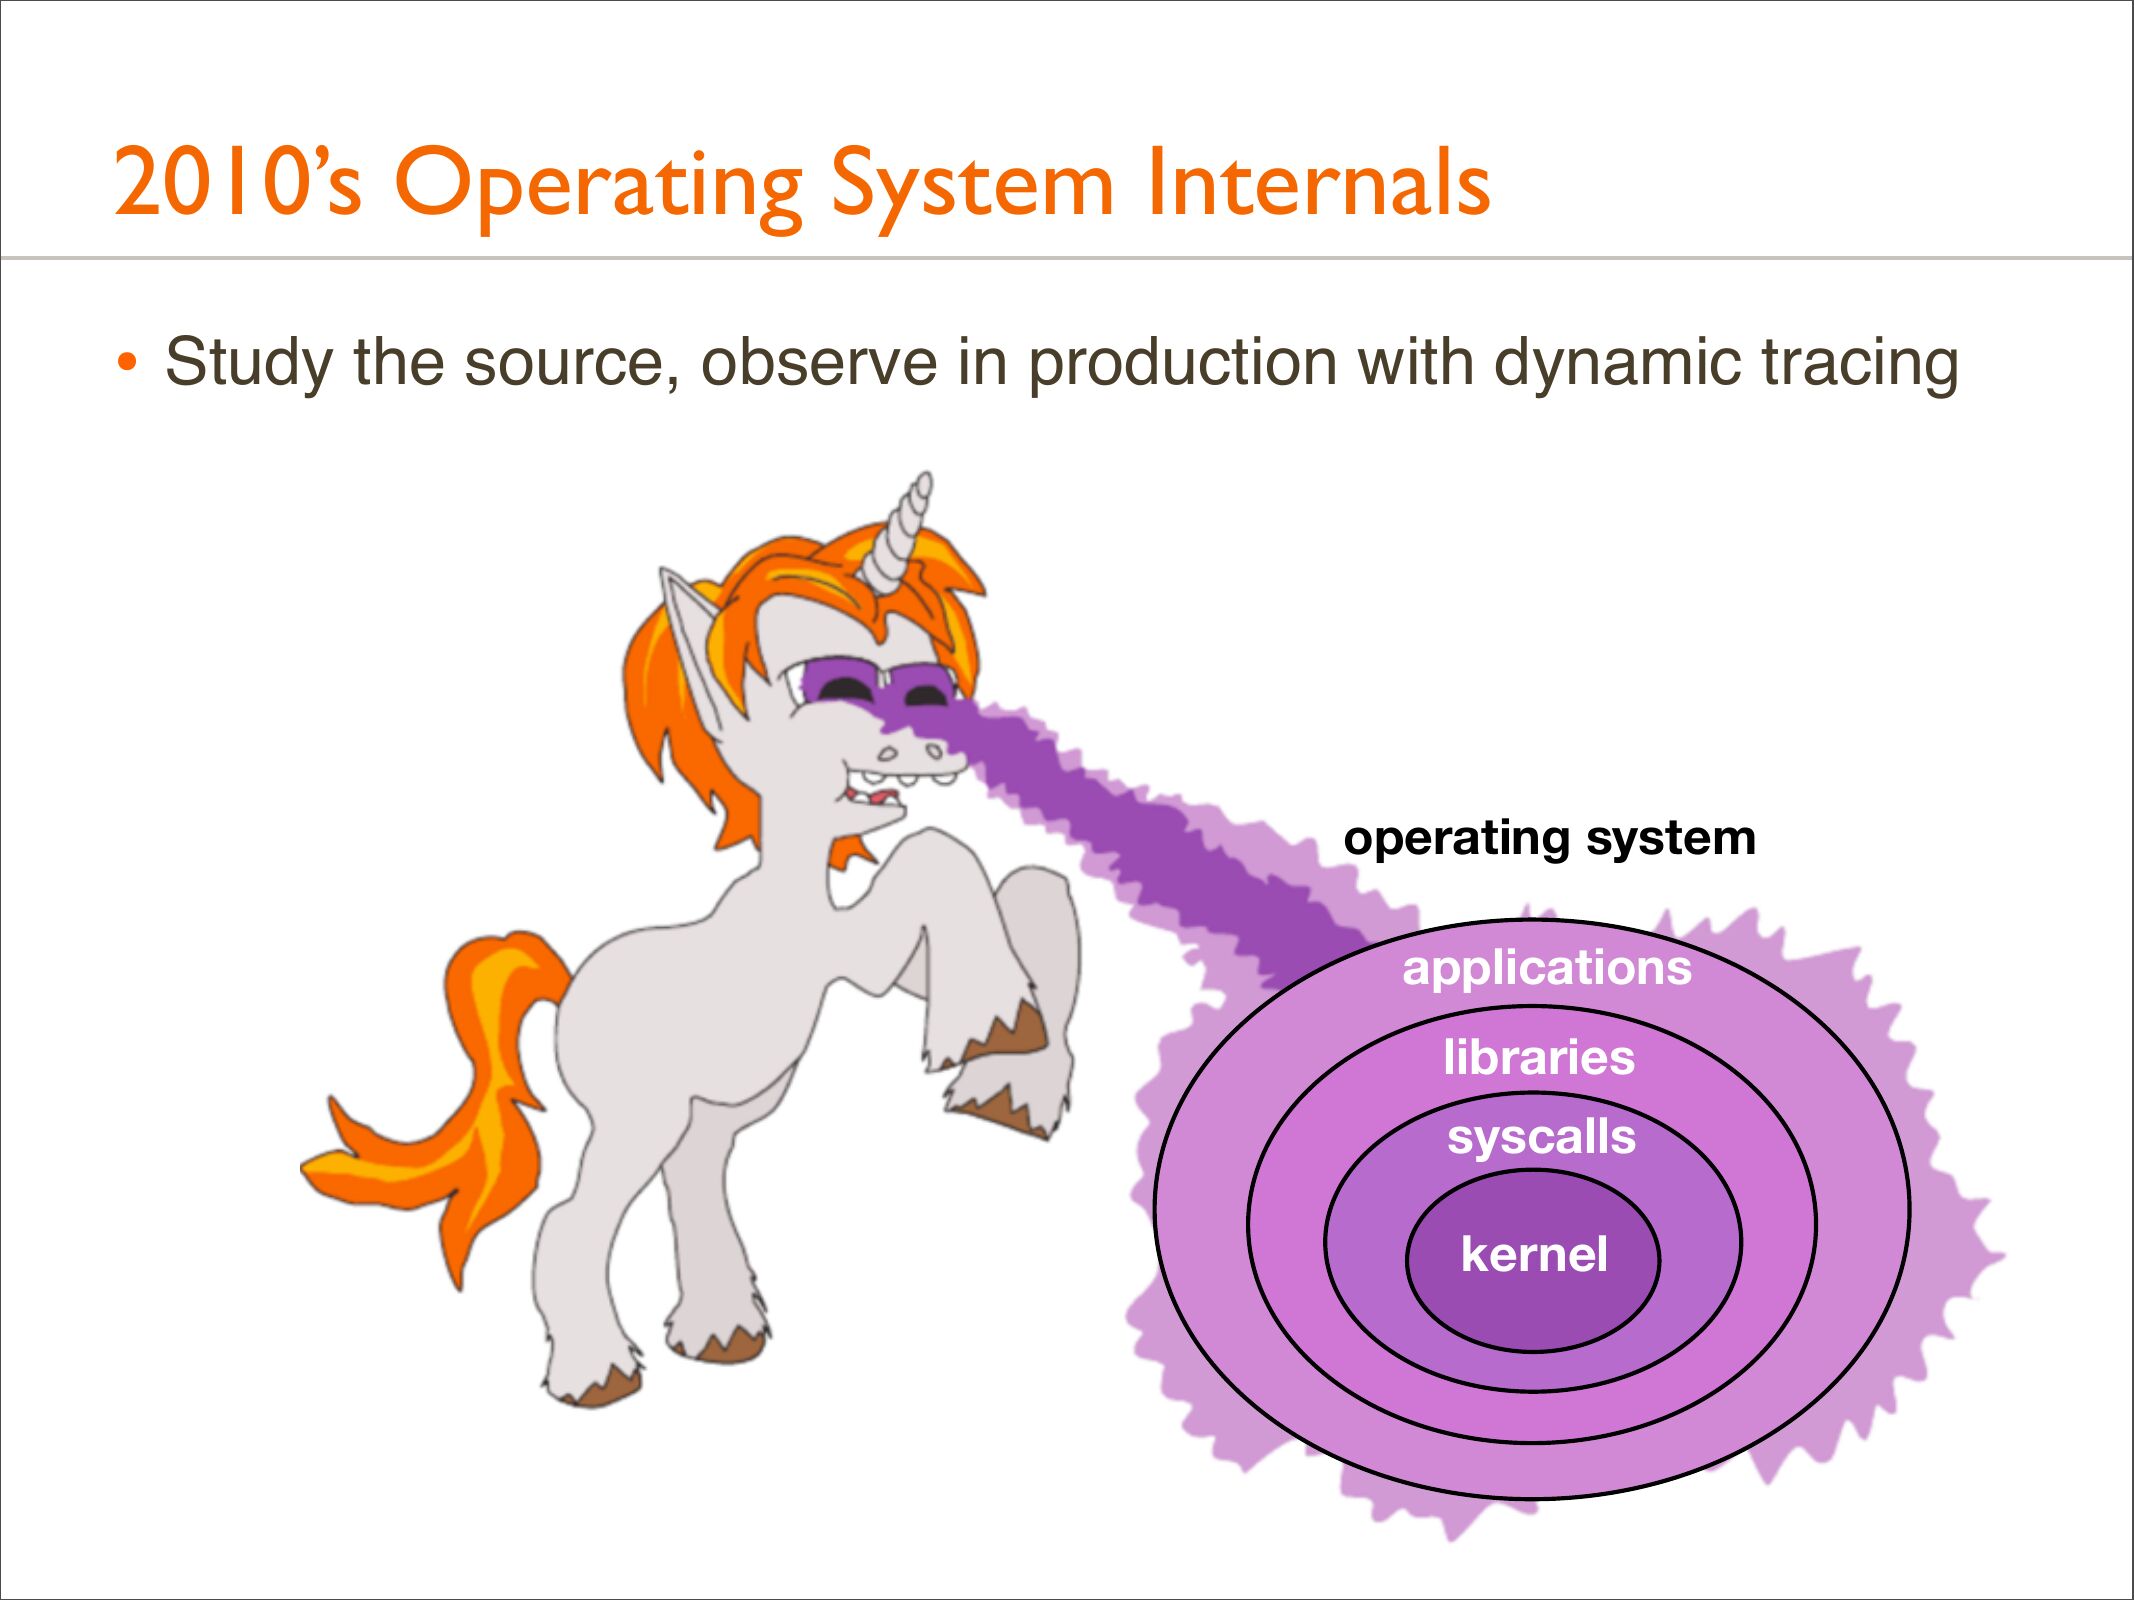
2010’s Operating System Internals
• Study the source, observe in production with dynamic tracing
operating system
applications
libraries
syscalls
kernel
slide 7:
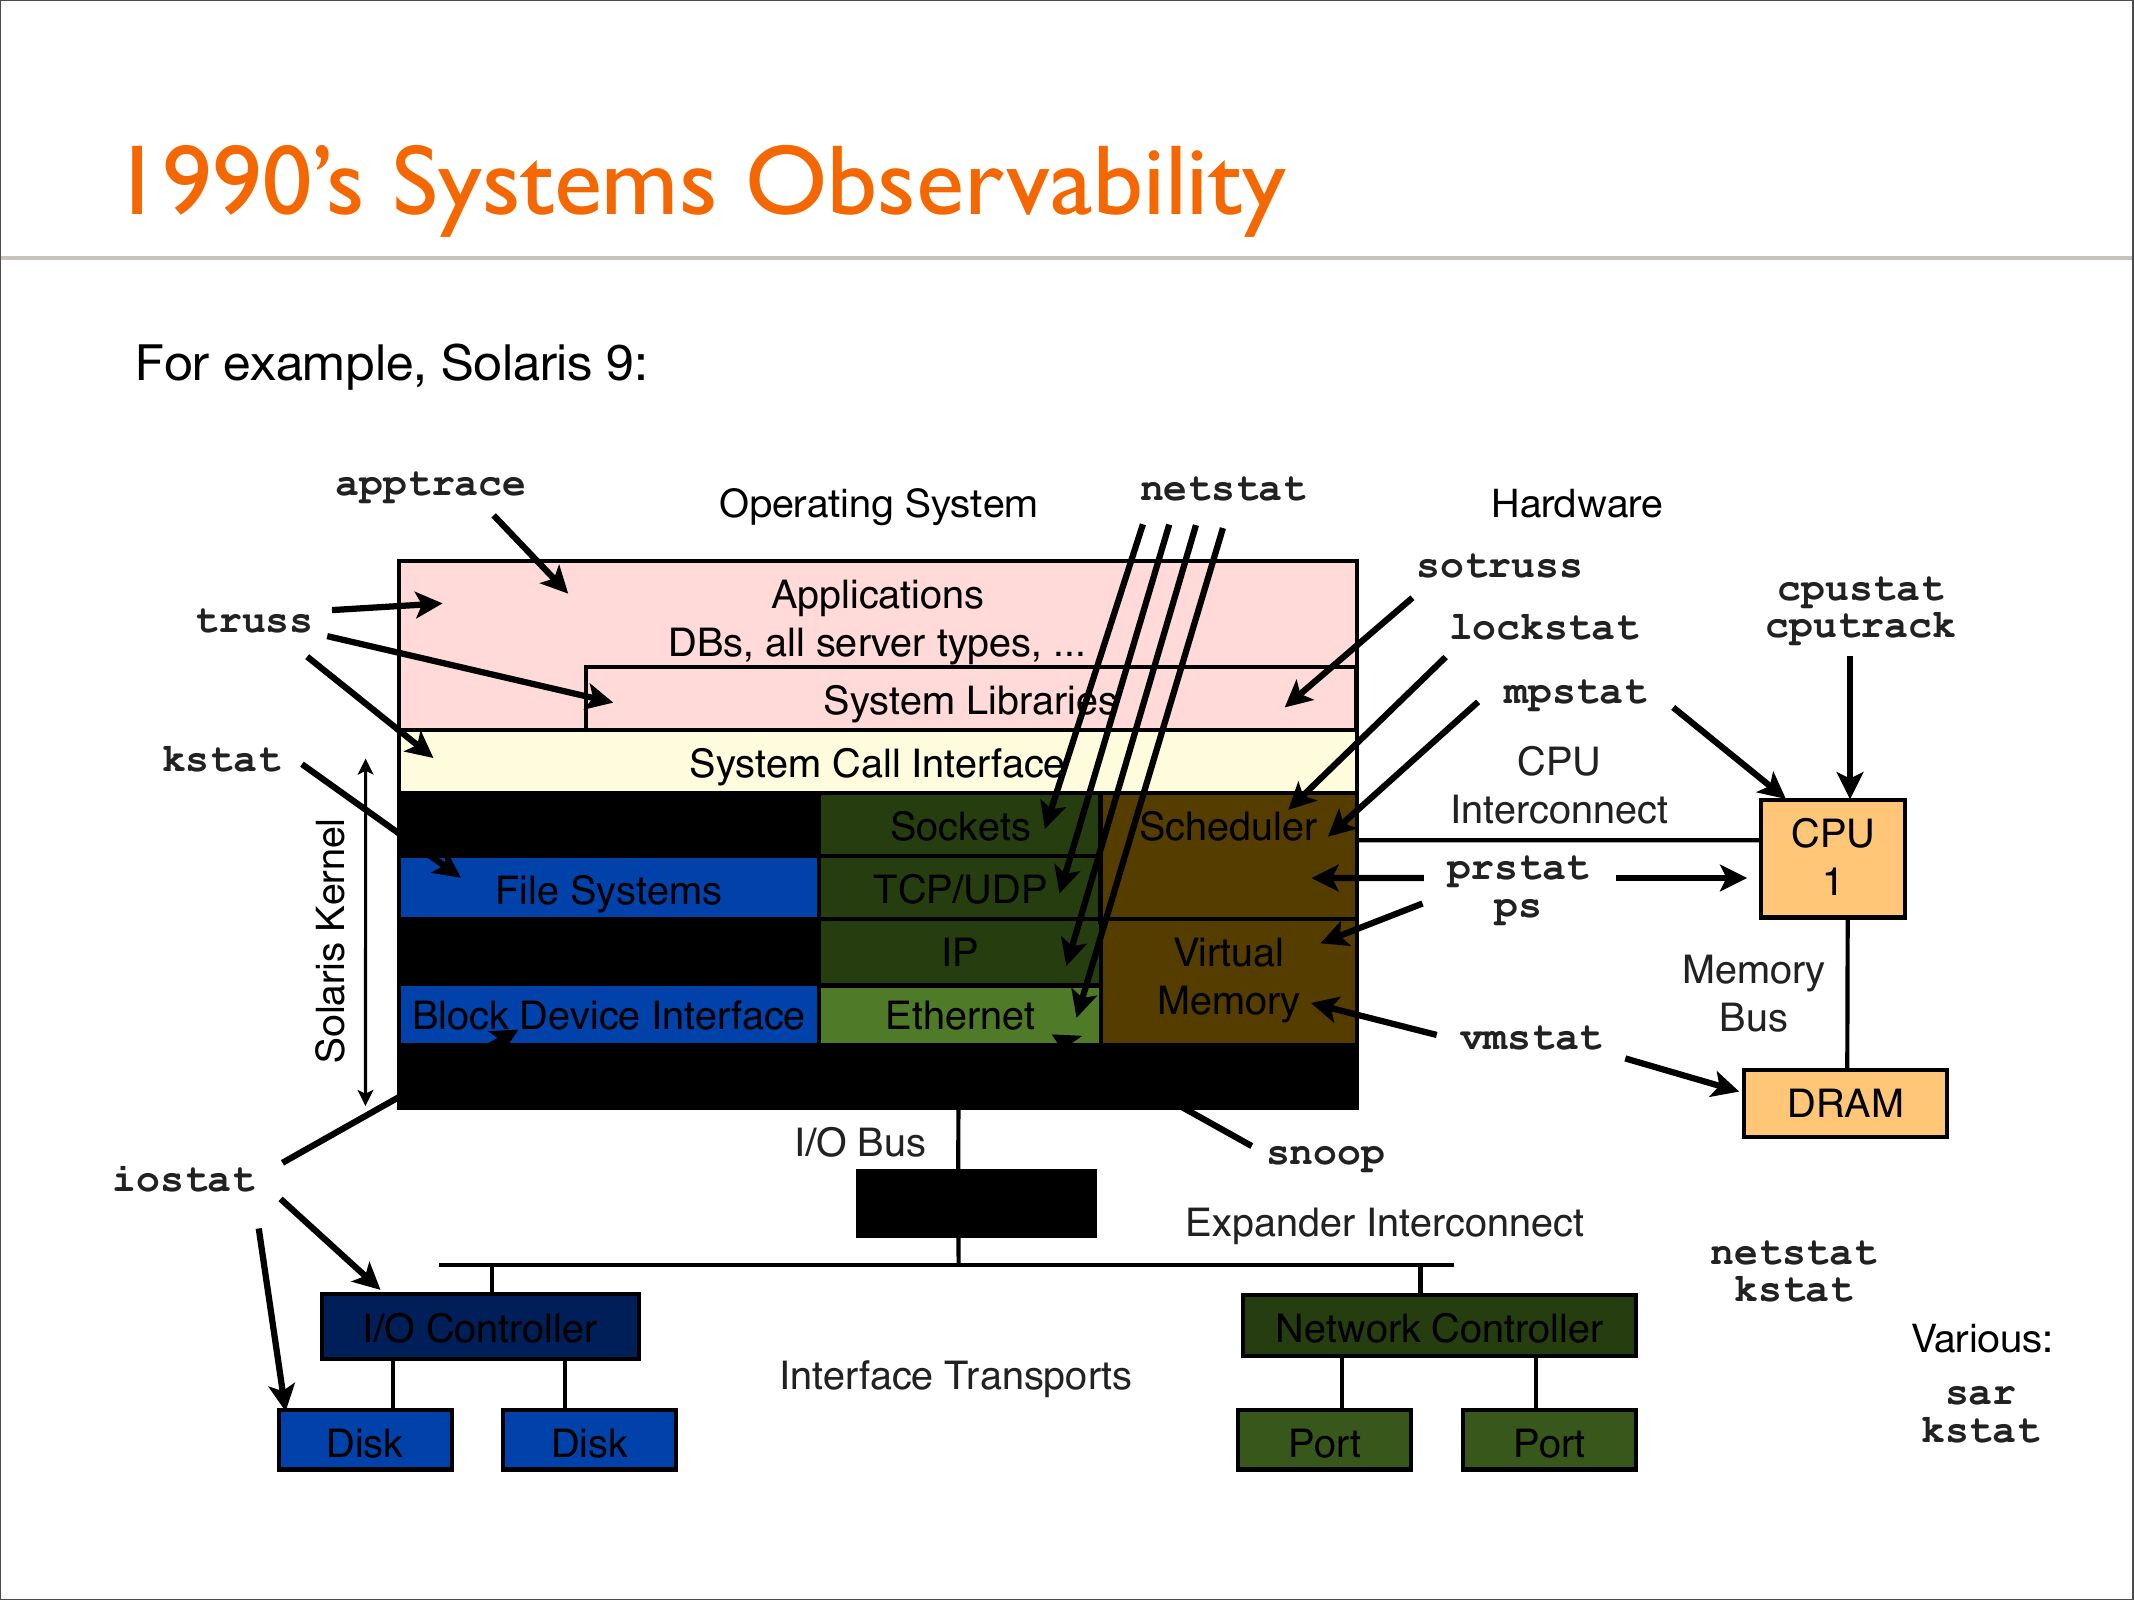
1990’s Systems Observability
For example, Solaris 9:
apptrace
Operating System
netstat
sotruss
Applications
DBs, all server types, ...
System Libraries
truss
kstat
lockstat
Solaris Kernel
Sockets
File Systems
TCP/UDP
Volume Managers
Block Device Interface
Ethernet
Scheduler
Virtual
Memory
CPU
Interconnect
prstat
vmstat
Device Drivers
I/O Bus
iostat
I/O Bridge
I/O Controller
Disk
CPU
Memory
Bus
DRAM
snoop
Expander Interconnect
Network Controller
Interface Transports
Disk
cpustat
cputrack
mpstat
System Call Interface
VFS
Hardware
Port
Port
netstat
kstat
Various:
sar
kstat
slide 8:
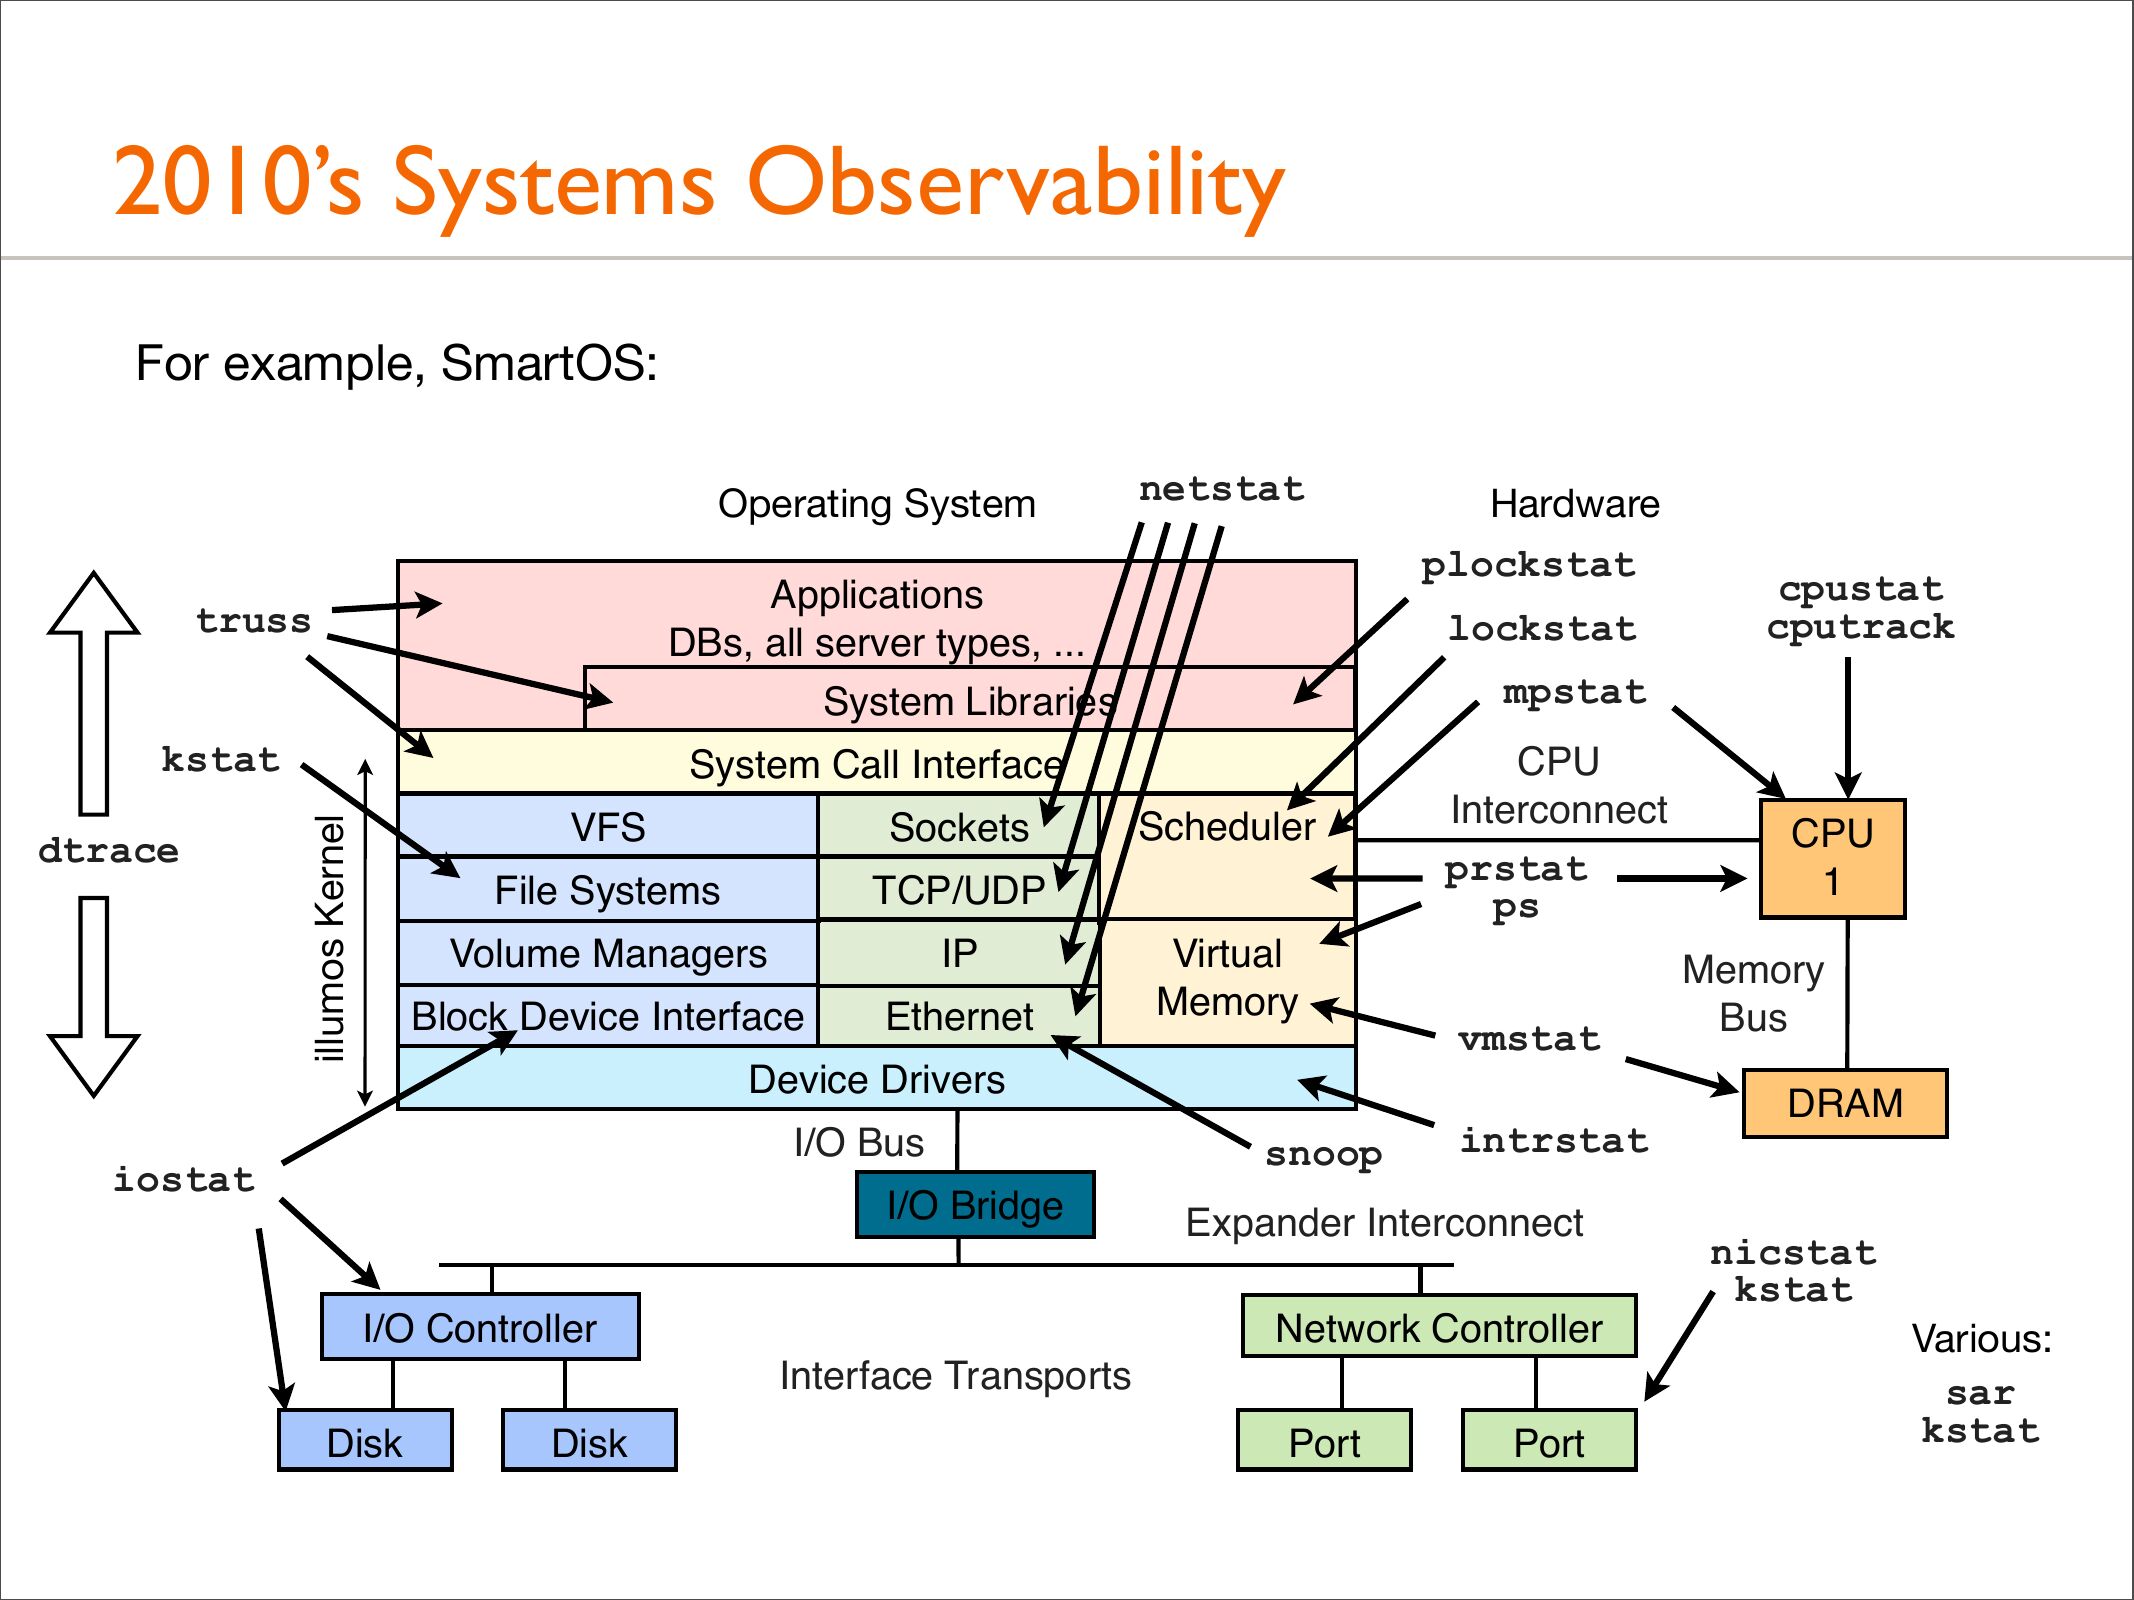
2010’s Systems Observability
For example, SmartOS:
Operating System
Applications
DBs, all server types, ...
System Libraries
truss
kstat
VFS
Sockets
File Systems
TCP/UDP
Volume Managers
Block Device Interface
Ethernet
Hardware
plockstat
lockstat
Scheduler
Virtual
Memory
CPU
Interconnect
prstat
vmstat
Device Drivers
I/O Bus
iostat
I/O Bridge
I/O Controller
snoop
intrstat
Expander Interconnect
Network Controller
Interface Transports
Disk
Disk
cpustat
cputrack
mpstat
System Call Interface
illumos Kernel
dtrace
netstat
Port
Port
CPU
Memory
Bus
DRAM
nicstat
kstat
Various:
sar
kstat
slide 9:
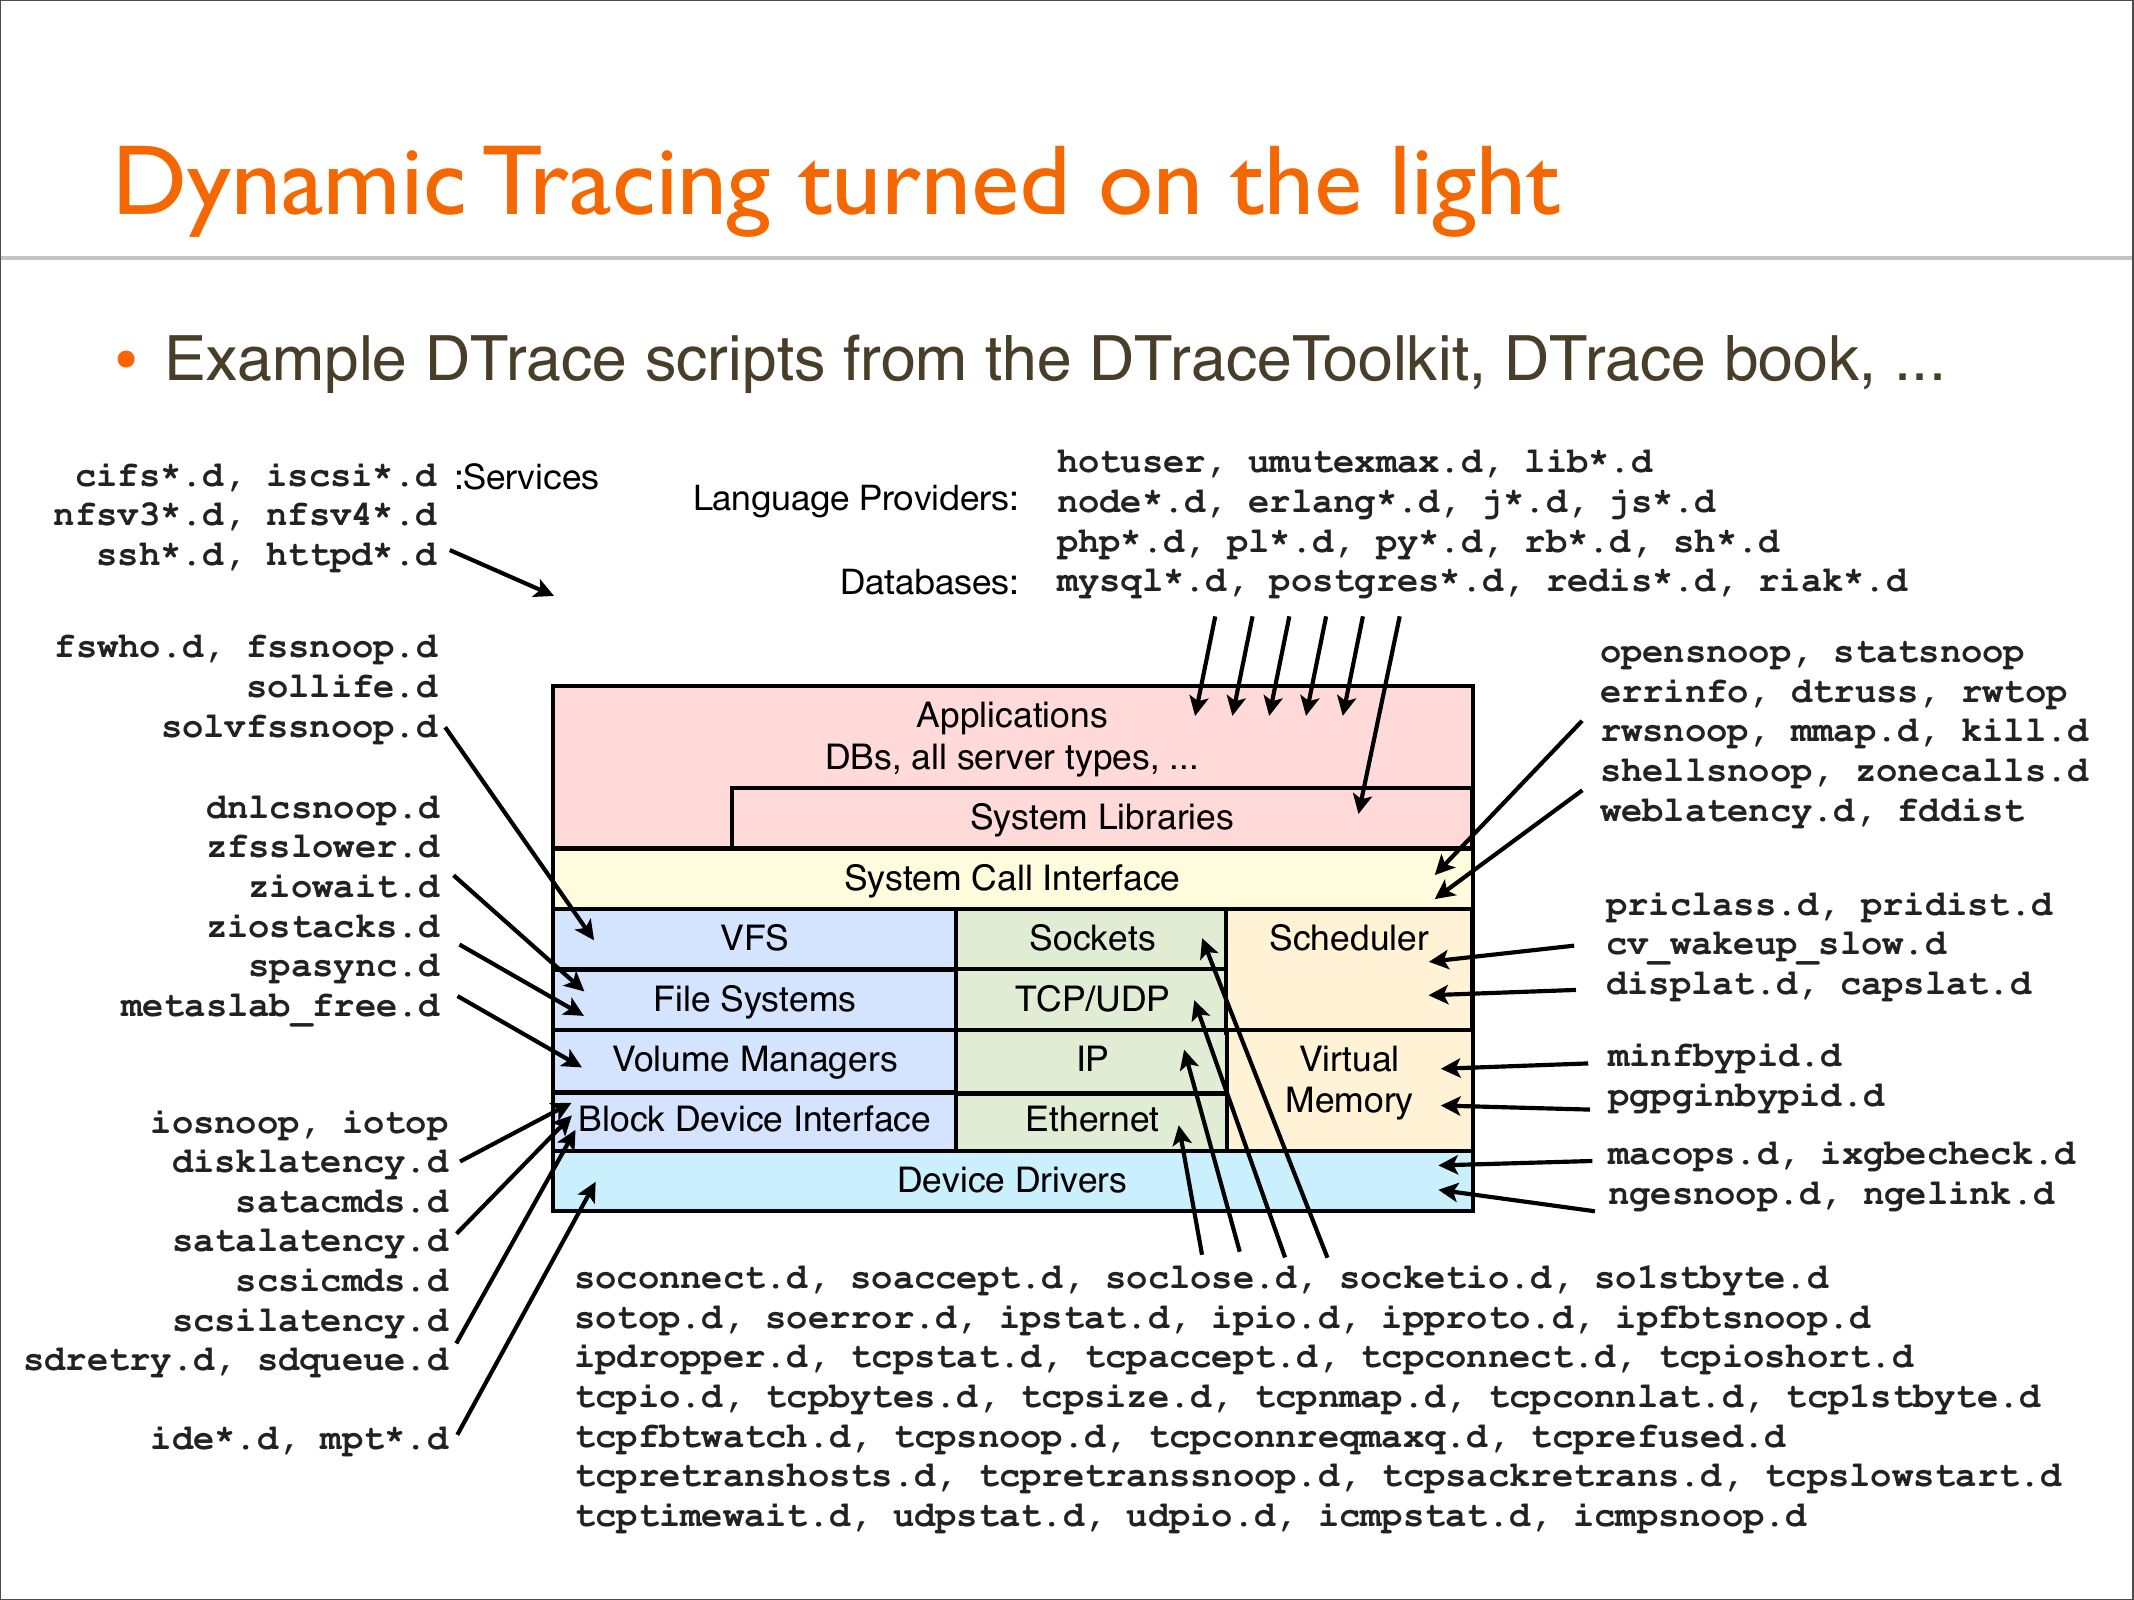
Dynamic Tracing turned on the light
• Example DTrace scripts from the DTraceToolkit, DTrace book, ...
cifs*.d, iscsi*.d :Services
nfsv3*.d, nfsv4*.d
ssh*.d, httpd*.d
Language Providers:
Databases:
fswho.d, fssnoop.d
sollife.d
solvfssnoop.d
dnlcsnoop.d
zfsslower.d
ziowait.d
ziostacks.d
spasync.d
metaslab_free.d
iosnoop, iotop
disklatency.d
satacmds.d
satalatency.d
scsicmds.d
scsilatency.d
sdretry.d, sdqueue.d
ide*.d, mpt*.d
hotuser, umutexmax.d, lib*.d
node*.d, erlang*.d, j*.d, js*.d
php*.d, pl*.d, py*.d, rb*.d, sh*.d
mysql*.d, postgres*.d, redis*.d, riak*.d
opensnoop, statsnoop
errinfo, dtruss, rwtop
rwsnoop, mmap.d, kill.d
shellsnoop, zonecalls.d
weblatency.d, fddist
Applications
DBs, all server types, ...
System Libraries
System Call Interface
VFS
Sockets
File Systems
TCP/UDP
Volume Managers
Block Device Interface
Ethernet
Device Drivers
Scheduler
priclass.d, pridist.d
cv_wakeup_slow.d
displat.d, capslat.d
Virtual
Memory
minfbypid.d
pgpginbypid.d
macops.d, ixgbecheck.d
ngesnoop.d, ngelink.d
soconnect.d, soaccept.d, soclose.d, socketio.d, so1stbyte.d
sotop.d, soerror.d, ipstat.d, ipio.d, ipproto.d, ipfbtsnoop.d
ipdropper.d, tcpstat.d, tcpaccept.d, tcpconnect.d, tcpioshort.d
tcpio.d, tcpbytes.d, tcpsize.d, tcpnmap.d, tcpconnlat.d, tcp1stbyte.d
tcpfbtwatch.d, tcpsnoop.d, tcpconnreqmaxq.d, tcprefused.d
tcpretranshosts.d, tcpretranssnoop.d, tcpsackretrans.d, tcpslowstart.d
tcptimewait.d, udpstat.d, udpio.d, icmpstat.d, icmpsnoop.d
slide 10:
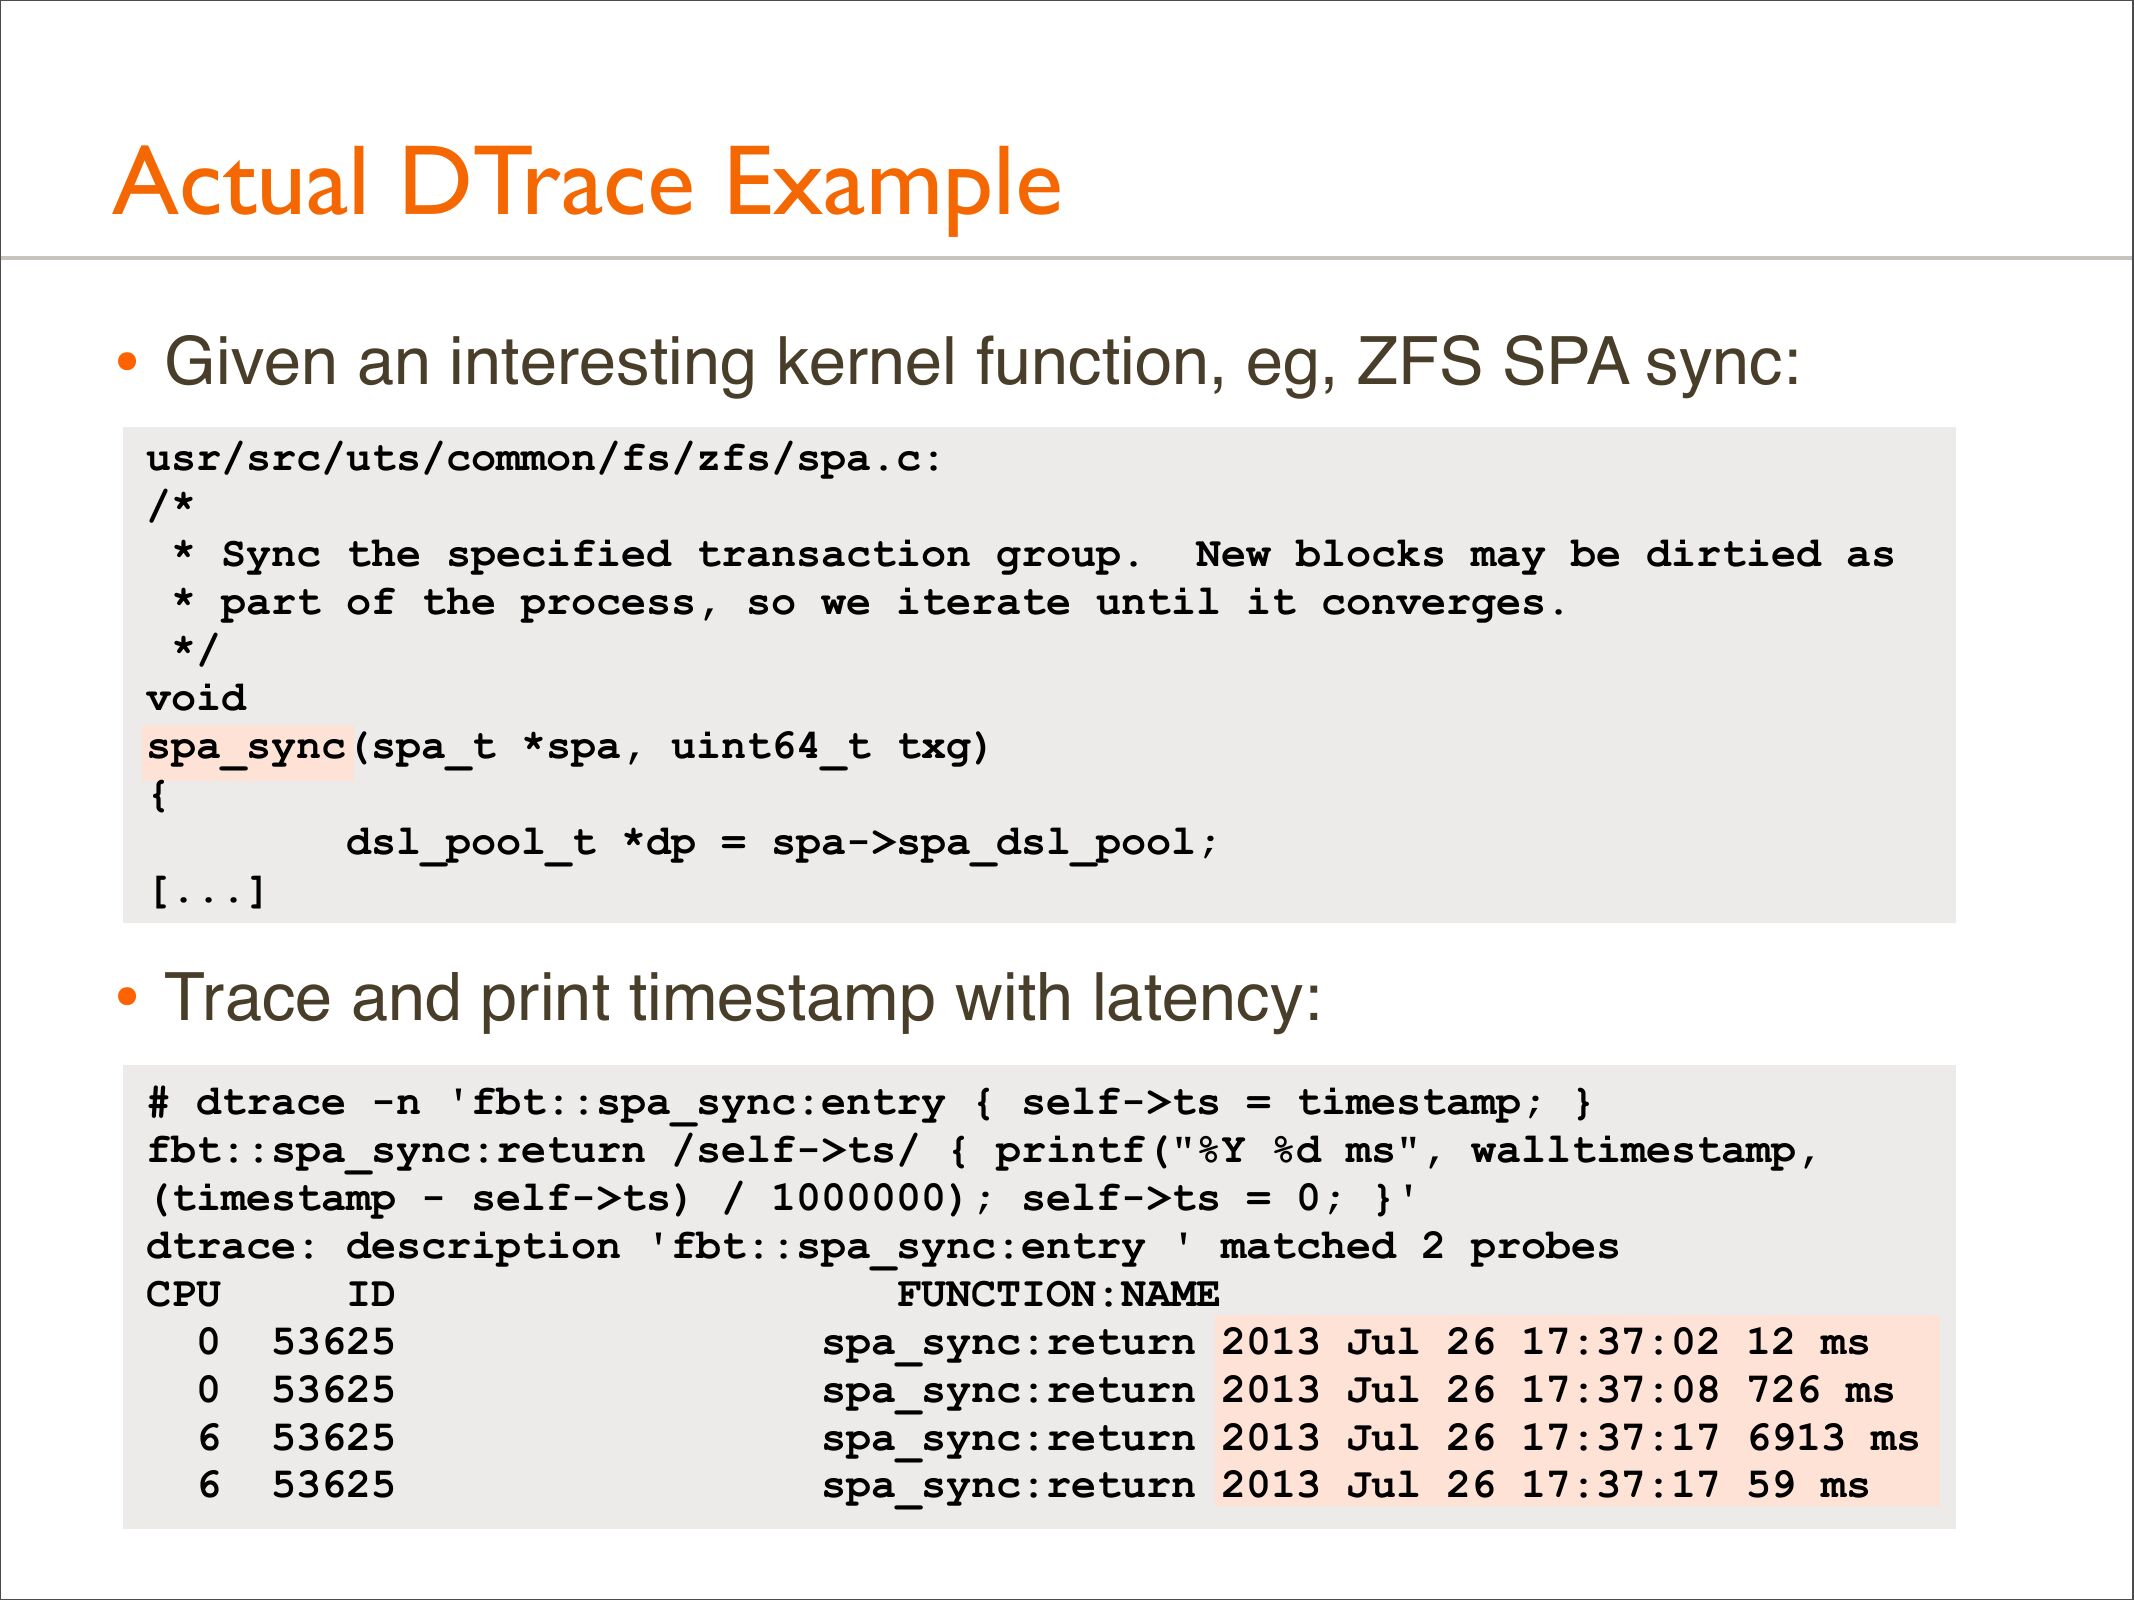
Actual DTrace Example
• Given an interesting kernel function, eg, ZFS SPA sync:
usr/src/uts/common/fs/zfs/spa.c:
* Sync the specified transaction group. New blocks may be dirtied as
* part of the process, so we iterate until it converges.
void
spa_sync(spa_t *spa, uint64_t txg)
dsl_pool_t *dp = spa->gt;spa_dsl_pool;
[...]
• Trace and print timestamp with latency:
# dtrace -n 'fbt::spa_sync:entry { self->gt;ts = timestamp; }
fbt::spa_sync:return /self->gt;ts/ { printf("%Y %d ms", walltimestamp,
(timestamp - self->gt;ts) / 1000000); self->gt;ts = 0; }'
dtrace: description 'fbt::spa_sync:entry ' matched 2 probes
CPU
FUNCTION:NAME
0 53625
spa_sync:return 2013 Jul 26 17:37:02 12 ms
0 53625
spa_sync:return 2013 Jul 26 17:37:08 726 ms
6 53625
spa_sync:return 2013 Jul 26 17:37:17 6913 ms
6 53625
spa_sync:return 2013 Jul 26 17:37:17 59 ms
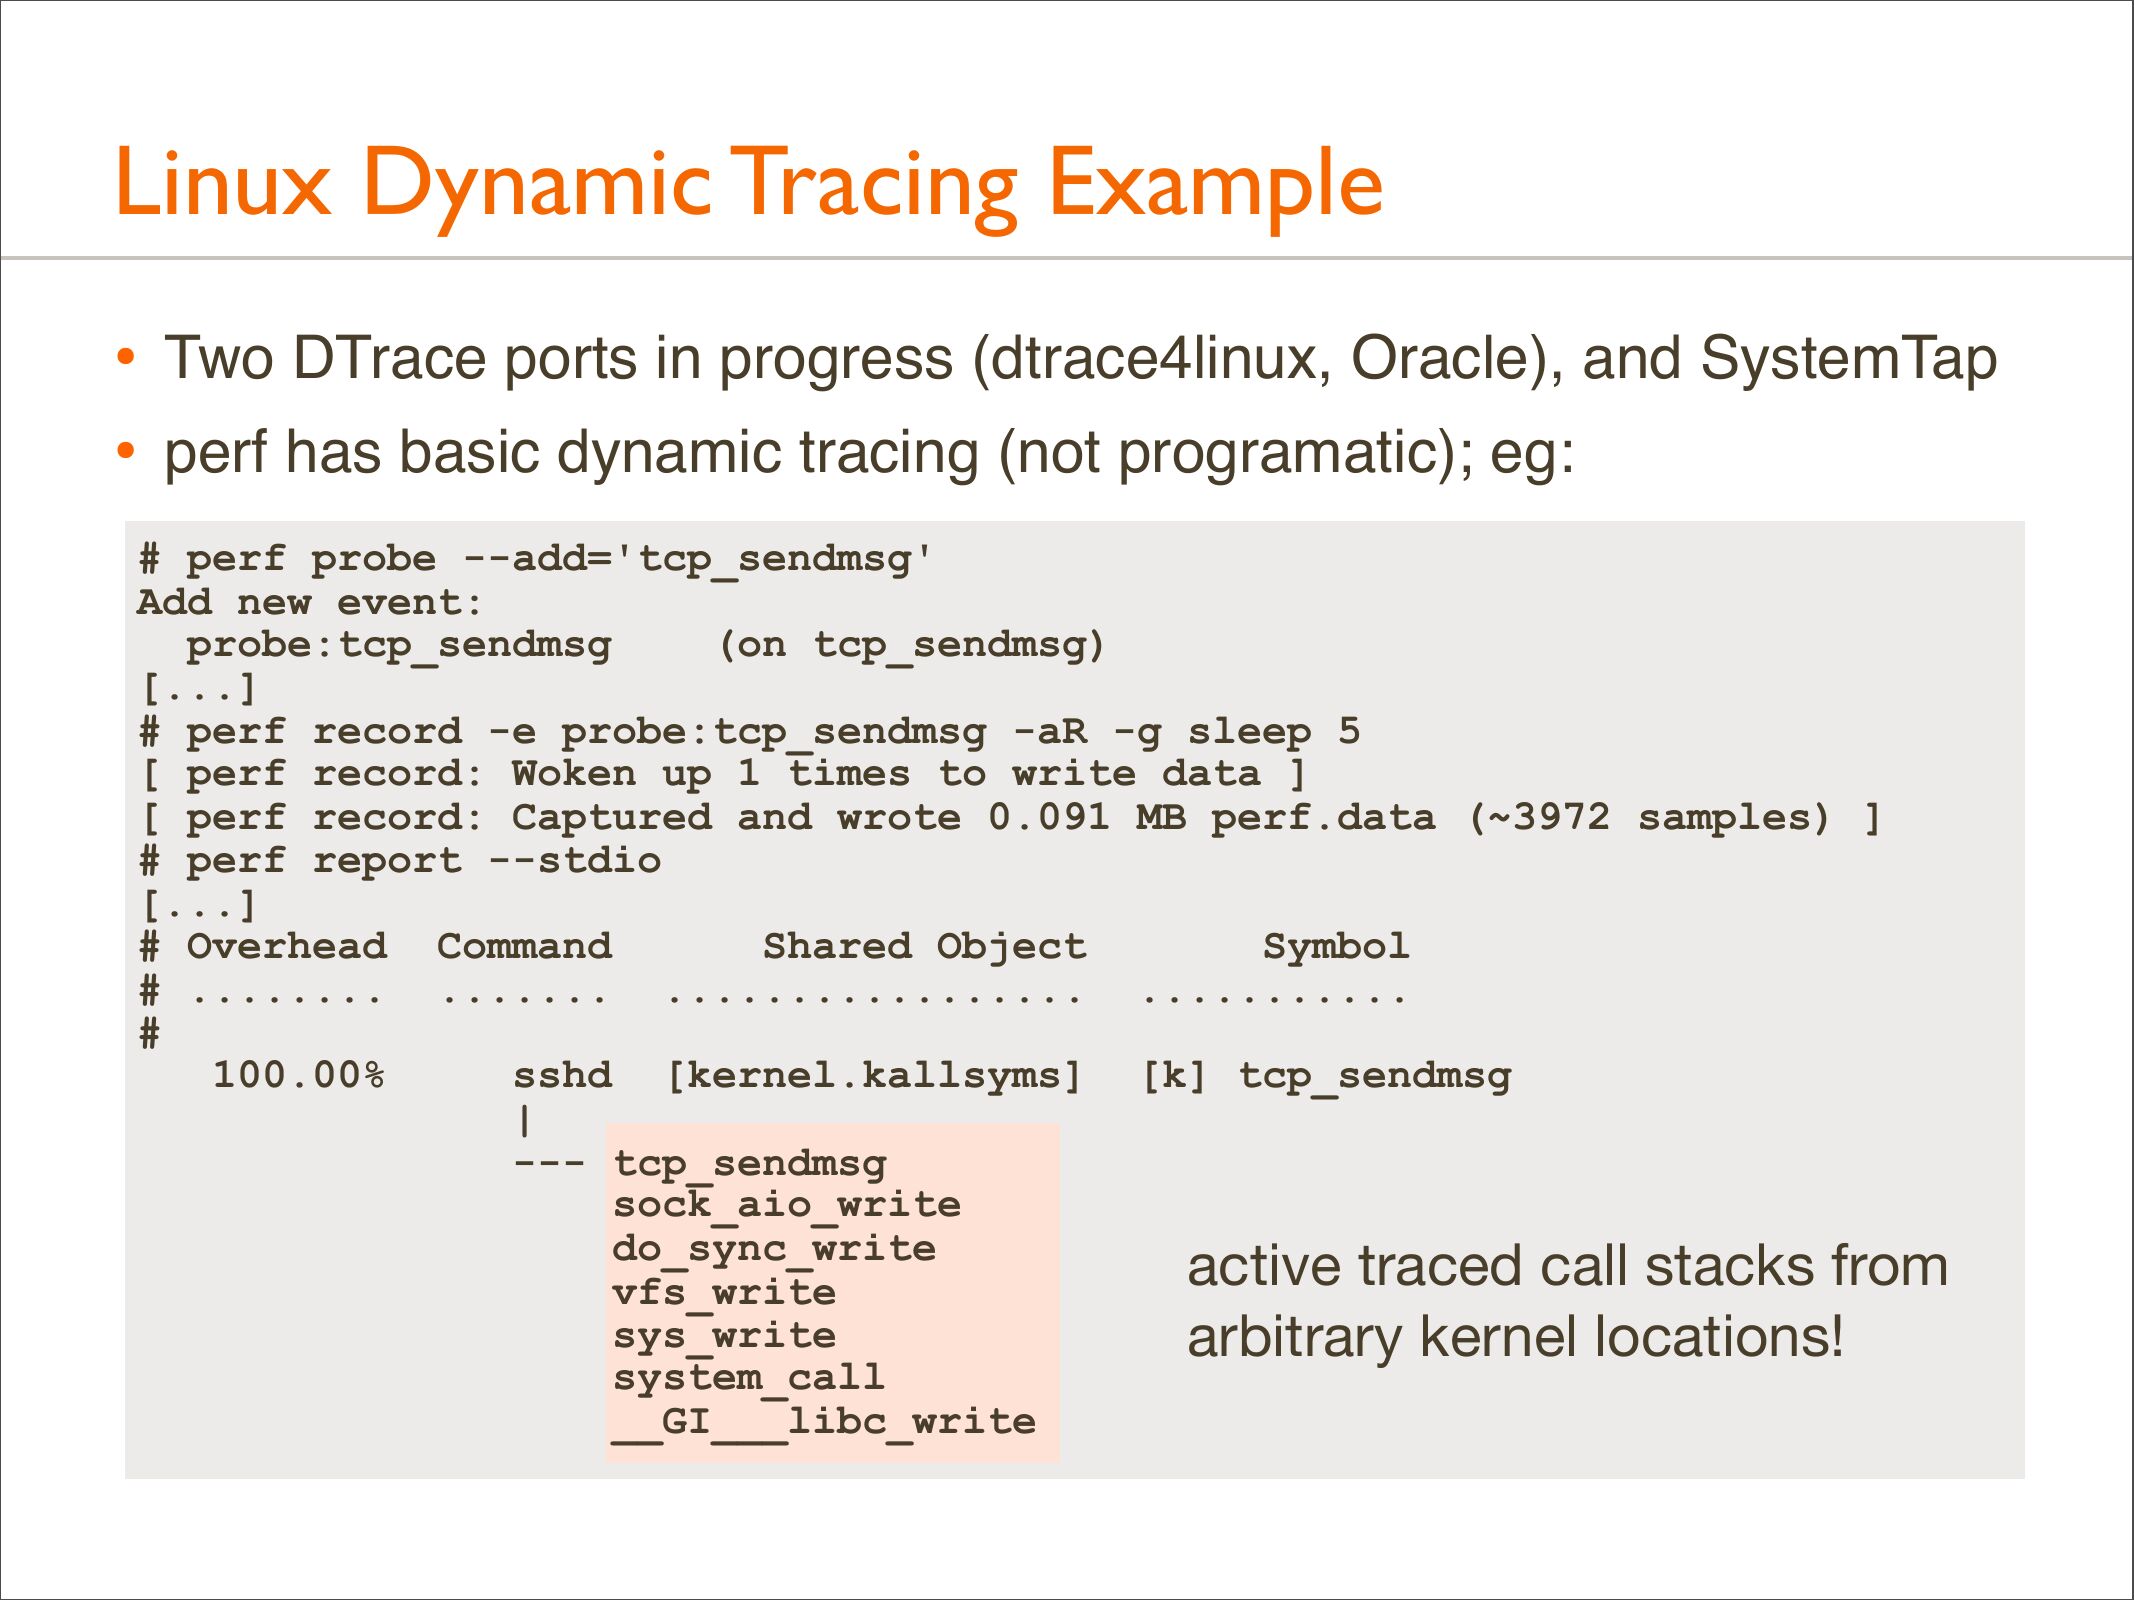
slide 11:Linux Dynamic Tracing Example • Two DTrace ports in progress (dtrace4linux, Oracle), and SystemTap • perf has basic dynamic tracing (not programatic); eg: # perf probe --add='tcp_sendmsg' Add new event: probe:tcp_sendmsg (on tcp_sendmsg) [...] # perf record -e probe:tcp_sendmsg -aR -g sleep 5 [ perf record: Woken up 1 times to write data ] [ perf record: Captured and wrote 0.091 MB perf.data (~3972 samples) ] # perf report --stdio [...] # Overhead Command Shared Object Symbol # ........ ....... ................. ........... 100.00% sshd [kernel.kallsyms] [k] tcp_sendmsg --- tcp_sendmsg sock_aio_write do_sync_write active traced call stacks from vfs_write sys_write arbitrary kernel locations! system_call __GI___libc_writeslide 12:
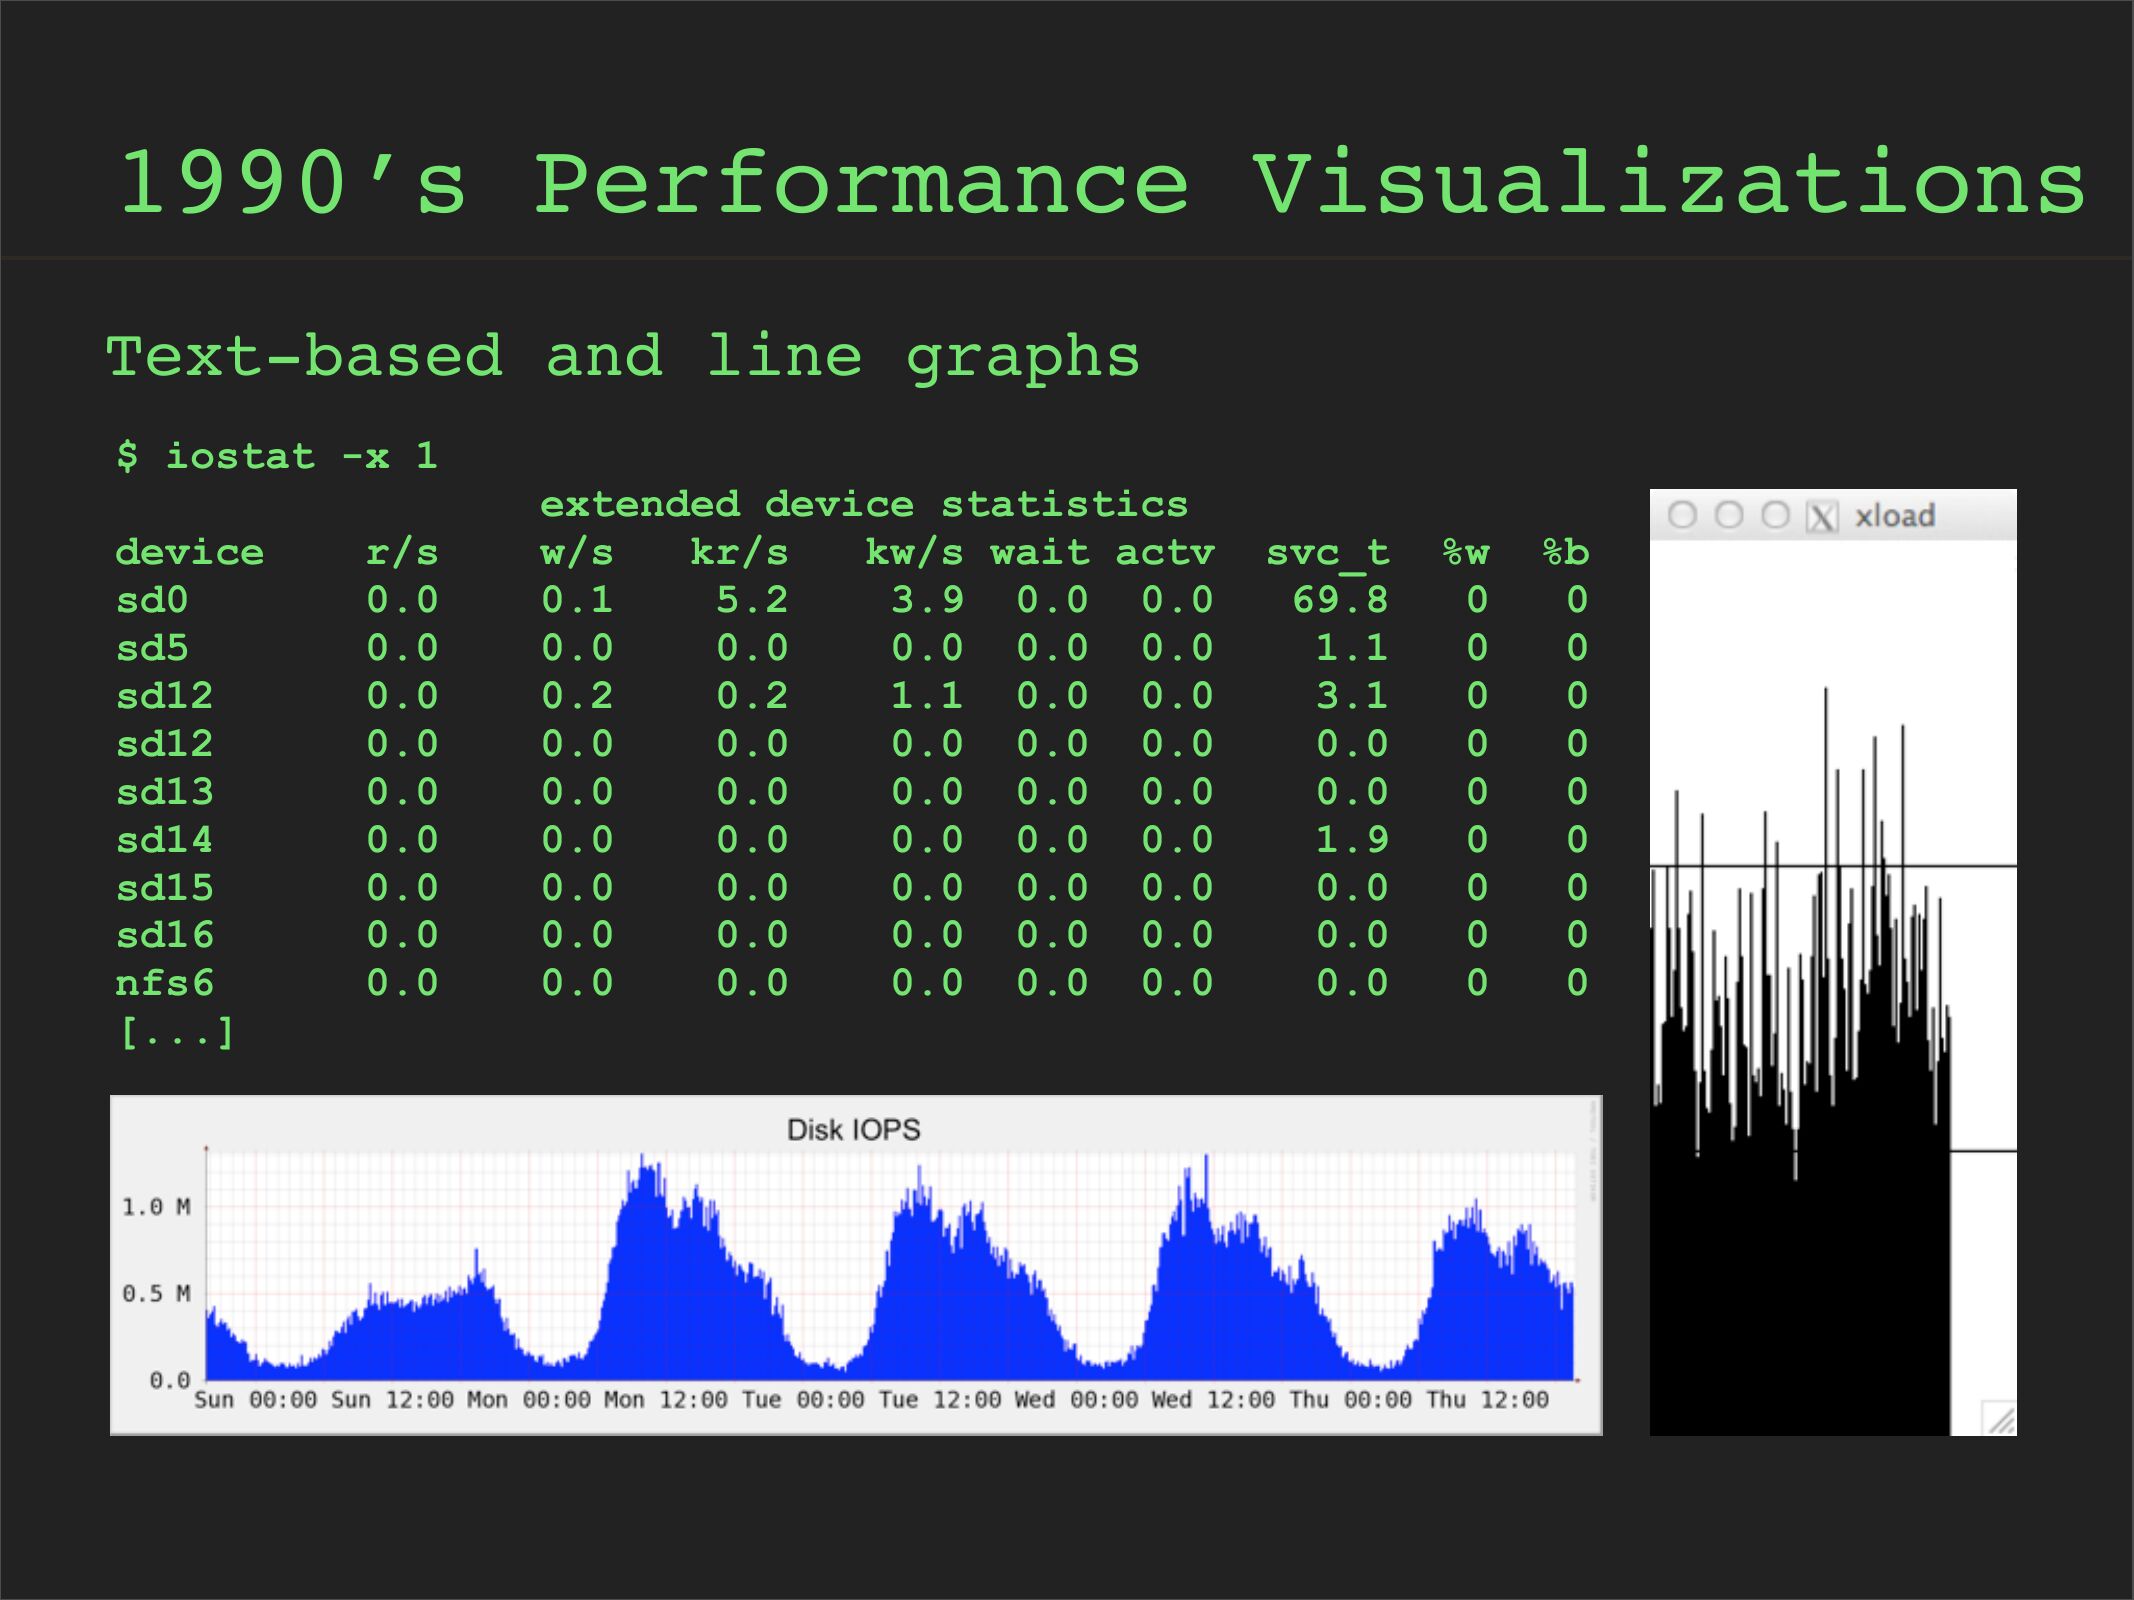
1990’s Performance Visualizations
Text-based and line graphs
$ iostat -x 1
device
sd0
sd5
sd12
sd12
sd13
sd14
sd15
sd16
nfs6
[...]
r/s
extended device statistics
w/s
kr/s
kw/s wait actv
3.9 0.0 0.0
0.0 0.0 0.0
1.1 0.0 0.0
0.0 0.0 0.0
0.0 0.0 0.0
0.0 0.0 0.0
0.0 0.0 0.0
0.0 0.0 0.0
0.0 0.0 0.0
svc_t
slide 13:
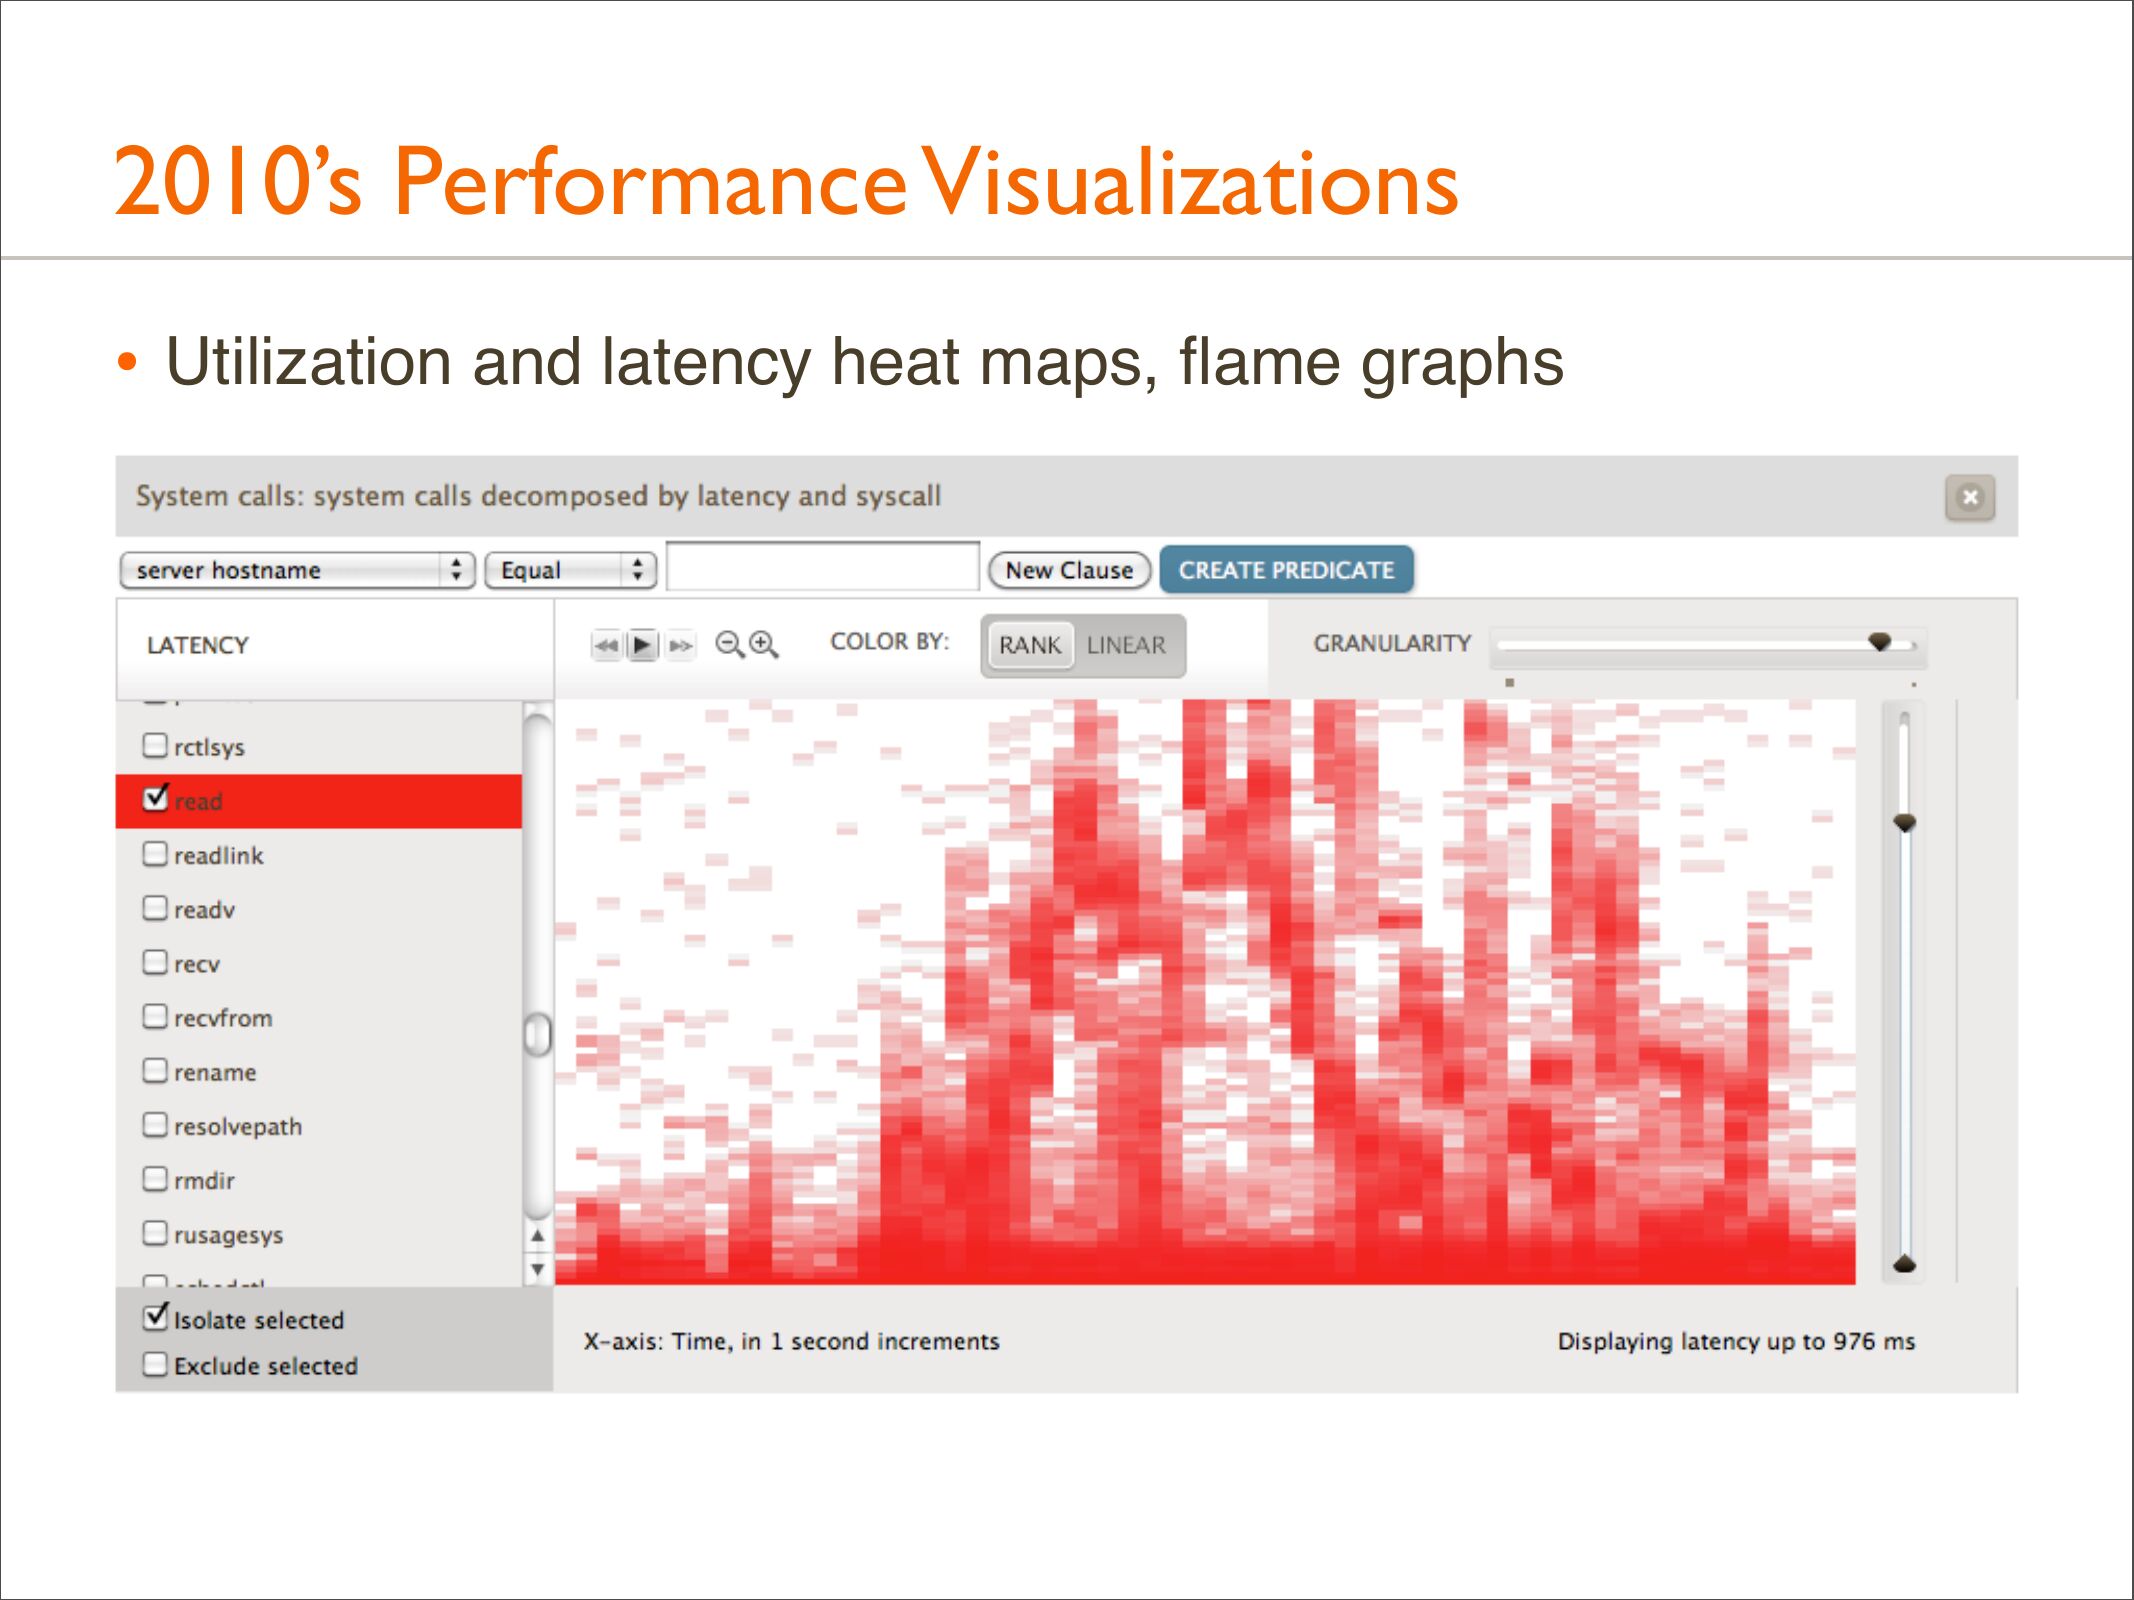
2010’s Performance Visualizations
• Utilization and latency heat maps, flame graphs
slide 14:
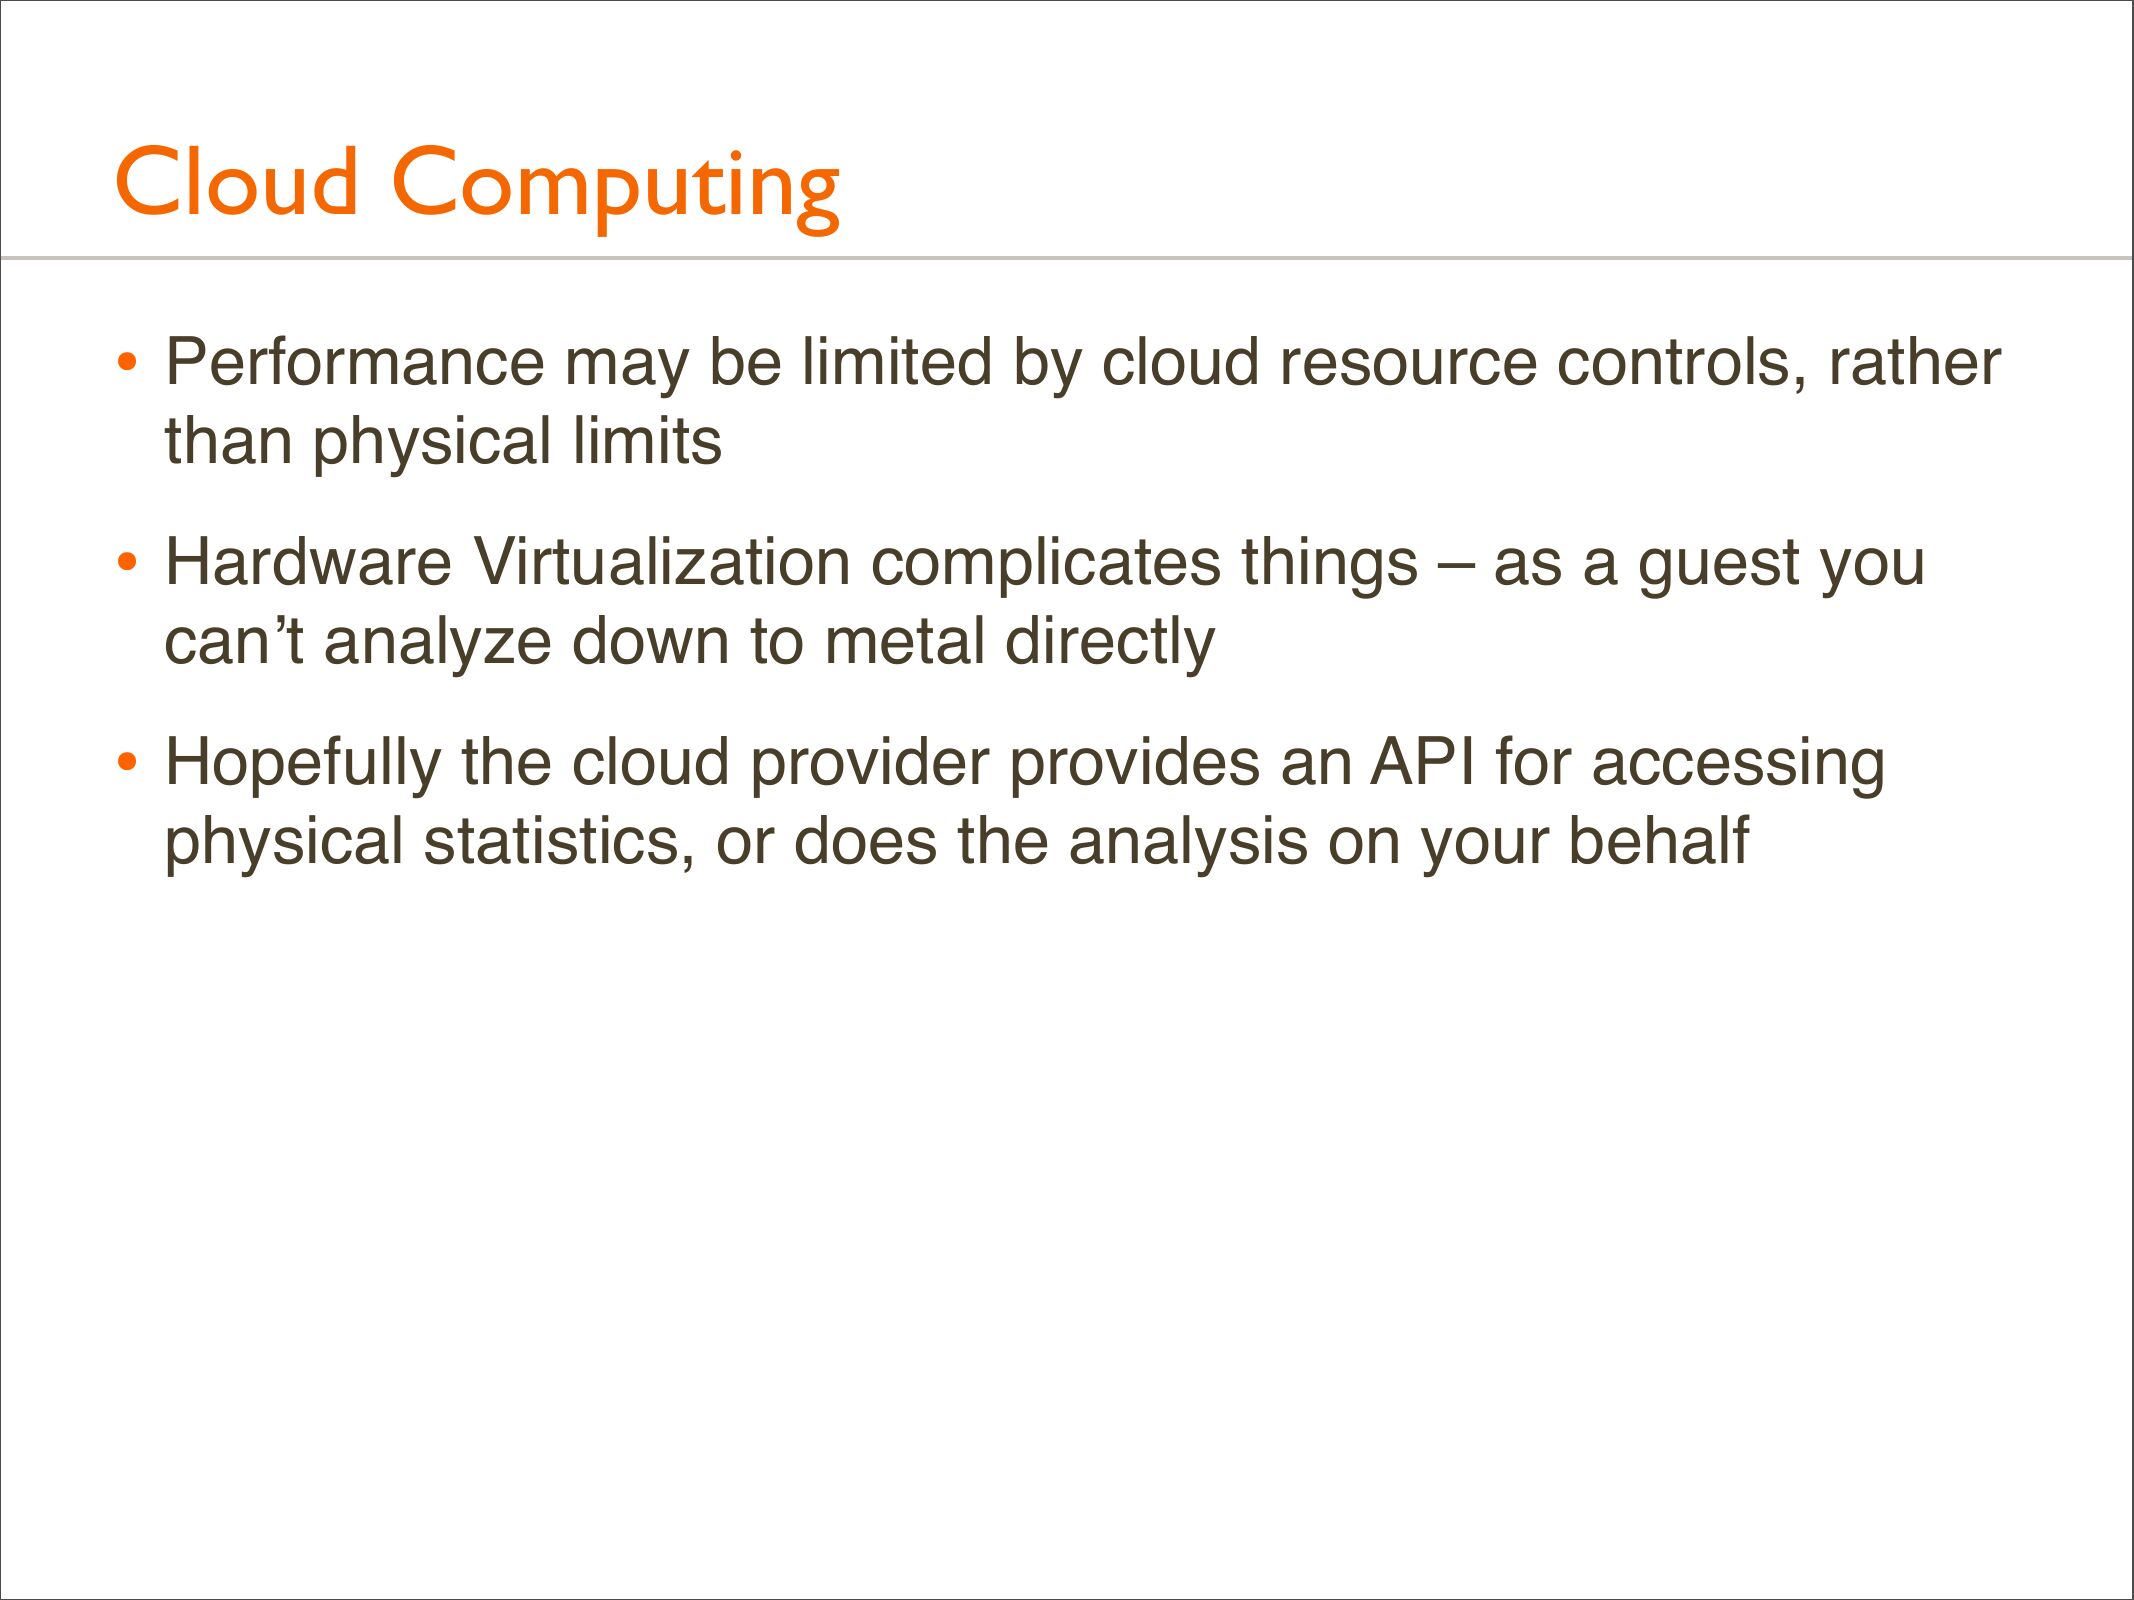
Cloud Computing
• Performance may be limited by cloud resource controls, rather
than physical limits
• Hardware Virtualization complicates things – as a guest you
can’t analyze down to metal directly
• Hopefully the cloud provider provides an API for accessing
physical statistics, or does the analysis on your behalf
slide 15:
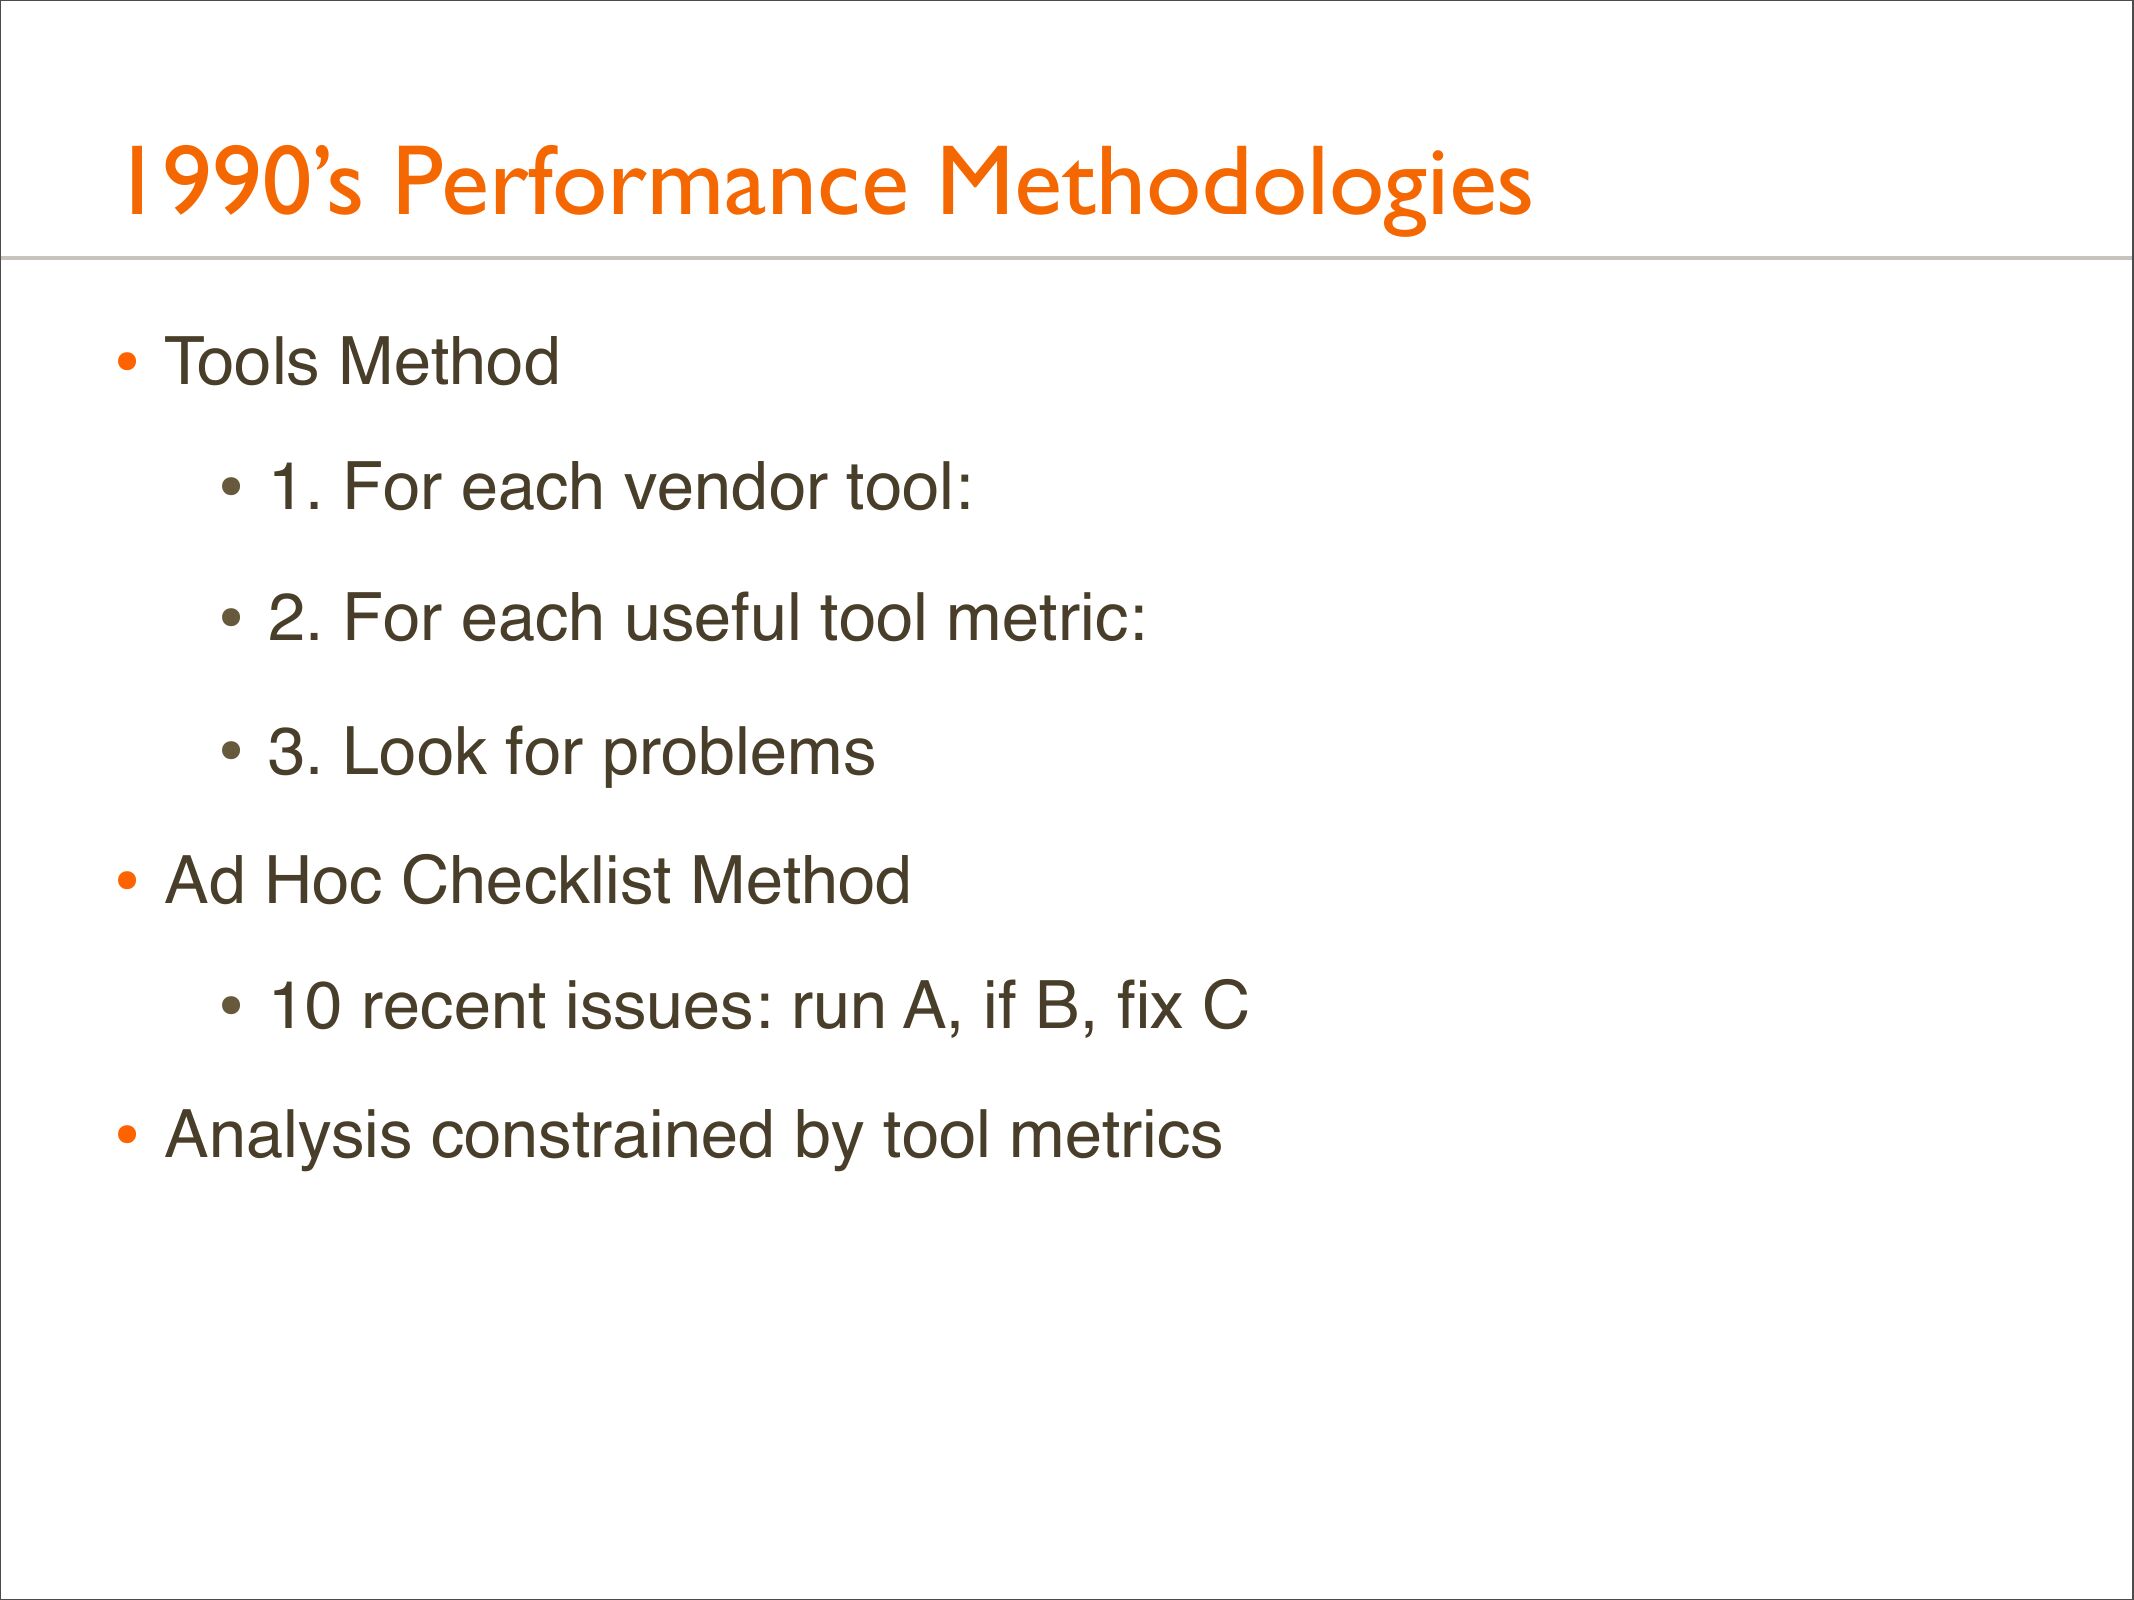
1990’s Performance Methodologies
• Tools Method
• 1. For each vendor tool:
• 2. For each useful tool metric:
• 3. Look for problems
• Ad Hoc Checklist Method
• 10 recent issues: run A, if B, fix C
• Analysis constrained by tool metrics
slide 16:
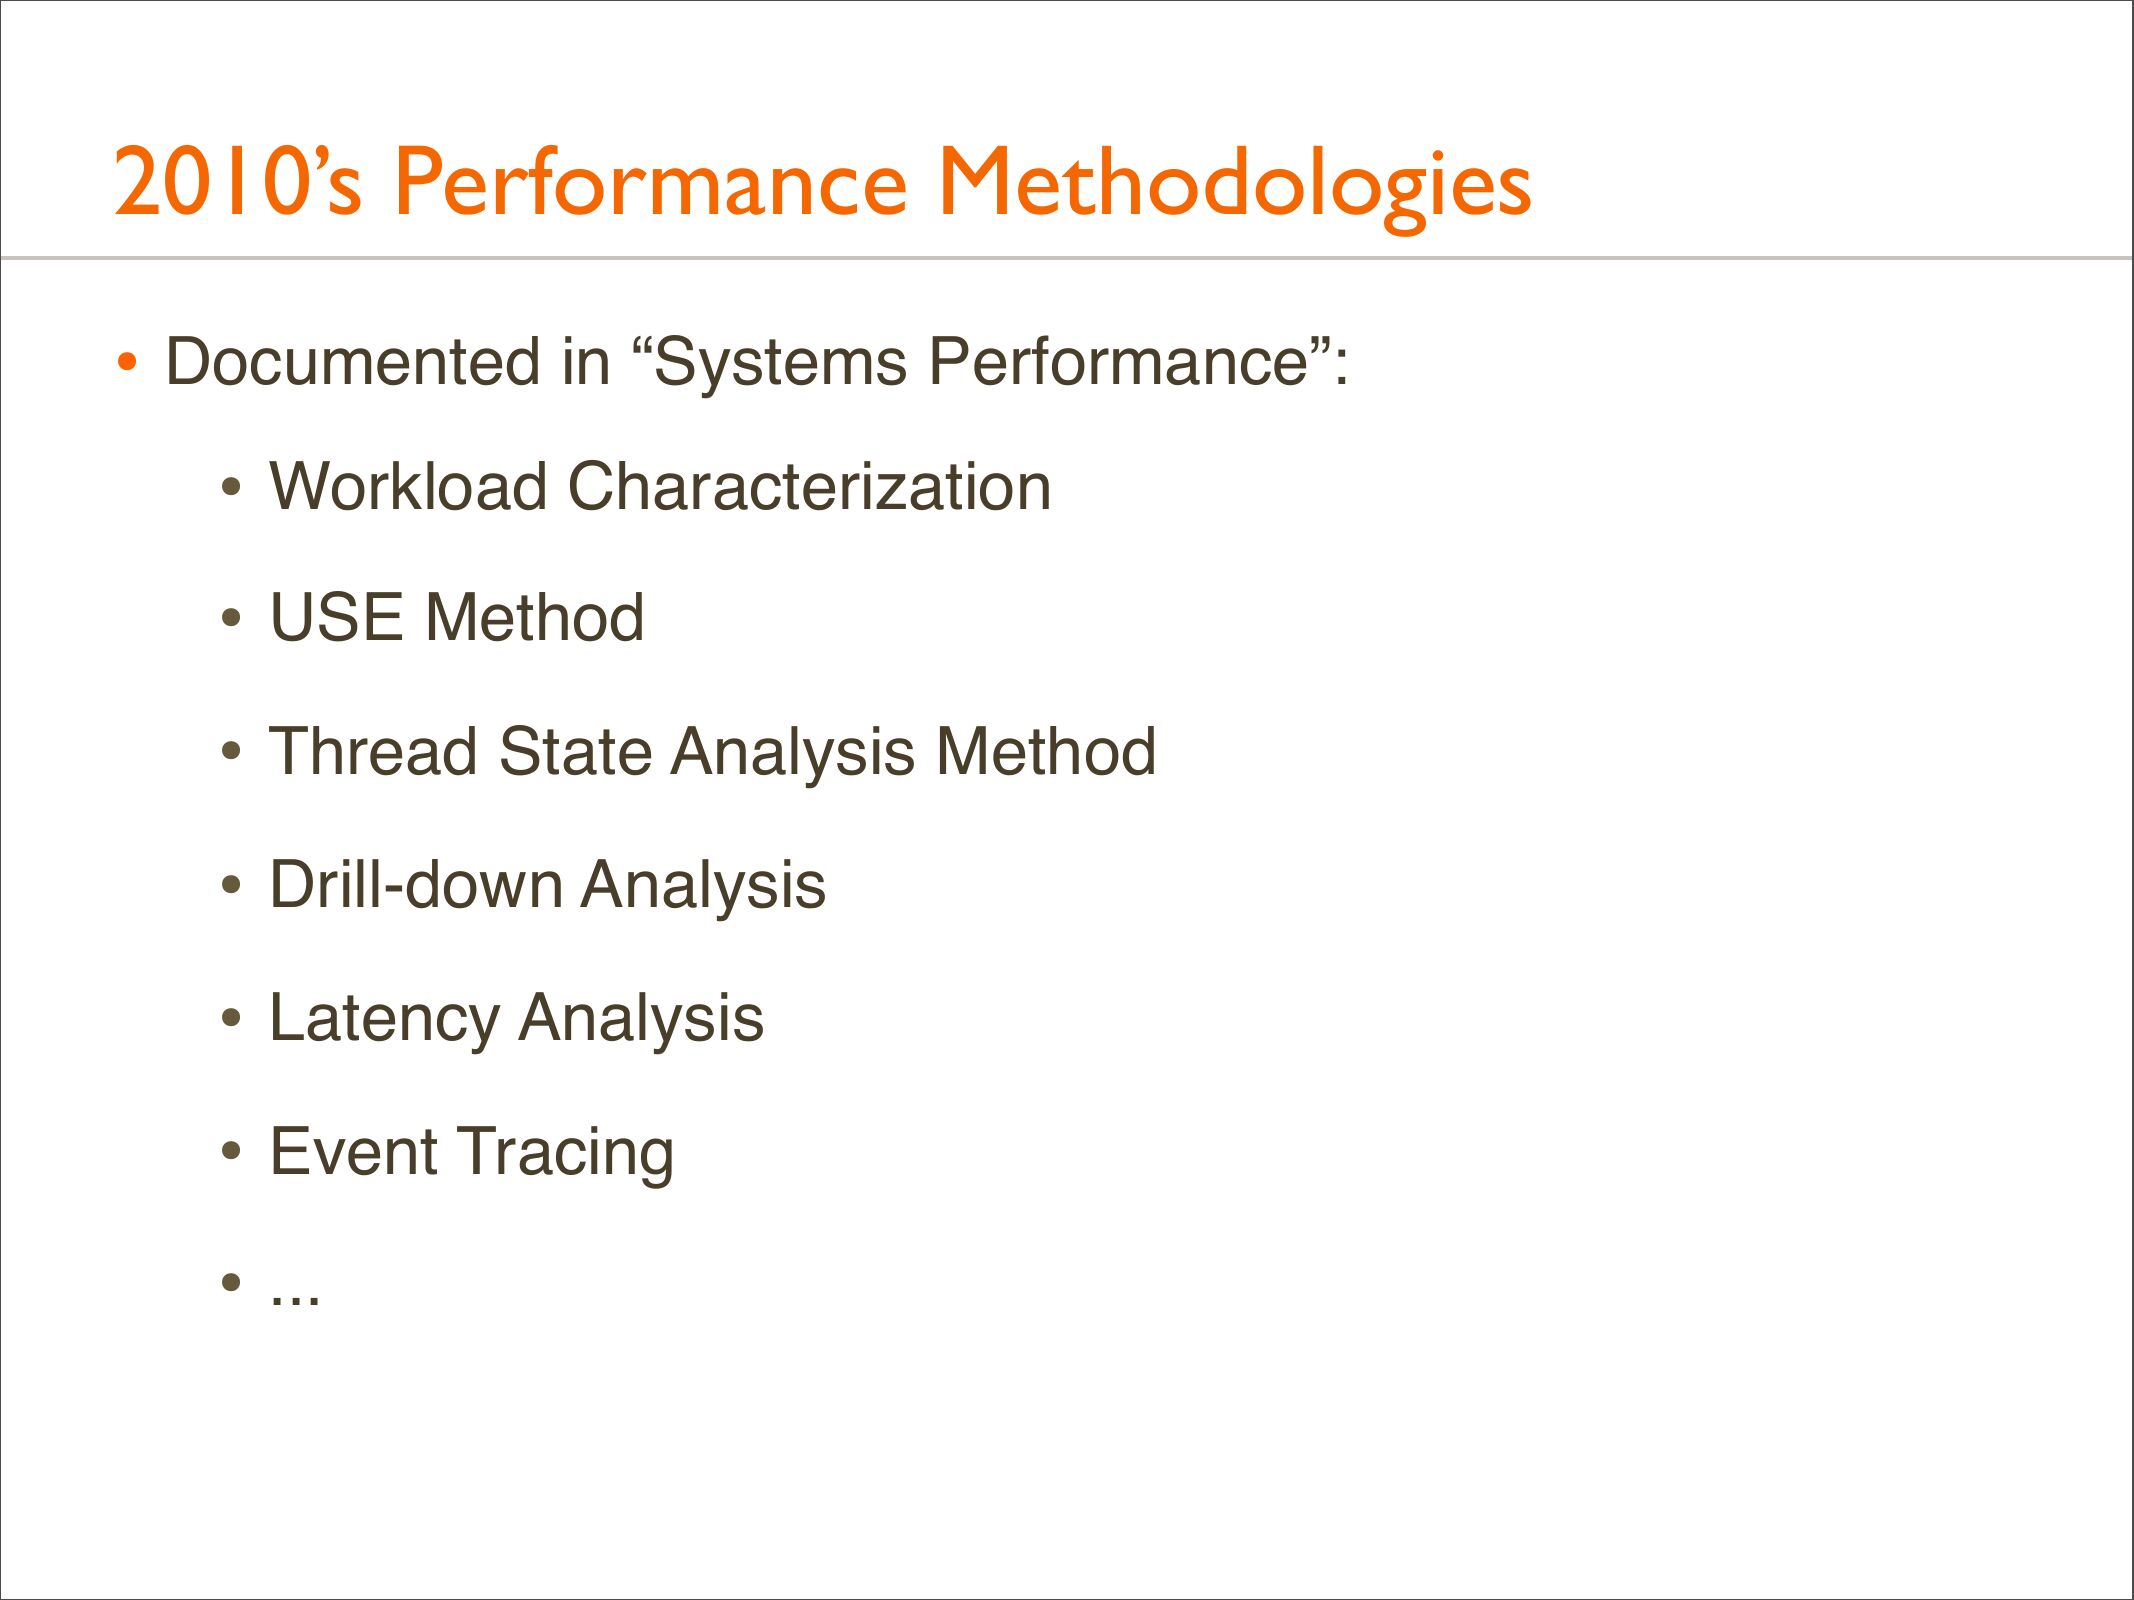
2010’s Performance Methodologies
• Documented in “Systems Performance”:
• Workload Characterization
• USE Method
• Thread State Analysis Method
• Drill-down Analysis
• Latency Analysis
• Event Tracing
• ...
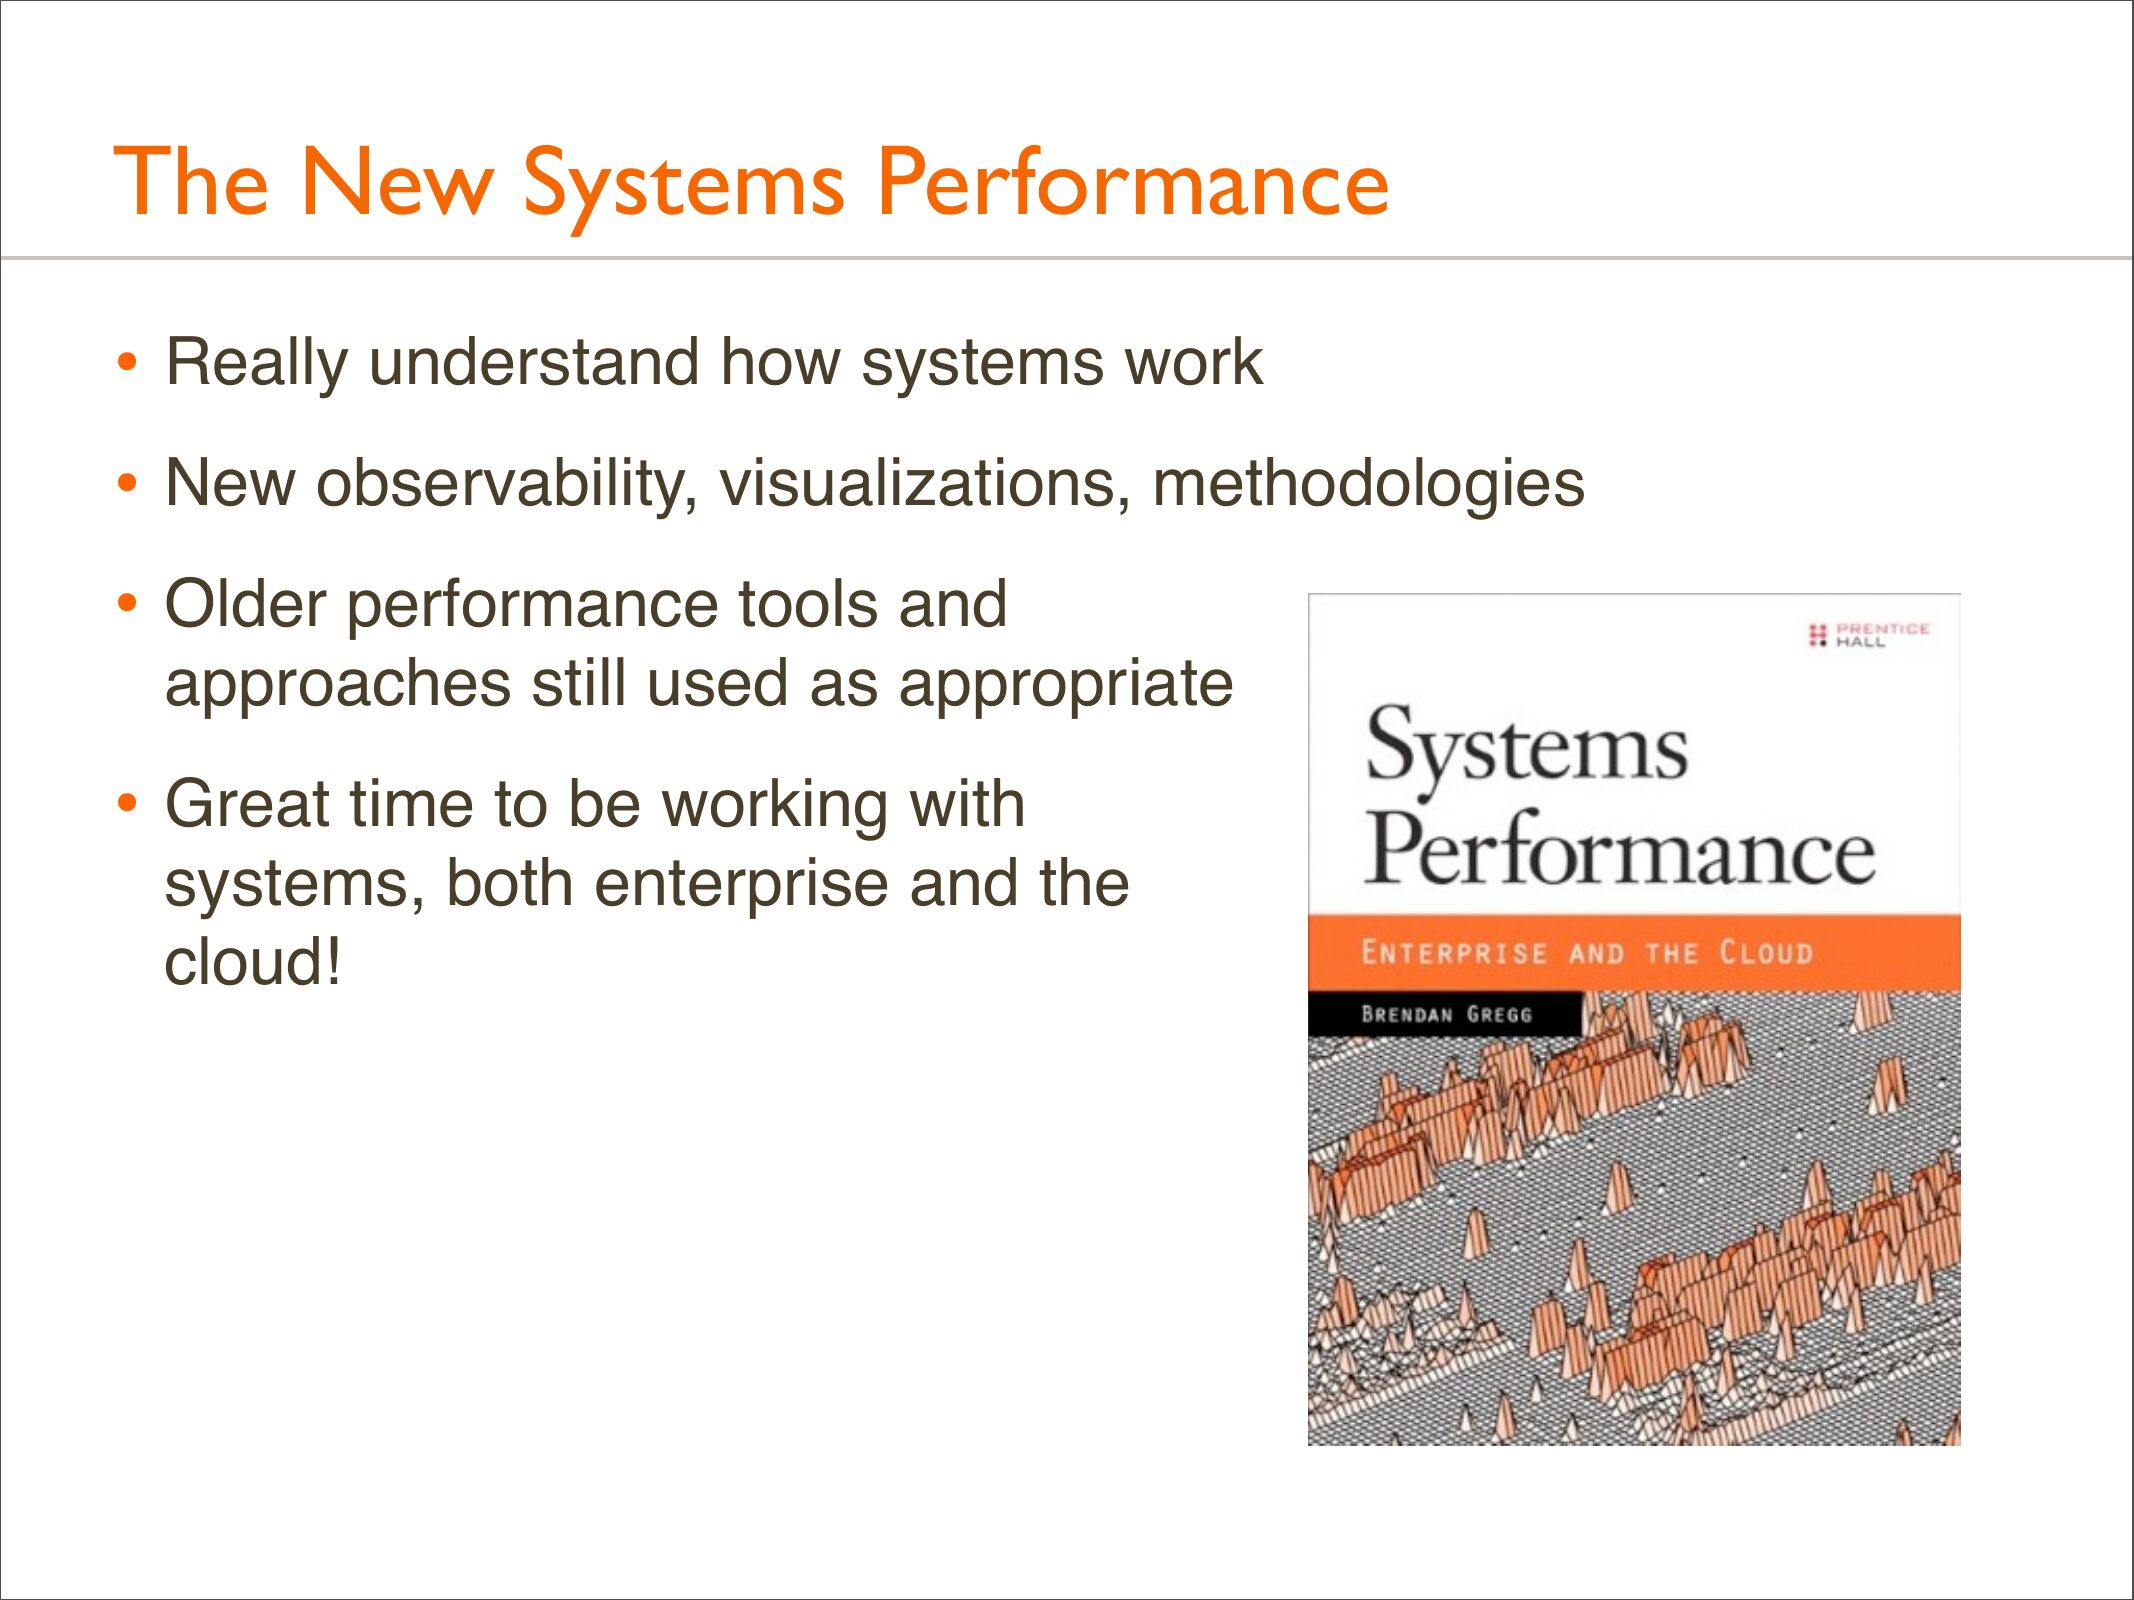
slide 17:
The New Systems Performance
• Really understand how systems work
• New observability, visualizations, methodologies
• Older performance tools and
approaches still used as appropriate
• Great time to be working with
systems, both enterprise and the
cloud!


