

I originally posted this at http://blogs.sun.com/brendan/entry/a_quarter_million_nfs_iops.
Following the launch of the Sun Storage 7000 series, various performance results have been published. It's important when reading these numbers to understand their context, and how that may apply to your workload. Here I'll introduce some numbers regarding NFS read ops/sec, and explain what they mean.
A key feature of the Sun Storage 7410 is DRAM scalability, which can currently reach 128 Gbytes per head node. This can span a significant working set size, and so serve most (or even all) requests from the DRAM filesystem cache. If you aren't familiar with the term working set size, it refers to the amount of data which is frequently accessed. For example, your website could be multiple Tbytes in size, but only tens of Gbytes are frequently accessed hour after hour, which is your working set.
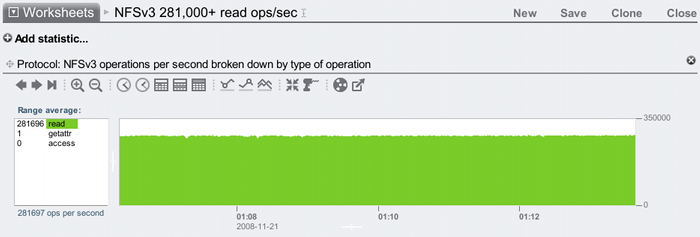
Considering that serving most or all of your working set from DRAM may be a real possibility, it's worth exploring this space. I'll start by finding the upper bound: what's the most NFS read ops/sec I can drive. Here are screenshots from Analytics that shows sustained NFS read ops/sec from DRAM. Starting with NFSv3:
And now NFSv4:
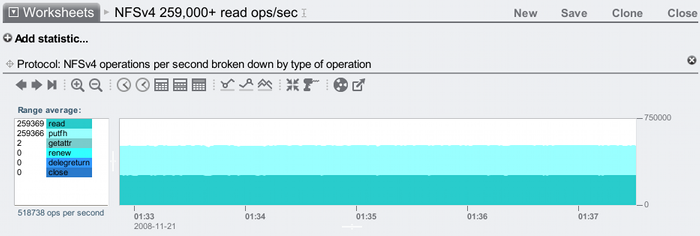
Both beating 250,000 NFS random read ops/sec from a single head node – great to see!
Questions when considering performance numbers
To understand these numbers, you must understand the context. These are the sort of questions you can ask yourself, along with the answers for those results above:
- Is this clustered?
- Is the product for sale? What is its price/performance?
- What is the target, and is it a max config?
- What are the clients?
- What is the network?
- What is the workload?
- What is the working set size?
- How is the result calculated?
- Was the target fully utilized?
- Were the clients or network saturated?
- Who gathered the data and why?
- When you see incredible performance results, check whether this is the aggregated result of multiple servers acting as a cluster. For this result I'm using a single Sun Storage 7410 – no cluster.
- Yes (which should also have the price.)
- It's a Sun Storage 7410 with 128 Gbytes of DRAM, 4 sockets of quad-core AMD Opteron 2300 MHz CPU, and 2 x 2x10 GigE cards. It's not a max config since it isn't in a cluster, and it only has 5 JBODs (although that didn't make a difference with the DRAM test above.)
- 20 blades, each with 2 sockets of Intel Xeon quad-core 1600 MHz CPUs, 6 Gbytes of DRAM, and 2 x 1 Gig network ports. With more and faster clients it may be possible to beat these results.
- The clients are connected to a switch using 1 GigE, and the 7410 connects to the same switch using using 10 GigE. All ports are connected, so the 7410 is balanced across its 4 x 10 GigE ports.
- Each client is running over 20 processes which randomly read from files over NFS, with a 1 byte I/O size. Many performance tests these days will involve multiple threads and/or processes to check scaling; any test that only uses 1 thread on 1 client isn't showing the full potential of the target.
- 100 Gbytes. This is important to check – it shouldn't be so tiny as to be served from CPU caches, if the goal is to test DRAM.
- It's measured on the 7410, and is the average seen in the Analytics window for the visible time period (5+ mins). Be very careful with results measured from the clients, as they can include client caching.
- In this case, yes. If you are reading numbers to determine maximum performance, check whether the benchmark is intended to measure that. Some aren't!
- Just a common benchmark problem to look out for, especially telltale when results cap at about 120 Mbytes/sec (hmm, you mean 1 GigE?). If the client or network becomes saturated, you've benchmarked them as well as the target server – probably not the intent. In the above test I maxed out neither.
- I gathered these results as part of Fishworks performance analysis to check what the IOPS limits may be. They aren't Sun official results. I thought of blogging about them a couple of weeks after running the tests (note the dates in the screenshot), and used Analytics to go back in time and take some screenshots.
The above list covers many subtle issues to help you avoid them (don't learn them the hard way).
Traps to watch out for regarding IOPS
For IOPS results, there are some specific additional questions to consider:
- Is this from cache?
- What is the I/O size?
- Is the value an average, and for how long?
- What is the latency?
- Yes, which is the point of this test, as this 7410 has 128 Gbytes of DRAM.
- 1 byte! This was about checking what the limit may be, as a possible upper bound. An average I/O size of 1 Kbyte or 8 Kbytes is going to drop this result, as there is more work by the clients and server to do. If you are matching this to your workload, find out what your average I/O size is and look for results at that size.
- These are both 5+ minute averages. Be wary of tiny intervals that may show unsustainable results.
- Just as a 1 byte I/O size may make this value unrealistic, so may the latency for heavy IOPS results. Disks can be pushed to some high IOPS values by piling on more and more client threads, but the average I/O latency becomes so bad it is impractical. The latency isn't shown in the above screenshot!
Being more realistic: 8 Kbyte I/O with latency
The aim of the above was to discuss context, and to show how to understand a great result – such as 250,000+ NFS IOPS – by knowing what questions to ask. The two key criticisms for this result would be that it was for 1 byte I/Os, and that latency wasn't shown at all. Here I'll redo this with 8 Kbyte I/Os, and show how Analytics can display the NFS I/O latency. I'll also wind back to 10 clients, only use 1 of the 10 GigE ports on the 7410, and I'll gradually add threads to the clients until each is running 20:
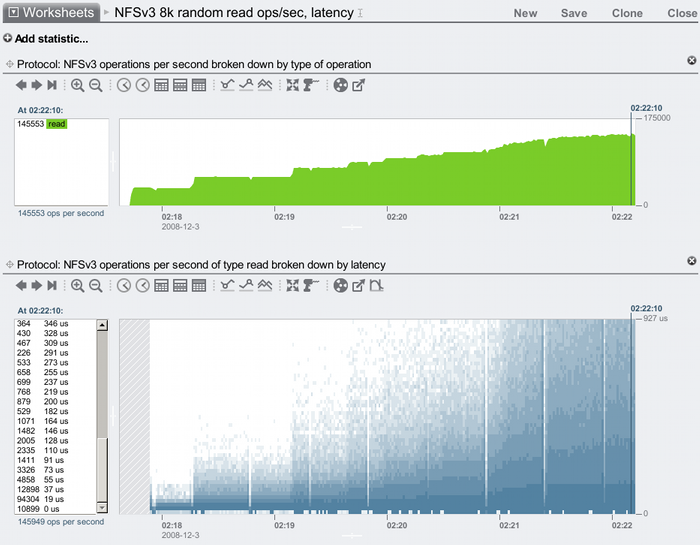
The steps in the NFSv3 ops/sec staircase are where I'm adding more client threads.
I've reached over 145,000 NFSv3 read ops/sec, and this is not the maximum the 7410 can do (I'll need to use a second 10 GigE port to take this further). The latency does increase as more threads queue up, here it is plotted as a heat map with latency on the y-axis (the darker the pixel, the more I/Os were at that latency for that second). At our peak (which has been selected by the vertical line), most of the I/Os were faster than 55 us (0.055 milliseconds), which can be seen in the numbers in the list on the left.
Note that this is the NFSv3 read ops/sec delivered to the 7410 after the client NFS driver has processed the 8 Kbyte I/Os, which decided to split some of the 8 Kbyte reads into 2 x 4 Kbyte NFS reads (pagesize). This means the workload became a mixed 4k and 8k read workload, for which 145,000 IOPS is still a good value. (I'm tempted to redo this for just 4 Kbyte I/Os to keep things simpler, but perhaps this is another useful lesson in the perils of benchmarking – the system doesn't always do what it is asked.)
Reaching 145,000 4+ Kbyte NFS cached read ops/sec without blowing out latency is a great result, and it's the latency that really matters (and from latency comes IOPS). On the topic of latency and IOPS, I do need to post a follow up for the next level after DRAM: no, not disks, it's the L2ARC using SSDs in the Hybrid Storage Pool.