

I originally posted this at http://blogs.sun.com/brendan/entry/slog_screenshots.
I previously posted screenshots of the L2ARC: the ZFS second level cache which uses read optimized SSDs ("Readzillas") to cache random read workloads. That's the read side of the Hybrid Storage Pool. On the write side, the ZFS separate intent log (SLOG) can use write optimized SSDs (which we call "Logzillas") to accelerate performance of synchronous write workloads.
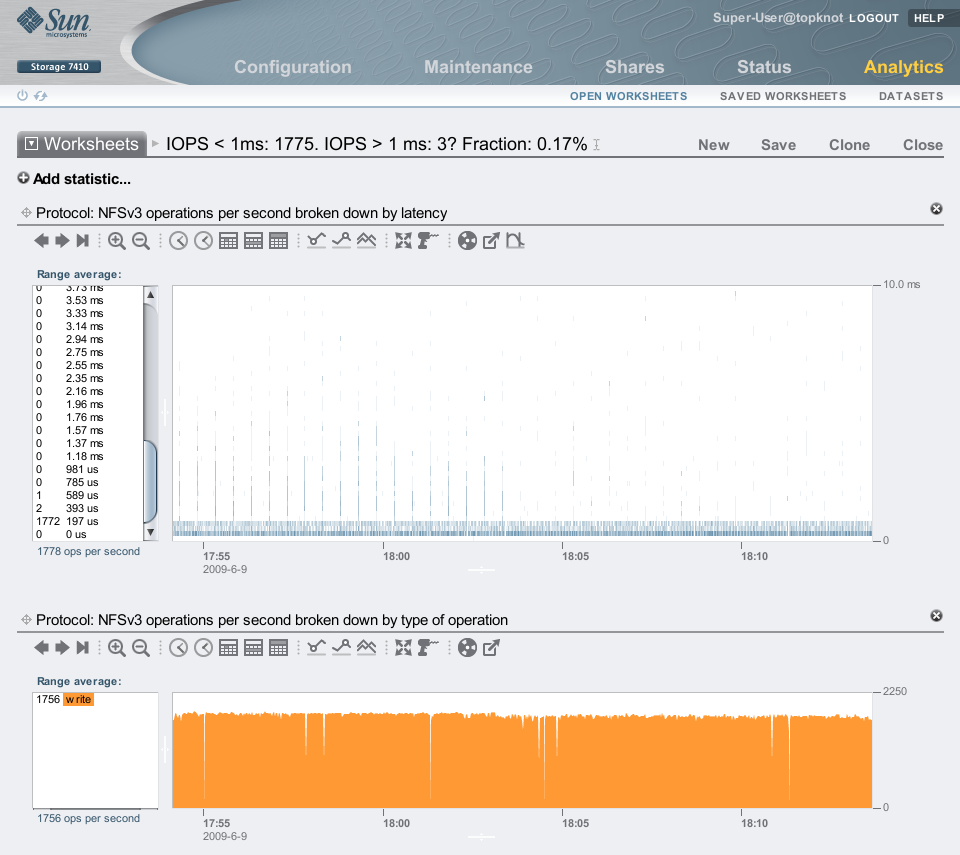
In the screenshots that follow I'll show how Logzillas have delivered 12x more IOPS and over 20x reduced latency for a synchronous write workload over NFS. These screenshots are from Analytics on the Sun Storage 7000 series. In particular, the following heat map shows the dramatic reduction in NFS latency when turning on the Logzillas:
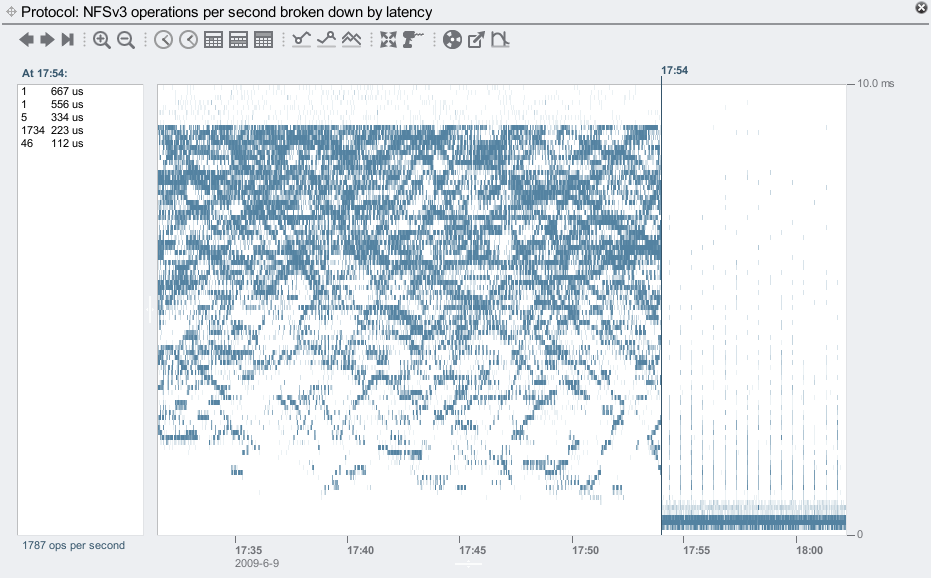
Before the 17:54 line, latency was at the mercy of spinning 7200 RPM disks, and reached as high as 9 ms. After 17:54, these NFS operations were served from Logzillas, which consistently delivered latency much lower than 1 ms. Click for a larger screenshot.
What is a Synchronous Write?
While the use of Logzilla devices can dramatically improve the performance of synchronous write workloads, what is a synchronous write?
When an application writes data, if it waits for that data to complete writing to stable storage (such as a hard disk), it is a synchronous write. If the application requests the write but continues on without waiting (the data may is buffered in the filesystem's DRAM cache, but not yet written to disk), it is an asynchronous write. Asynchronous writes are faster for the application, and is the default behavior.
There is a down side to asynchronous writes: the application doesn't know if the write completed successfully. If there is a power outage before the write could be flushed to disk, the write will be lost. For some applications such as database log writers, this risk is unacceptable, and so they perform synchronous writes instead.
There are two forms of synchronous writes: individual I/O which is written synchronously, and groups of previous writes which are synchronously committed.
Individual synchronous writes
Write I/O will become synchronous when:
- A file is opened using a flag such as O_SYNC or O_DSYNC
- NFS clients use the mount option (if available):
- "sync": to force all write I/O to be synchronous
- "forcedirectio": which avoids caching, and the client may decide to make write I/O synchronous as part of avoiding its cache
Synchronously committing previous writes
Rather than synchronously writing each individual I/O, an application may synchronously commit previous writes at logical checkpoints in the code. This can improve performance by grouping the synchronous writes. On ZFS these may also be handled by the SLOG and Logzilla devices. These are performed by:
- An application calling fsync()
- An NFS client calling commit. It can do this because:
- It closed a file handle that it wrote to (Solaris clients can avoid this using the "nocto" mount option)
- Directory operations (file creation and deletion)
- Too many uncommitted buffers on a file (eg, FreeBSD/MacOS X)
Examples of Synchronous Writes
Applications that are expected to perform synchronous writes include:
- Database log writers: eg, Oracle's LGWR.
- Expanding archives over NFS: eg, tar creating thousands of small files.
- iSCSI writes on the Sun Storage 7000 series (unless lun write cache is enabled.)
The second example is easy to demonstrate. Here I've taken firefox-1.5.0.6-source.tar, a tar file containing 43,000 small files, and unpacked it to an NFS share (tar xf). This will create thousands of small files, which becomes a synchronous write workload as these files are created. Writing of the file contents will be asynchronous, it is just the act of creating the file entries in their parent directories which is synchronous. I've unpacked this tar file twice, the first time without Logzilla devices and the second time with. The difference is clear:
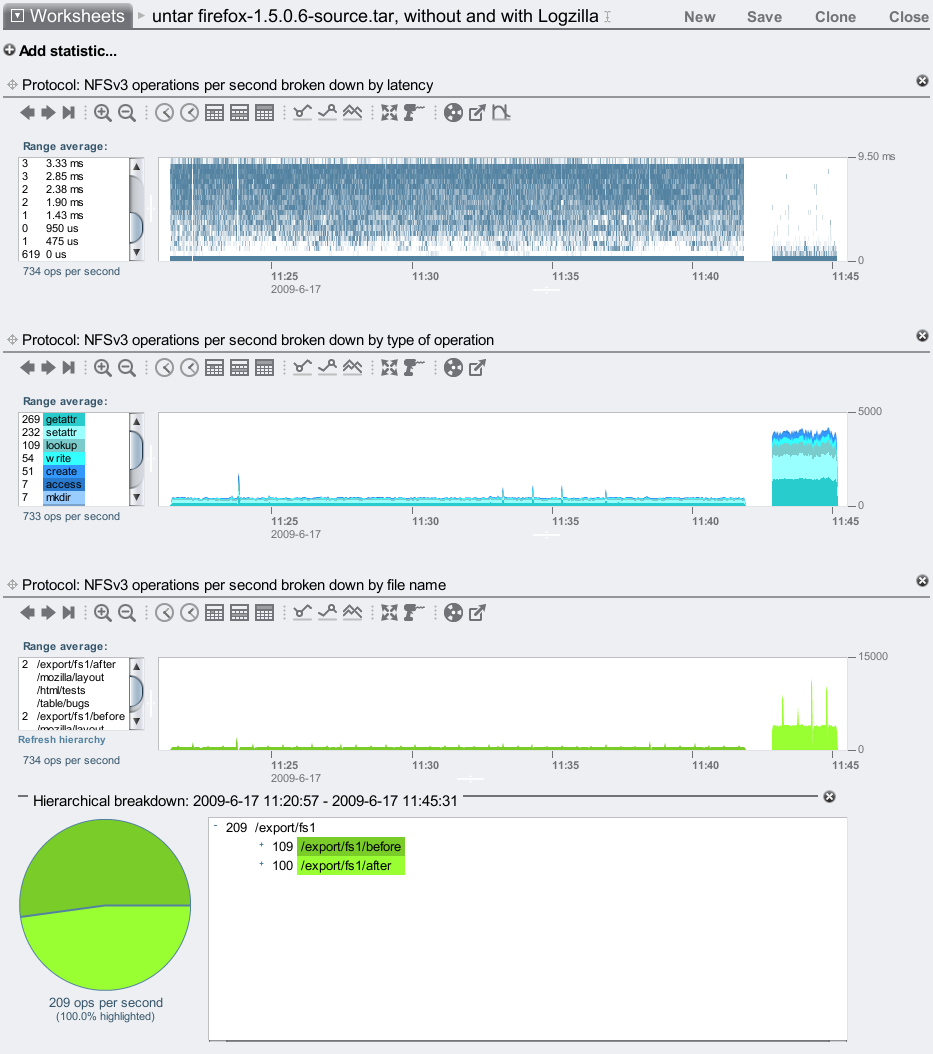
Without logzillas, it took around 20 minutes to unpack the tar file. With logzillas, it took around 2 minutes: 10x faster. This improvement is also visible as the higher number of NFS ops/sec, and the lower NFS latency in the heat map.
For this example I used a Sun Storage 7410 with 46 disks and 2 Logzillas, stored in 2 JBODs. The disks and Logzillas can serve many more IOPS than I've demonstrated here, as I'm only running a single threaded application from a single modest client as a workload.
Identifying Synchronous Writes
How do you know if your particular write workload is synchronous or asynchronous? There are many ways to check, here I'll describe a scenario where a client side application is performing writes to an NFS file server.
Client side
To determine if your application is performing synchronous writes, one way is to debug the open system calls. The following example uses truss on Solaris (try strace on Linux) on two different programs:
client# truss -ftopen ./write
4830:   open64("outfile", O_WRONLY|O_CREAT, 0644)            = 3
client# truss -ftopen ./odsync-write
4832:   open64("outfile", O_WRONLY|O_DSYNC|O_CREAT, 0644)    = 3
The second program (odsync-write) opened its file with the O_DSYNC flag, so subsequent writes will be synchronous. In these examples, the program was executed by the debugger, truss. If the application is already running, on Solaris you can use pfiles to examine the file flags for processes (on Linux, try lsof.)
Apart from tracing the open() syscall, also look for frequent fsync() or fdsync() calls, which synchronously commit the previously written data.
Server side
If you'd like to determine if you have a synchronous write workload from the NFS server itself, you can't run debuggers like truss on the target process (since it's running on another host), so instead we'll need to examine the NFS protocol. You can do this either with packet sniffers (snoop, tcpdump), or with DTrace if it and its NFS provider are available:
topknot# dtrace -n 'nfsv3:::op-write-start { @[args[2]->stable] = count(); }'
dtrace: description 'nfsv3:::op-write-start ' matched 1 probe
^C
        2             1398
Here I've frequency counted the "stable" member of the NFSv3 write protocol, which was "2" some 1,398 times. 2 is a synchronous write workload (FILE_SYNC), and 0 is for asynchronous:
enum stable_how {
        UNSTABLE = 0,
        DATA_SYNC = 1,
        FILE_SYNC = 2
};
If you don't have DTrace available, you'll need to dig this out of the NFS protocol headers. For example, using snoop:
# snoop -d nxge4 -v | grep NFS
[...]
NFS:  ----- Sun NFS -----
NFS:
NFS:  Proc = 7 (Write to file)
NFS:  File handle = [A2FC]
NFS:   7A6344B308A689BA0A00060000000000073000000A000300000000001F000000
NFS:  Offset = 96010240
NFS:  Size   = 8192
NFS:  Stable = FSYNC
NFS:
That's an example of a synchronous write.
The NFS client may be performing a synchronous-write-like workload by frequently calling the NFS commit operation. To identify this, use whichever tool is available to show NFS operations broken down by type (Analytics on the Sun Storage 7000; nfsstat -s on Solaris)
SLOG and Synchronous Writes
The following diagram shows the difference when adding a seperate intent log (SLOG) to ZFS:
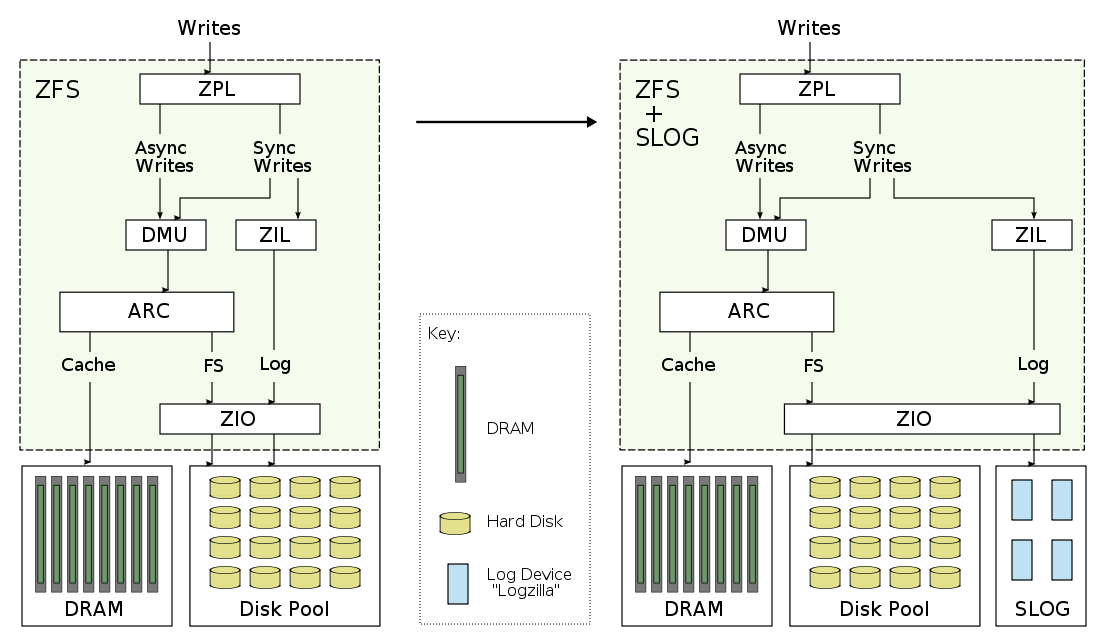
Major components:
- ZPL: ZFS POSIX Layer. Primary interface to ZFS as a filesystem.
- ZIL: ZFS Intent Log. Synchronous write data for replay in the event of a crash.
- DMU: Data Management Unit. Transactional object management.
- ARC: Adaptive Replacement Cache. Main memory filesystem cache.
- ZIO: ZFS I/O Pipeline. Processing of disk I/O.
For the most detailed information of these and the other components of ZFS, you can browse their source code at the ZFS Source Tour.
When data is asynchronously written to ZFS, it is buffered in memory and gathered periodically by the DMU as transaction groups, and then written to disk. Transaction groups either succeed or fail as a whole, and are part of the ZFS design to always deliver on disk data consistency.
This periodical writing of transaction groups can improve asynchronous writes by aggregating data and streaming it to disk. However the interval of these writes is in the order of seconds, which makes it unsuitable to serve synchronous writes directly, as the application would stall until the next transaction group was synced. Enter the ZIL.
ZFS Intent Log
The ZIL handles synchronous writes by immediately writing their data and information to stable storage, an "intent log", so that ZFS can claim that the write completed. The written data hasn't reached its final destination on the ZFS filesystem yet, that will happen sometime later when the transaction group is written. In the meantime, if there is a system failure, the data will not be lost as ZFS can replay that intent log and write the data to its final destination. This is a similar principle as Oracle redo logs, for example.
Separate Intent Log
In the above diagram on the left, the ZIL stores the log data on the same disks as the ZFS pool. While this works, the performance of synchronous writes can suffer as they compete for disk access along with the regular pool requests (reads, and transaction group writes.) Having two different workloads compete for the same disk can negatively effect both workloads, as the heads seek between the hot data for one and the other. The solution is to give the ZIL its own dedicated "log devices" to write to, as pictured on the right. These dedicated log devices form the separate intent log: the SLOG.
Logzilla
By writing to dedicated log devices, we can improve performance further by choosing a device which is best suited for fast writes. Enter Logzilla. Logzilla was the name we gave to write-optimized flash-memory-based solid state disks (SSDs.) Flash memory is known for slow write performance, so to improve this the Logzilla device buffers the write in DRAM and uses a super-capacitor to power the device long enough to write the DRAM buffer to flash, should it lose power. These devices can write an I/O as fast as 0.1 ms (depends on I/O size), and do so consistently. By using them as our SLOG, we can serve synchronous write workloads consistently fast.
Speed + Data Integrity
It's worth mentioning that when ZFS synchronously writes to disk, it uses new ioctl()s to ensure that the data is flushed properly to the disk platter, and isn't just buffered on the disk's write cache (which is a small amount of DRAM inside the disk itself.) Which is exactly what we want to happen – that's why these writes are synchronous. Other filesystems didn't bother to do this (eg, UFS), and believed that data had reached stable storage when it may have just been cached. If there was a power outage, and the disk's write cache is not battery backed, then those writes would be lost, which means data corruption for the filesystem. Since ZFS waits for the disk to properly write out the data, synchronous writes on ZFS are slower than other filesystems, but they are also correct. There is a way to turn off this behaviour in ZFS (zfs_nocacheflush), and ZFS will perform as fast or faster than other filesystems for synchronous writes – but you've also sacrificed data integrity, so this is highly unrecommended. By using fast SLOG devices on ZFS, we get both speed and data integrity.
I won't go into too much more detail of the inner workings of the SLOG, which is best described by the author Neil Perrin.
Screenshots
To create a screenshot to best show the effect of Logzillas, I applied a synchronous write workload over NFS from a single threaded process on a single client. The target was the same 7410 used for the tar test, which has 46 disks and 2 Logzillas. At first I let the workload run with the Logzillas disabled, then enabled them:
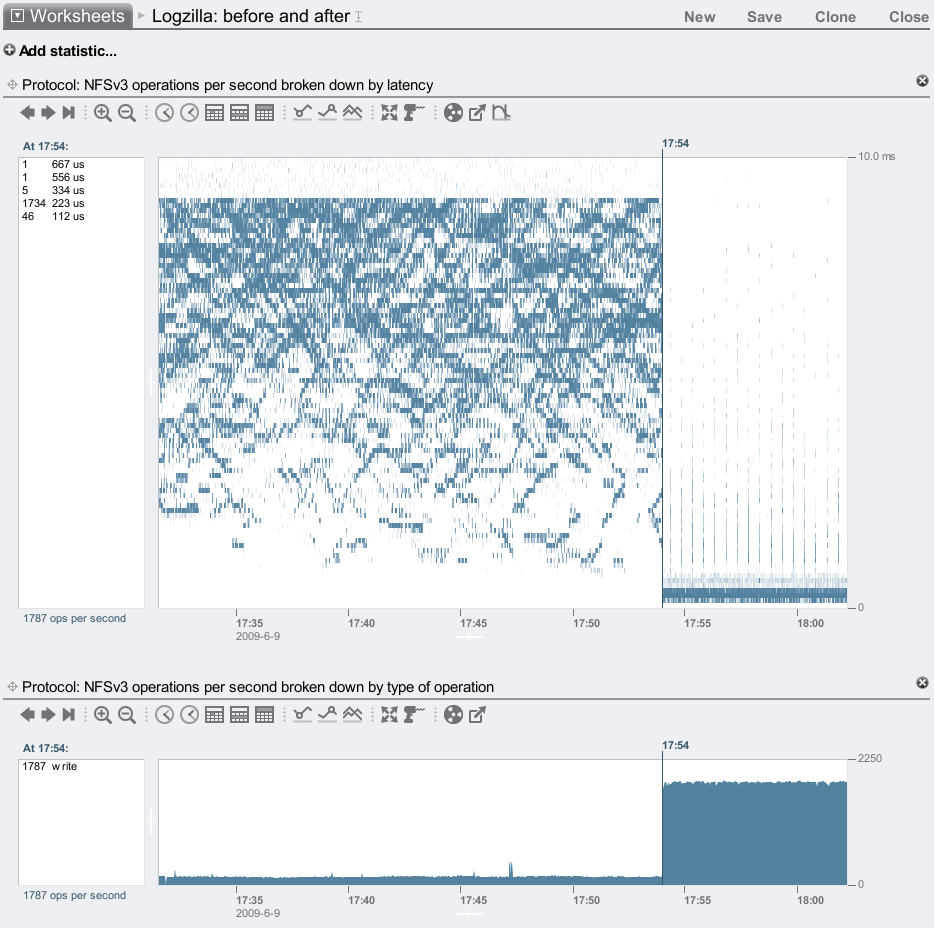
This is the effect of adding 2 Logzillas to a pool of 46 disks, on both latency and IOPS. My last post discussed the odd latency pattern that these 7200 RPM disks causes for synchronous writes, which looks a bit like an icy lake.
The latency heat map shows the improvement very well, but it's also shown something unintended: These heat maps use a false color palette which draws the faintest details much darker than they (linearly) should be, so that they are visible. This has made visible a minor and unrelated performance issue: those faint vertical trails on the right side of the plot. These were every 30 seconds, and was when ZFS flushed a transaction group to disk, which stalled a fraction of NFS I/O while this happened. The fraction is so small it's almost lost in the rounding, but appears to be about 0.17% when examining the left panel numbers. While minor, we are working to fix it. This perf issue is known internally as the "picket fence". Logzilla is still delivering a fantastic improvement over 99% of the time.
To quantify the Logzilla improvement, I'll now zoom to the before and after periods to see the range averages from Analytics:
Before
With just the 46 disks:
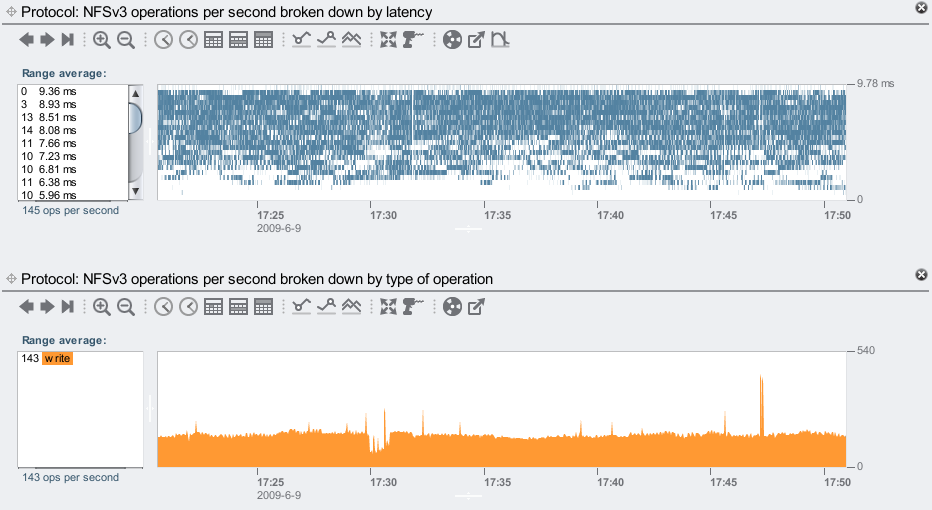
Reading the values from the left panels: with just the 46 disks, we've averaged 143 NFS synchronous writes/sec. Latency has reached as high as 8.93ms. Most of the 8 ms would be worst case rotational latency for a 7200 RPM disk.
After
46 disks + 2 Logzillas:
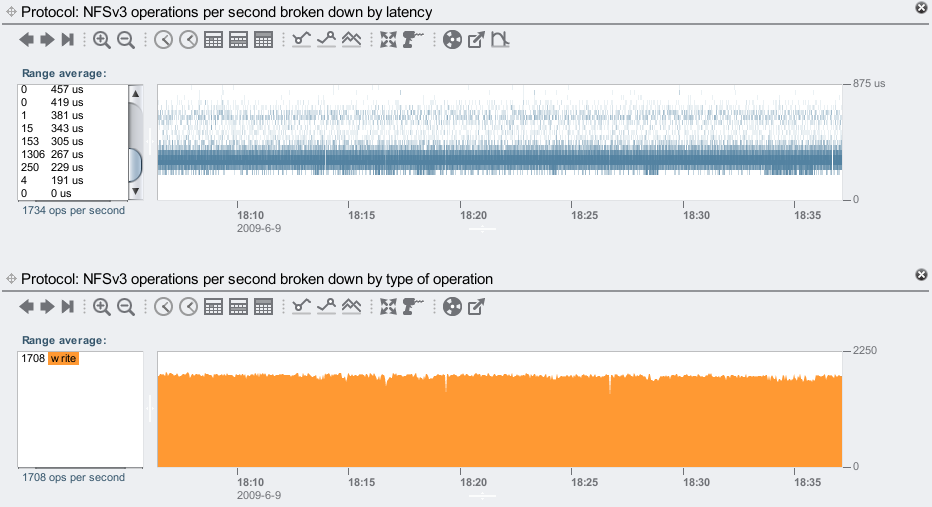
Nice, a tight latency cloud from 229 to 305 microseconds, showing very fast and consistent responses from the Logzillas.
We've now averaged 1,708 NFS synchronous writes/sec: 12x faster than without the Logzillas. Beyond 381 us, latency has rounded down to zero ops/sec, and was mostly in the 267 to 304 microsecond range. Previously latency stretched from a few to over 8 ms, making the delivered NFS latency improvement reach over 20x.
This 7410 and these Logzillas can handle much more than 1,708 synchronous writes/sec, if I apply more clients and threads (I'll show a higher load demo in a moment.)
Disk I/O
Another way to see the effect of Logzillas is through disk I/O. The following shows before and after in separate graphs:
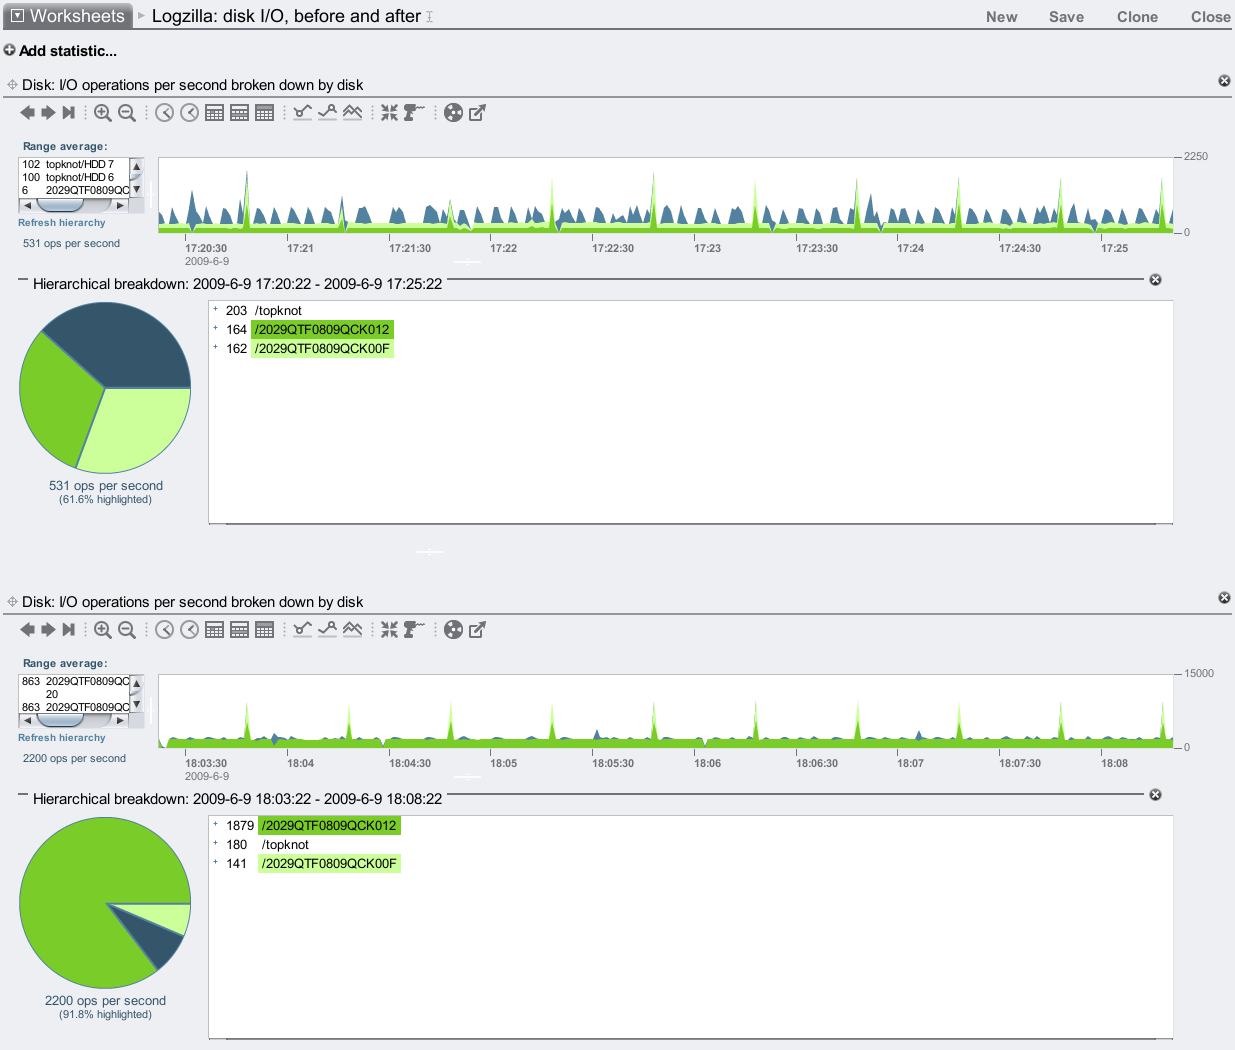
I've used the Hierarchial breakdown feature to highlight the JBODs in green. In the top plot (before), the I/O to each JBOD was equal: about 160 IOPS. After enabling the Logzillas, the bottom plot shows one of the JBODs is now serving over 1800 IOPS, which is the JBOD with the Logzillas in.
There are spikes of IOPS every 30 seconds in both these graphs. That is when ZFS flushes a transaction group to disk, commiting the writes to their final location. Zooming into the before graph:
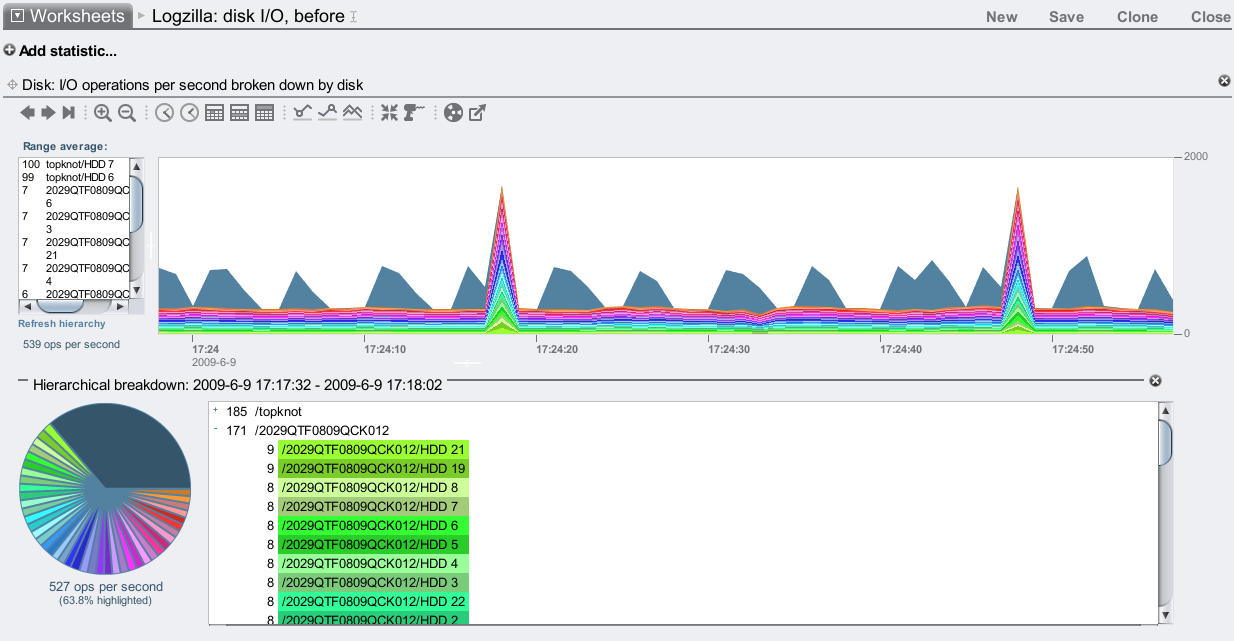
Instead of highlighting JBODs, I've now highlighted individual disks (yes, the pie chart is pretty now.) The non-highlighted slice is for the system disks, which are recording the numerous Analytics statistics I've enabled.
We can see that all the disks have data flushed to them every 30 seconds, but they are also being written to constantly. This constant writing is the synchronous writes being written to the ZFS intent log, which is being served from the pool of 46 disks (since it isn't a separate intent log, yet).
After enabling the Logzillas:
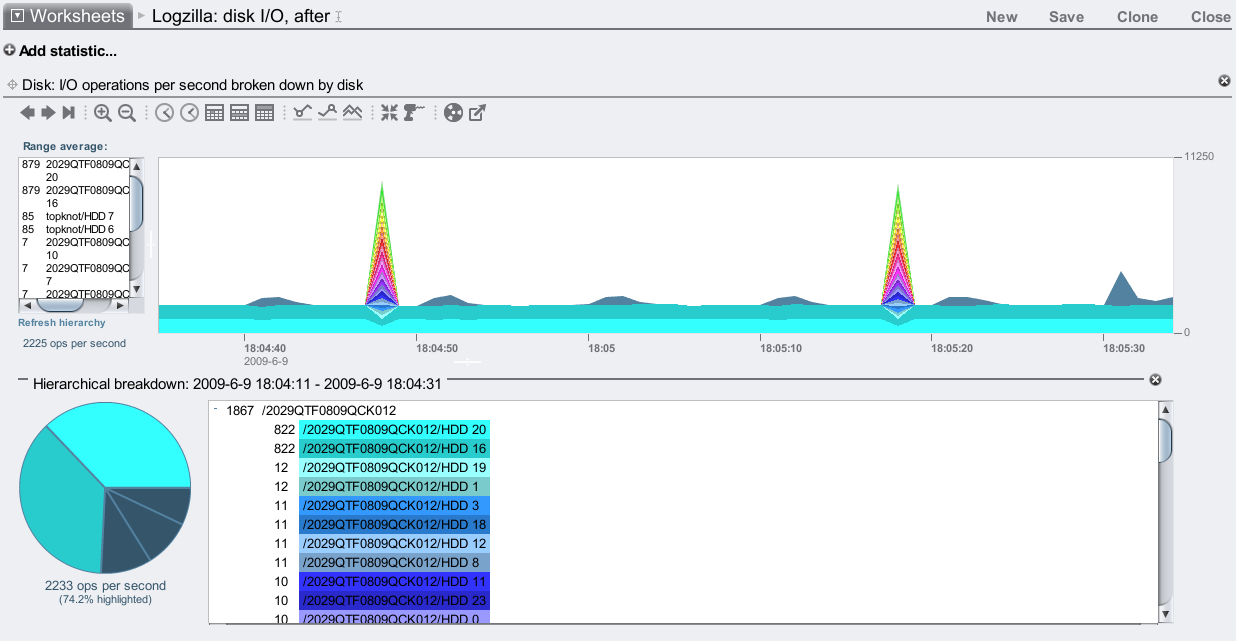
Now those constant writes are being served from 2 disks: HDD 20 and HDD 16, which are both in the /2029...012 JBOD. Those are the Logzillas, and are our separate intent log (SLOG):

I've highlighted one in this screenshot, HDD 20.
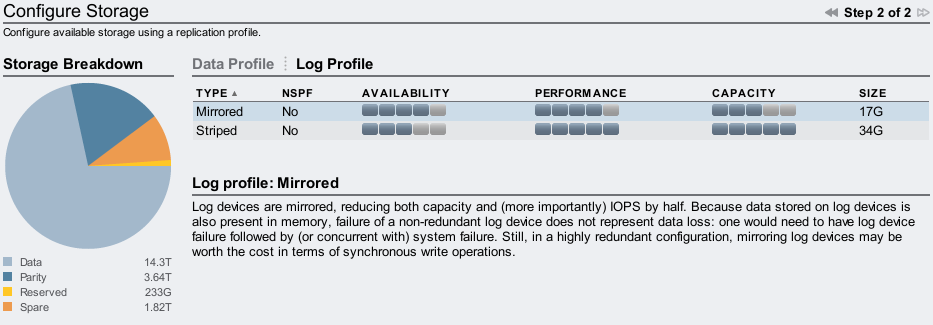
Mirrored Logzillas
The 2 Logzillas I've been demonstrating have been acting as individual log devices. ZFS lists them like this:
topknot# zpool status
  pool: pool-0
 state: ONLINE
[...]
        NAME                                     STATE     READ WRITE CKSUM
        pool-0                                   ONLINE       0     0     0
[...many lines snipped...]
          mirror                                 ONLINE       0     0     0
            c2t5000CCA216CCB913d0                ONLINE       0     0     0
            c2t5000CCA216CE289Cd0                ONLINE       0     0     0
        logs
          c2tATASTECZEUSIOPS018GBYTES00000AD6d0  ONLINE       0     0     0
          c2tATASTECZEUSIOPS018GBYTES00000CD8d0  ONLINE       0     0     0
        spares
          c2t5000CCA216CCB958d0                  AVAIL
          c2t5000CCA216CCB969d0                  AVAIL
Log devices can be mirrored instead (see zpool(1M)), and zpool will list them as part of a "mirror" under "logs". On the Sun Storage 7000 series, it's configurable from the BUI (and CLI) when creating the pool:
With a single Logzilla, if there was a system failure when a client was performing synchronous writes, and if that data was written to the Logzilla but hadn't been flushed to disk, and if that Logzilla also fails, then data will be lost. So it is system failure + drive failure + unlucky timing. ZFS should still be intact.
It sounds a little paranoid to use mirroring, however from experience system failures and drive failures sometimes go hand in hand, so it is understandable that this is often chosen for high availability environments. The default for the Sun Storage 7000 config when you have multiple Logzillas is to mirror them.
Expectations
While the Logzillas can greatly improve performance, it's important to understand which workloads this is for and how well they work, to help set realistic expectations. Here's a summary:
- Logzillas do not help every write workload; they are for synchronous write workloads, as described earlier.
- Our current Logzilla devices for the Sun Storage 7000 family deliver as high as 100 Mbytes/sec each (less with small I/O sizes), and as high as 10,000 IOPS (less with big I/O sizes).
- A heavy multi threaded workload on a single Logzilla device can queue I/O, increasing latency. Use multiple Logzilla devices to serve I/O concurrently.
Stepping up the workload
So far I've only used a single threaded process to apply the workload. To push the 7410 and Logzillas to their limit, I'll multiply this workload by 200. To do this I'll use 10 clients, and on each client I'll add another workload thread every minute until it reaches 20 per client. Each workload thread performs 512 byte synchronous write ops continually. I'll also upgrade the 7410: I'll now use 6 JBODs containing 8 Logzillas and 132 data disks, to give the 7410 a fighting chance against this bombardment.
8 Logzillas
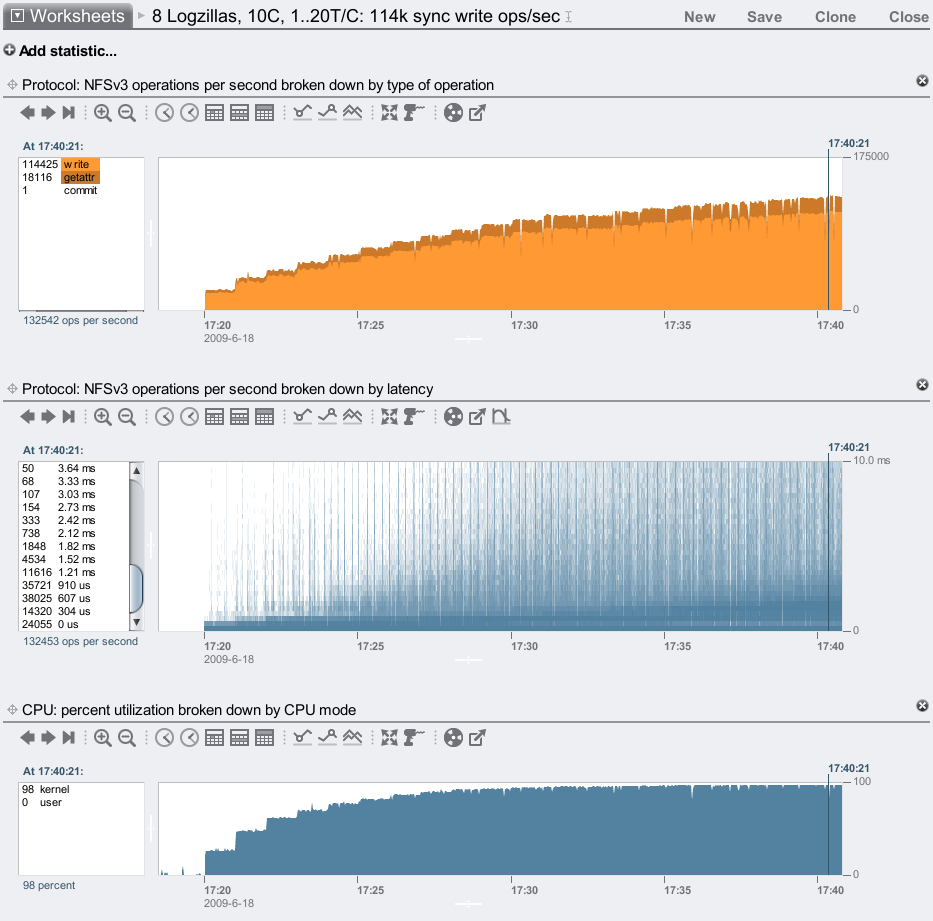
We've reached 114,000 synchronous write ops/sec over NFS, and the delivered NFS latency is still mostly less than 1 ms – awesome! We can study the numbers in the left panel of the latency heat map to quantify this: there were 132,453 ops/sec total, and (adding up the numbers) 112,121 of them completed faster than 1.21 ms, which is 85%.
The bottom plot suggests we have driven this 7410 close to its CPU limit (for what is measured as CPU utilization, which includes bus wait cycles.) The Logzillas are only around 30% utilized. The CPUs are 4 sockets of 2.3 GHz quad core Opteron, and for them to be the limit means a lot of other system components are performing extremely well. There are now faster CPUs available, which we need to make available in the 7410 to push that ops/sec limit much higher than 114k.
No Logzillas
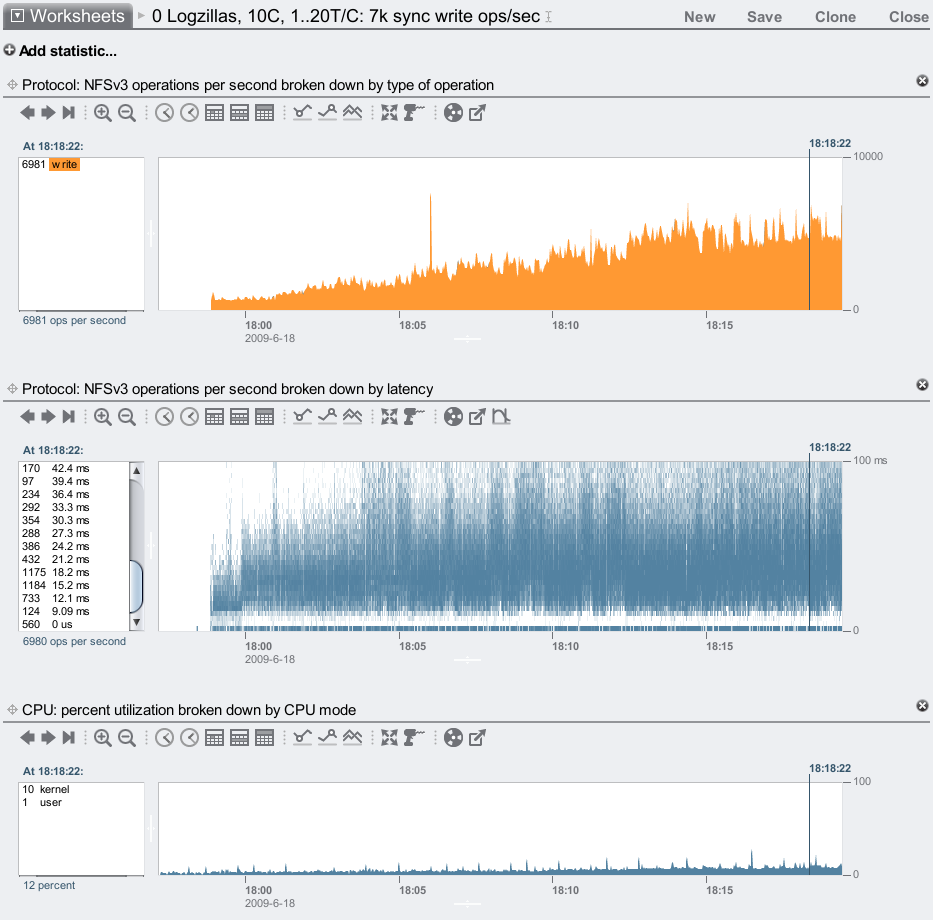
Ouch! We are barely reaching 7,000 sync write ops/sec, and our latency is pretty ordinary, often 15 ms and higher. These 7,200 RPM disks are not great to serve synchronous writes from alone, which is why Adam created the Hybrid Storage Pool model.
When comparing the above two screenshots, note the change in the vertical scale. With Logzillas, the NFS latency heat map is plotted to 10 ms; without, it's plotted to 100 ms to span the higher latency from the disks.
Config
The full description of the server and clients used in the above demo is:
Server
- Sun Storage 7410
- Latest software version: 2009.04.10.2.1,1-1.15
- 4 x quad core AMD Opteron 2.3 GHz CPUs
- 128 Gbytes DRAM
- 2 x SAS HBAs
- 1 x 2x10 GbE network card (1 port connected)
- 6 JBODs (136 disks total, each 1 Tbyte 7,200 RPM)
- Storage configured with mirroring
- 8 Logzillas (installed in the JBODs)
Clients
- 10 x blade servers, each:
- 2 x quad core Intel Xeon 1.6 GHz CPUs
- 3 Gbytes DRAM
- 2 x 1 GbE network ports (1 connected)
- mounted using NFSv3, wsize=512
The clients are a little old. The server is new, and is a medium sized 7410.
What about 15K RPM disks?
I've been comparing the performance of write optimized SSDs vs cheap 7,200 RPM SATA disks as the primary storage. What if I used high quality 15K RPM disks instead?
Rotational latency will be half. What about seek latency? Perhaps if the disks are of higher quality the heads move faster, but they also have to move further to span the same data (15K RPM disks are usually lower density than 7,200 RPM disks), so that could cancel out. They could have a larger write cache, which would help. Lets be generous and say that 15K RPM disks are 3x faster than 7,200 RPM disks.
So instead of reaching 7,000 sync write ops/sec, perhaps we could reach 21,000 if we used 15K RPM disks. That's a long way short of 114,000 using Logzilla SSDs. Comparing the latency improvement also shows this is no contest. In fact, to comfortably match the speed of current SSDs, disks would need to spin at 100K RPM and faster. Which may never happen. SSDs, on the other hand, are getting faster and faster.
What about NVRAM cards?
For the SLOG devices, I've been using Logzillas: write optimized SSDs. It is possible to use NVRAM cards as SLOG devices, which should deliver much faster writes than Logzilla can. While these may be an interesting option, there are some down sides to consider:
- Slot budget: A Logzilla device consumes one disk bay, whereas an NVRAM card would consume one PCI-E slot. The Sun Storage 7410 has 6 PCI-E slots, and a current maximum of 288 disk bays. Consuming disk bays for Logzillas may be a far easier trade-off than spending one or more PCI-E slots.
- Scaling: With limited slots compared to disk bays, the scaling of PCI-E cards will be very coarse. With Logzillas in disk bays it is easier to fine tune their number to match the workload, and to keep scaling to a dozen devices and more.
- Complexity: One advantage of the Logzillas is that they exist in the pool of disks, and in clustered environments can be accessed by the other head node during failover. NVRAM cards are in the head node, and would require a high speed cluster interconnect to keep them both in sync should one head node fail.
- Capacity: NVRAM cards have limited capacity when compared to Logzillas to begin with, and in clustered environments the available capacity from NVRAM cards may be halved (each head node's NVRAM cards must support both pools.) Logzillas are currently 18 Gbytes, whereas NVRAM cards are currently around 2 Gbytes.
- Thermal: Battery backed NVRAM cards may have large batteries attached to the card. Their temperature envelope needs to be considered when placed in head nodes, which with CPUs and 10 GbE cards can get awfully hot (batteries don't like getting awfully hot.)
- Cost: These are expected to be more expensive per Gbyte than Logzillas.
Switching to NVRAM cards may also make little relative difference for NFS clients over the network, when other latencies are factored. It may be an interesting option, but it's not necessarily better than Logzillas.
Conclusion
For synchronous write workloads, the ZFS intent log can use dedicated SSD based log devices (Logzillas) to greatly improve performance. The screenshots above from Analytics on the Sun Storage 7000 series showed 12x more IOPS and reaching over 20x reduced latency.
Thanks to Neil Perrin for creating the ZFS SLOG, Adam Leventhal for designing it into the Hybrid Storage Pool, and Sun's Michael Cornwell and STEC for making the Logzillas a reality.
Logzillas as SLOG devices work great, making the demos for this blog entry easy to create. It's not every day you find a performance technology that can deliver 10x and higher.