

I originally posted this at http://dtrace.org/blogs/brendan/2011/03/14/mysql-query-latency-with-the-dtrace-pid-provider
In 2007 I wrote some DTrace MySQL onliners and scripts, including mysql_pid_etime.d, which used the DTrace pid provider. Derek Crudgington (now a fellow Joyeur) took this a little further and compiled a MySQL DTrace Kit containing several pid provider-based scripts, which also traced slow query writes. I never went much further with the pid provider since a better way was in development: the USDT-based DTrace mysql provider. This was much easier to use and has a stable (or more stable) interface. I included some mysql provider one-liners and scripts in the DTrace book.
Since joining Joyent, I'm getting to see MySQL in many interesting test and production scenarios. Some of these are running MySQL versions that don't have the stable mysql provider available, and so I'm back to writing MySQL DTrace scripts using the pid provider. I'll share some of these here, now that I've discussed the pid provider risks. In summary: these aren't supported, will likely break on different mysqld versions, and should only be considered if the stable mysql provider is not available.
Query Latency
Many environments monitor query latency via the slow query log, which by default is logging queries greater than one second. To get a better handle on query performance, you can look at the distribution of all queries - not just those greater than one second. The tool below, mysqld_pid_latency.d, does this using DTrace and the pid provider. I've been using this as the first tool to reach for when analyzing MySQL performance issues: no matter what other tools are telling you (eg, disks are busy), this shows the effect on MySQL latency right now - and whether there is a latency problem to begin with.
Instead of the slow query log, DTrace can pull out nanosecond query latency as a distribution plot - anytime.
For regular users of DTrace, this script output and the script itself may be self-explanatory. I'll explain what's going on here in detail anyway. First, some sample output:
# ./mysqld_pid_latency.d -p 15489
Tracing mysqld... Hit Ctrl-C for report.
^C
MySQL queries: 22033; query latency (ns):

           value  ------------- Distribution ------------- count
            1024 |                                         0
            2048 |                                         77
            4096 |@                                        349
            8192 |                                         125
           16384 |@                                        504
           32768 |@                                        504
           65536 |@@@@                                     2043
          131072 |@@@@@@@@@@@@@@@@@@@@                     10921
          262144 |@@@@@@@@@                                4795
          524288 |@@@                                      1591
         1048576 |@                                        550
         2097152 |                                         204
         4194304 |                                         90
         8388608 |                                         250
        16777216 |                                         19
        33554432 |                                         5
        67108864 |                                         4
       134217728 |                                         1
       268435456 |                                         1
       536870912 |                                         0
The script prints the total number of queries traced (22033), and shows a distribution of query latency. The left column is the query time in nanoseconds, the right shows the number of queries at that latency, and the middle column is an ASCII representation of the distribution. The left column is a power of 2 scale, where the value means "at least". So, the most queries (count == 10921) fell into the "at least" 131,072 nanosecond range, which is between 131,072 and 262,143 nanoseconds. Expressing this in other units: this is between 131 and 262 microseconds (us), or 0.13 and 0.26 milliseconds (ms).
This distribution shows that most queries are fairly fast (0.13 - 0.26 ms), which means they are probably operating out of DRAM cache.
Here is another distribution to consider:
# ./mysqld_pid_latency.d -p 726
Tracing mysqld... Hit Ctrl-C for report.
^C
MySQL queries: 21848; query latency (ns):

           value  ------------- Distribution ------------- count
            1024 |                                         0
            2048 |                                         56
            4096 |@                                        393
            8192 |                                         91
           16384 |@                                        450
           32768 |@                                        318
           65536 |@@@                                      1571
          131072 |@@@@@@@@@@@@@@@                          8396
          262144 |@@@@@@@@                                 4386
          524288 |@@@@                                     2102
         1048576 |@@                                       1329
         2097152 |@                                        763
         4194304 |@                                        366
         8388608 |@@@                                      1426
        16777216 |                                         154
        33554432 |                                         25
        67108864 |                                         20
       134217728 |                                         1
       268435456 |                                         1
       536870912 |                                         0
This distribution has another feature, showing a small spike in query latency between 8 and 16 ms. I'd guess that this is caused by queries that are not entirerly cached, and are waiting on I/O from disk.
DRAM and disk I/O are visible as spikes in the latency distribution plot.
The DTrace script used for the above examples, mysqld_pid_latency.d, is:
     1  #!/usr/sbin/dtrace -s
     2  /*
     3   * mysqld_pid_latency.d     Print mysqld query latency distribution.
     4   *
     5   * USAGE: ./mysqld_pid_latency.d -p mysqld_PID
     6   *
     7   * TESTED: these pid-provider probes may only work on some mysqld versions.
     8   *  5.0.51a: ok
     9   *
    10   * 27-Feb-2011  brendan.gregg@joyent.com
    11   */
    12
    13  #pragma D option quiet
    14
    15  dtrace:::BEGIN
    16  {
    17      printf("Tracing mysqld... Hit Ctrl-C for report.\n");
    18  }
    19
    20  pid$target::*dispatch_command*:entry
    21  {
    22      self->start = timestamp;
    23  }
    24
    25  pid$target::*dispatch_command*:return
    26  /self->start/
    27  {
    28      @time = quantize(timestamp - self->start);
    29      @num = count();
    30      self->start = 0;
    31  }
    32
    33  dtrace:::END
    34  {
    35      printa("MySQL queries: %@d; query latency (ns):", @num);
    36      printa(@time);
    37  }
The script itself is pretty simple. It traces the time in the dispatch_command() function as a quantize() aggregation, and counts queries. The probe uses wildcards around "dispatch_command" since the probe function name is the full C++ signature:
# dtrace -ln 'pid$target::*dispatch_command*:entry' -p 726
   ID   PROVIDER            MODULE                          FUNCTION NAME
99744     pid726            mysqld _Z16dispatch_command19enum_server_commandP3THDPcj entry
And it can be easier to use wildcards than to write the full signature (bearing in mind the usual risk with wildcards matching too much).
If you are learning DTrace, a more detailed description may be useful here: the entry (start) to this function is traced on line 20, which then collects a high resolution timestamp (nanoseconds) on line 22 and saves it in a thread-local variable "self->start". Thread-local means this variable is associatied with that thread, and other threads performing queries have their own thread-local variables for timing. This variable is then retrieved on the return (end) of the function and the elapsed time (delta) between them is calculated on line 28. This delta time is passed to quantize(), a DTrace aggregating function for collecting and reporting data as power-of-2 distributions. The aggregation itself is called "@time", and another is populated called "@num" to count the number of queries. They are printed at the end of the DTrace program in the dtrace:::END probe, with printa() (print aggregation) statements.
As seen by the earlier examples, it can be executed with a "-p PID" argument, which passes the process ID to the script as the "$target" macro variable. This is necessary for the pid provider (but not the mysql provider).
Some subtleties: line 26 checks that the self->start variable has been populated, otherwise DTrace could begin tracing after the dispatch_command() entry and before the return, and end up with a ridiculous delta time on line 28. Also, I'm assuming dispatch_command() is not recursive (it isn't on the MySQL versions I've seen); if it were, a single self->start variable would be overwritten by the deeper calls.
The dispatch_command() function actually traces MySQL commands, which is inclusive of queries, prepared statements and other command types. Most of what it's showing (at least on the production MySQL servers I've been examining) are queries. The script could be enhanced to filter or examine the command type - it is available as arg0 for that dispatch_command entry probe.
This is a common use of DTrace, and I often hammer out these programs as one-liners if I don't have scripts handy. Eg:
# dtrace -n 'pid$target::*dispatch_command*:entry { self->s = timestamp; }
    pid$target::*dispatch_command*:return /self->s/ {
    @["ns"] = quantize(timestamp - self->s); self->s = 0; }'
It's a long one-liner, but it does the job.
Slow Query Time Breakdown
After identifying slow queries using the previous tool, my next question is - what is the problem? what are the queries? and why? where is the time spent?
The mysqld_pid_slow.d script answers this at a high level, making it a good next step before digging deeper. It takes a time in milliseconds as an argument, and prints queries that were slower than that time. It also shows the total time for the query, and the total component of that time that was spent on-CPU.
Here is some redacted sample output (private data replaced by "xxx"):
# ./mysqld_pid_slow.d -p 726 100
Tracing... Min query time: 100000000 ns.

 TIME(ms) CPU(ms)  QUERY
 111      4        SELECT xxx.* FROM xxx xxx WHERE xxx.xxx=xxx AND xxx.xxx=xxx AND xxx.xxx=xxx AND xxx.xxx=xxx ORDER BY xxx.xxx ASC LIMIT 1\0
 283      0        UPDATE xxx SET xxx=xxx, xxx = xxx,xxx = xxx WHERE xxx=xxx AND xxx = xxx AND xxx = xxx\0
 155      0        UPDATE xxx SET xxx=2 WHERE xxx=xxx AND xxx=xxx AND xxx <= xxx\0
 172      0        UPDATE xxx SET xxx=xxx WHERE xxx=xxx AND xxx=xxx\0
 173      6        SELECT count(*) xxx FROM xxx WHERE xxx =xxx AND xxx=xxx AND xxx=xxx\0
 176      0        UPDATE xxx SET xxx=xxx WHERE xxx=xxx AND xxx=xxx\0
 178      177      SELECT xxx, xxx, xxx, xxx, xxx, xxx, xxx, xxx, xxx, xxx, xxx, xxx, xxx FROM xxx WHERE xxx LIKE xxx AND xxx=xxx ORDER BY xxx DESC LIMIT 10 OFFSET 0\0
[...]
The arguments to the script were "-p 726", to attach to the mysqld process with PID 726, and "100" to trace queries longer than 100 milliseconds. Several were traced in the output above.
The first six queries took between 111 and 283 milliseconds to complete ("TIME(ms)" column), while the on-CPU time was between 0 (rounding) and 6 milliseconds ("CPU(ms)" column). This means that the bulk of the latency is not spent in MySQL processing the query, but rather waiting while off-CPU for some other event. This other event is usually I/O, such as disk or network I/O, but can be other types too (locks, conditional variables, sleeps).
The last query shows 178 ms of query time, and 177 ms on-CPU. It's an example of a slow query due to the query itself. It's selecting many fields and performing an order-by.
The mysqld_pid_slow.d script is:
     1  #!/usr/sbin/dtrace -s
     2  /*
     3   * mysqld_pid_slow.d    Trace queries slower than specified ms.
     4   *
     5   * USAGE: ./mysqld_pid_slow.d -p mysqld_PID min_ms
     6   *
     7   * TESTED: these pid-provider probes may only work on some mysqld versions.
     8   *  5.0.51a: ok
     9   *
    10   * 27-Feb-2011  brendan.gregg@joyent.com
    11   */
    12
    13  #pragma D option quiet
    14  #pragma D option defaultargs
    15  #pragma D option switchrate=10hz
    16
    17  dtrace:::BEGIN
    18  /$1 == 0/
    19  {
    20      printf("USAGE: %s -p PID min_ms\n\n", $$0);
    21      printf("\teg: %s -p 12345 100\n", $$0);
    22      exit(1);
    23  }
    24
    25  dtrace:::BEGIN
    26  {
    27      min_ns = $1 * 1000000;
    28      printf("Tracing... Min query time: %d ns.\n\n", min_ns);
    29      printf(" %-8s %-8s %s\n", "TIME(ms)", "CPU(ms)", "QUERY");
    30  }
    31
    32  pid$target::*dispatch_command*:entry
    33  {
    34      self->query = copyinstr(arg2);
    35      self->start = timestamp;
    36      self->vstart = vtimestamp;
    37  }
    38
    39  pid$target::*dispatch_command*:return
    40  /self->start && (timestamp - self->start) > min_ns/
    41  {
    42      this->time = (timestamp - self->start) / 1000000;
    43      this->vtime = (vtimestamp - self->vstart) / 1000000;
    44      printf(" %-8d %-8d %S\n", this->time, this->vtime, self->query);
    45  }
    46
    47  pid$target::*dispatch_command*:return
    48  {
    49      self->query = 0;
    50      self->start = 0;
    51      self->vstart = 0;
    52  }
This is similar to the other script, but printing the time deltas with printf() instead of summarizing them as an aggregation. The DTrace vtimestamp built-in was used to calculate on-CPU time (this timestamp variable only increments when the current thread is on-CPU). A copyinstr() is used on line 34 to pull in the query string from the user-land mysqld to the kernel where DTrace is running.
Experience
These tools are great, but they are just a starting point. I typically spend a few minutes running and examining mysqld_pid_latency.d, and then a minute on mysqld_pid_slow.d. After that, I know if there is a problem, and whether to turn to on-CPU analysis or off-CPU analysis.
in practise I'll spend less than 5 minutes on these tools before moving onto more DTrace.
Adding a dimension
While I'm discussing mysqld_pid_latency.d, it's worth showing that this data can do even more than was shown above. I had run mysqld_pid_latency.d for about ten seconds and hit Ctrl-C, producing:
# ./mysqld_pid_latency.d -p 15489
Tracing mysqld... Hit Ctrl-C for report.
^C
MySQL queries: 22033; query latency (ns):

           value  ------------- Distribution ------------- count
            1024 |                                         0
            2048 |                                         77
            4096 |@                                        349
            8192 |                                         125
           16384 |@                                        504
           32768 |@                                        504
           65536 |@@@@                                     2043
          131072 |@@@@@@@@@@@@@@@@@@@@                     10921
          262144 |@@@@@@@@@                                4795
          524288 |@@@                                      1591
         1048576 |@                                        550
         2097152 |                                         204
         4194304 |                                         90
         8388608 |                                         250
        16777216 |                                         19
        33554432 |                                         5
        67108864 |                                         4
       134217728 |                                         1
       268435456 |                                         1
       536870912 |                                         0
Which is great, but I can't see if the distribution was changing over time - second by second. Imagine I ran this for 60 seconds, or 10 minutes; there could be gradual variation over time that I'm missing out on.
I can (and have) modified the mysqld_pid_latency.d script to print the output every second, but the amount of text output becomes so much that it's difficult to comprehend properly in a text based terminal, where only one or two seconds worth fits on the screen at once.
We are addressing this with Cloud Analytics at Joyent, where we are taking these latency distributions and displaying them as heat maps. Here is an example of the MySQL query heat map I've been testing (development software, tested on production load):
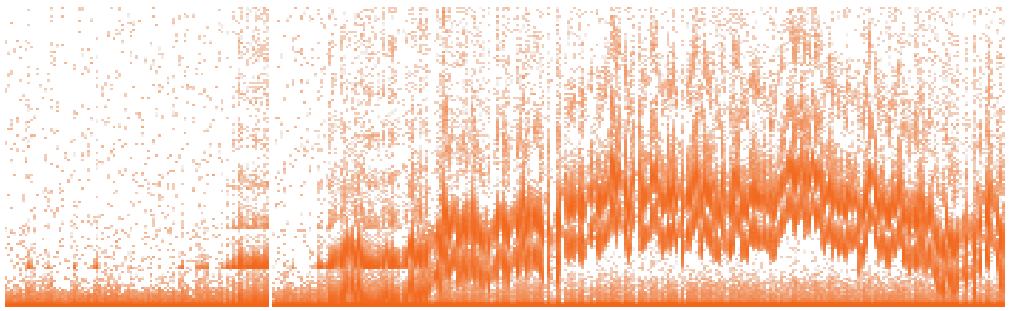
Time is the x-axis, latency is the y-axis, and the number of queries (z-axis) is represented by color saturation. This heat map deserves a lot of explanation, which I'll get to in a later post. I've included it here to show that the query latency distribution can change second by second: the start of this heat map shows low latency, which rises and falls over time. This would be much less clear at the command line, as printing output second by second would be many dozens of pages to read through for the same information. Increasing the time interval so that there is fewer pages of output may hide important details - such as the multiple levels of latency that can be seen in this heat map.
Conclusion
I introduced some pid provider-based DTrace tools to get a quick handle on MySQL query performance, for when DTrace is available but the mysql provider is not. This is just the start - there's a lot more we can do.