I originally posted this at http://dtrace.org/blogs/brendan/2011/09/26/observing-observer-a-cloud-analytics-case-study.
On the weekend of August 27-29, Joyent hosted Node Knockout 2011, a 48-hour coding competition for node.js developers from around the world, working individually or in teams.
The contest entries were all hosted on Joyent's no.de platform, running on SmartDataCenter and SmartOS. The winning entry was Observer by Arnout Kazemeir, a service which "allows you to follow and observe your website visitors in real time." It's an impressive app, and it made the front page of Hacker News, causing a flood of traffic.
For a Joyent SmartMachine, that shouldn't have been a problem. Joyent's cloud is designed to deal gracefully with traffic bursts, and this was not out of scale for us. Nonetheless, users were experiencing very slow load times. Isaac and I were asked to sort out the problem.
Joyent's SmartDataCenter provides Cloud Analytics, a browser-based interface that has powerful DTrace-based visualizations for studying performance issues across the cloud, in real-time.
We started by studying HTTP server latency (which is measured using the node.js DTrace provider). This is presented as heat maps so that the entire distribution can be considered. I opened this for the observer.no.de zone only (click for full version; internal details blurred):
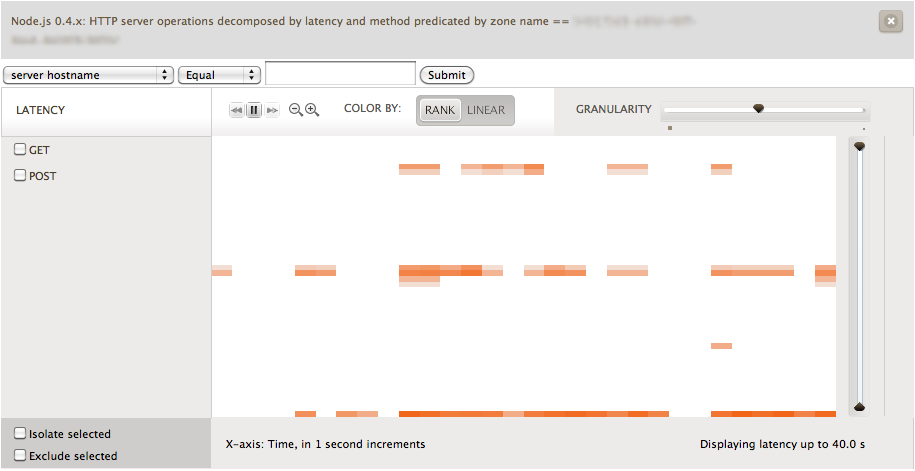
The reason we are using heat maps for latency should be pretty obvious from this one screenshot. If this were a line graph of average latency instead, the three levels seen here would be compressed as a single line. This heat map makes it clear that latency is very fast for some requests (close to 0s, the line at the bottom), or very slow for others (either 20s or 36s, the two higher levels seen).
Pixels can be clicked to reveal details of the makeup. By clicking on each of the lines, it seemed that the lowest line was the synchronous website components, and the higher lines at 20 and 36 seconds were for asynchronous polling. Which should be ok.
It had been suggested that the node.js web proxy, which fronted these no.de instances, was the origin of the latency. To investigate, I opened HTTP latency by zone name, and selected both the observer.no.de zone (blue) and the web proxy (yellow):
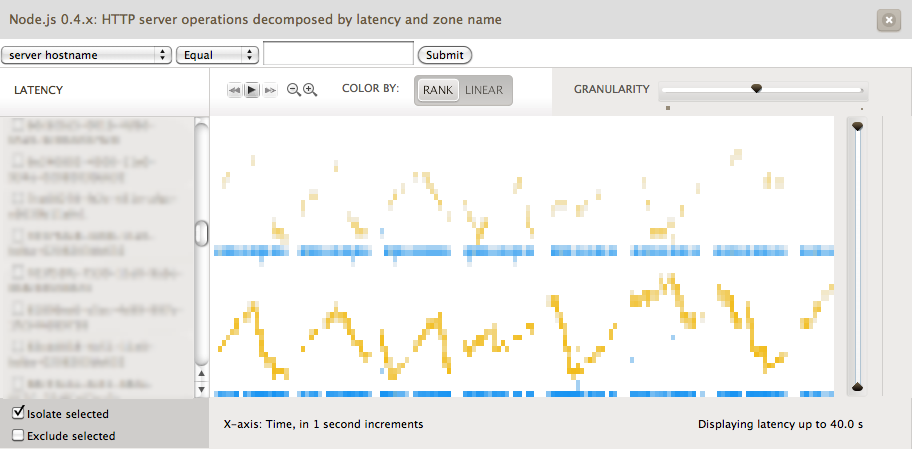
This was the first time I'd examined both from the same heatmap, and I didn't know what to make of it straight away. The zigzag pattern of proxy latency looks like it coincides with observer.no.de (see the x-axis gaps), but with a much higher latency that rises and falls over time (y-axis). This would suggest that the issue is indeed the proxy. However, the proxy is serving multiple other servers, and the zigzag pattern may be from or hurting someone else (with the x-axis timing a coincidence). I was also wondering if the zigzag latency was the asynchronous polling events only, which, while different from the proxy would not be the real issue.
At this point I was asking users to describe the latency to understand the issue better, and was sent a screenshot from someone who had run the Chrome developer tools to capture timing (Firefox can do this too with the Firebug add-on):
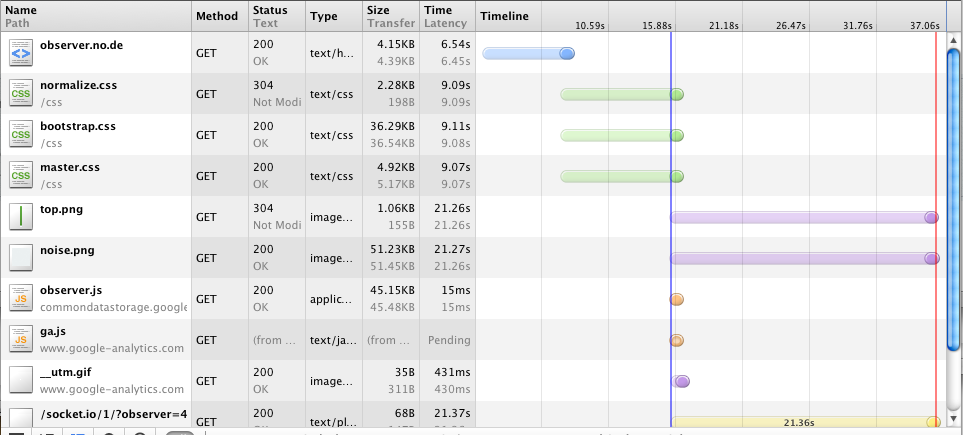
This is extremely useful! This shows that ordinary files, like "top.png", have latency of tens of seconds. Fortunately, Cloud Analytics allows latency of specific URLs to be examined (I used the "URL path" decomposition which truncates content after the "?"), so I brought up top.png latency on both the proxy and observer.no.de:

The top heatmap shows the proxy, and the bottom shows observer.no.de (I could have shown both in the same heatmap, by predicating on the URL path first and then decomposing by zone name). This made it clear that the latency from observer.no.de was very fast, but very slow when proxied. This strongly suggested the issue was the proxy.
Other latency sources on the proxy were quickly checked using Cloud Analytics, including filesystem latency (which encompasses both disk I/O and filesystem-based latency such as lock contention). Nothing was found on the system that would cause latency of multiple seconds. This quickly narrowed the search to the proxy application itself.
Isaac looked at the proxy code, and found a tunable that was set too low:

maxSockets of 100 wasn't enough, especially with the number of polling sockets opened for long durations. Isaac increased this to 32000, half the max file-descriptor limit of 65536, since each socket connection uses two file descriptors: one for the request, and one to connect to the back-end origin server. The change was immediate:
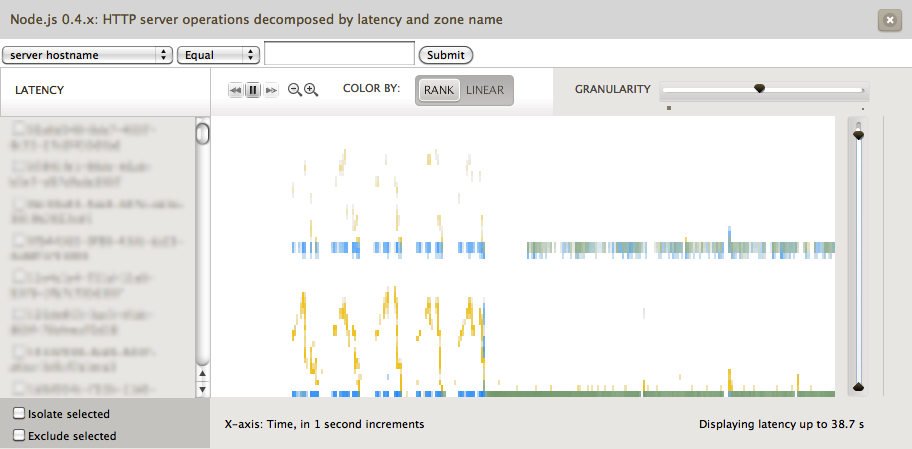
This shows before and after, with the switch happening in about the middle of the heatmap. The proxy latency then matched the observer.no.de latency, appearing as green pixels (combination of both the yellow and blue). Users reported that the latency was indeed fixed.
For more background on Cloud Analytics and our use of heatmaps, see Dave's video, blog posts, and our OSCON talk. It's great to use it in production to solve real issues; it wasn't that long ago that Bryan and I were demoing the prototype.
