

I originally posted this at http://dtrace.org/blogs/brendan/2011/10/10/top-10-dtrace-scripts-for-mac-os-x.
Since version 10.5 "Leopard", Mac OS X has had DTrace, a tool used for performance analysis and troubleshooting. It provides data for Apple's Instruments tool, as well as a collection of command line tools that are implemented as DTrace scripts. I'm familiar with the latter as I wrote the originals for the DTraceToolkit, which Apple then customized and enhanced for Mac OS X where they are shipped by default (great!). I use them regularly to answer this question:
why is my MacBook slow?
I work in an office where everyone has MacBook Pros, and “why is my MacBook slow?” is a common question. Applications can become slow or unresponsive while waiting for CPU work, memory requests or disk I/O to complete.
For people who try to ignore the slowdown, the question can become:
why is my MacBook fan so loud?
Standard performance analysis tools like Activity Monitor and top(1) (and any third-party tools based on the same foundation) can't tell you some key information about activity on your system, such as how much CPU consumption is caused by short-lived processes, or which processes are causing disk I/O. DTrace, however, can see (just about) everything.
In this post, I’ll cover the top ten Mac OS X DTrace scripts that I use for figuring out why laptops are slow or why applications are misbehaving. Most of these scripts are already installed, a few are from the new DTrace book.
How to use DTrace
If you've never run a DTrace script before or even used the command line, here's a basic walkthrough:
Open Terminal
Run the "Terminal" application. You can find it here in Finder:

You can also type "terminal" in Spotlight (the magnifying glass in the top right corner of your Mac's screen), which should find it. I usually drag it to my Dock so it's easy to find later:

Customize Terminal
When you first run Terminal, it'll probably look like this:

I find the default font small and hard to read. The size of the window in terms of characters is also small (80 columns by 24 rows), presumably to pay homage to original Unix terminals of that size. (Why Unix? Mac OS X is Unix under the hood: the Darwin kernel).
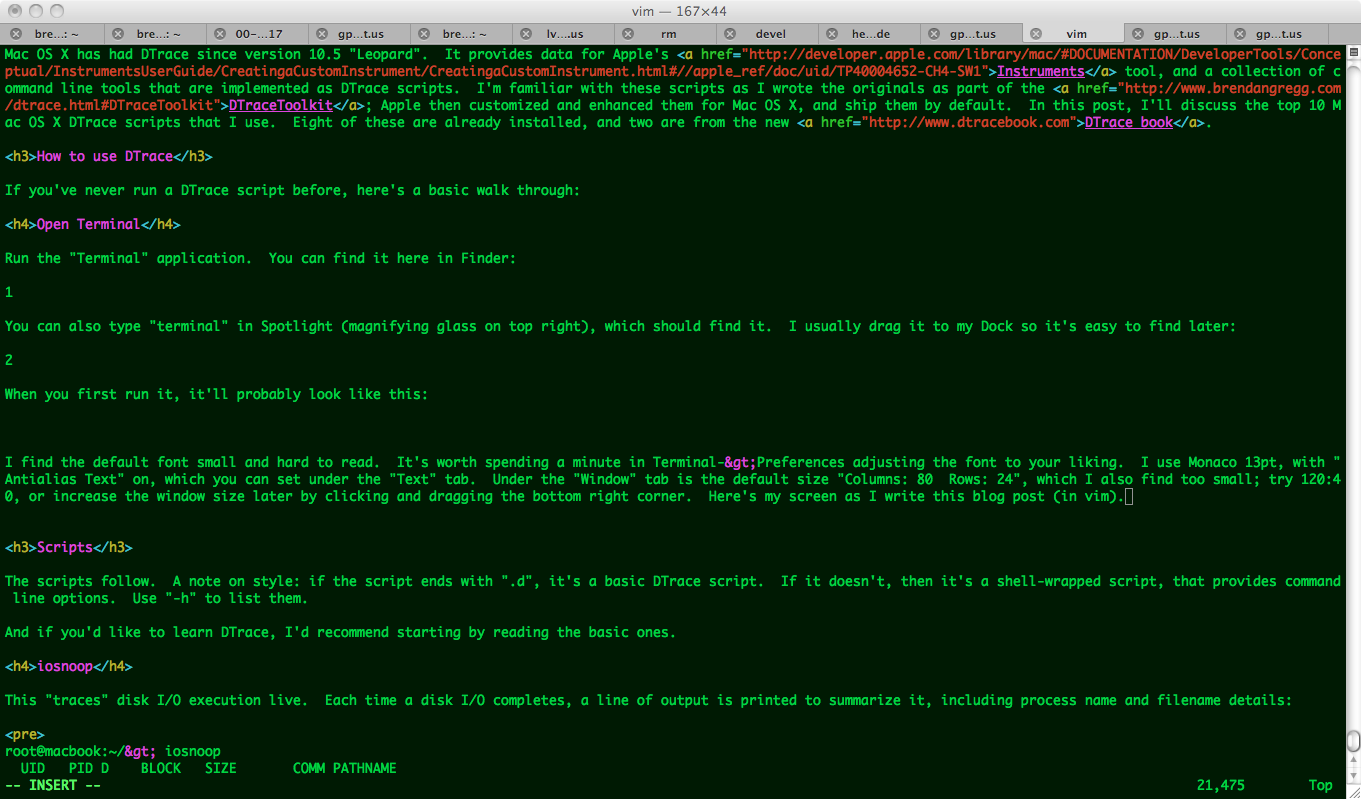
You can adjust the font to your liking in Terminal->Preferences->Text. I use Monaco 13pt, with "Antialias Text" on. Under the "Window" tab is the default size, 80x24, which you can also increase later by clicking and dragging the bottom right corner of the terminal. For example, here's my screen as I write this blog post (in a terminal-based text editor).
Running top
While DTrace can see everything, there are some things already covered by easy-to-use (and easy-to-type) tools, like top(1). Now that you have Terminal running, type "top -o cpu" and hit enter, which will refresh the screen showing top running processes. Type "q" to exit the top program. The output will look something like this:
Brendan-2:~ brendan$ top -o cpu
[...]
PID    COMMAND      %CPU TIME     #TH  #WQ  #PORT #MREGS RPRVT  RSHRD  RSIZE
67254- firefox-bin  98.8 04:53:45 62/1 1    743   9935+  374M+  78M    637M+
86550  top          15.3 00:28.60 1/1  0    24    33     1748K  264K   2324K
1068   Terminal     13.2 17:38:19 5    1    358   1326   37M    67M    61M+
61501- Google Chrom 7.9  13:40.89 6    1    93-   556-   45M-   73M    77M-
[...]
I've truncated the header block to just include the columns. Look at the "%CPU" column to see which processes are making the CPUs busy, and the "RSIZE" column to see who is consuming main memory. The busiest (CPU) process will be at the top, since we sorted on cpu ("-o cpu"). The top was "firefox-bin" (Mozilla Firefox) at 98.8% CPU, which is in terms of a single processor (this has two). If firefox stayed that high you could look for the responsible tab and close it down, or restart Firefox.
After top, I turn to DTrace.
Running DTrace
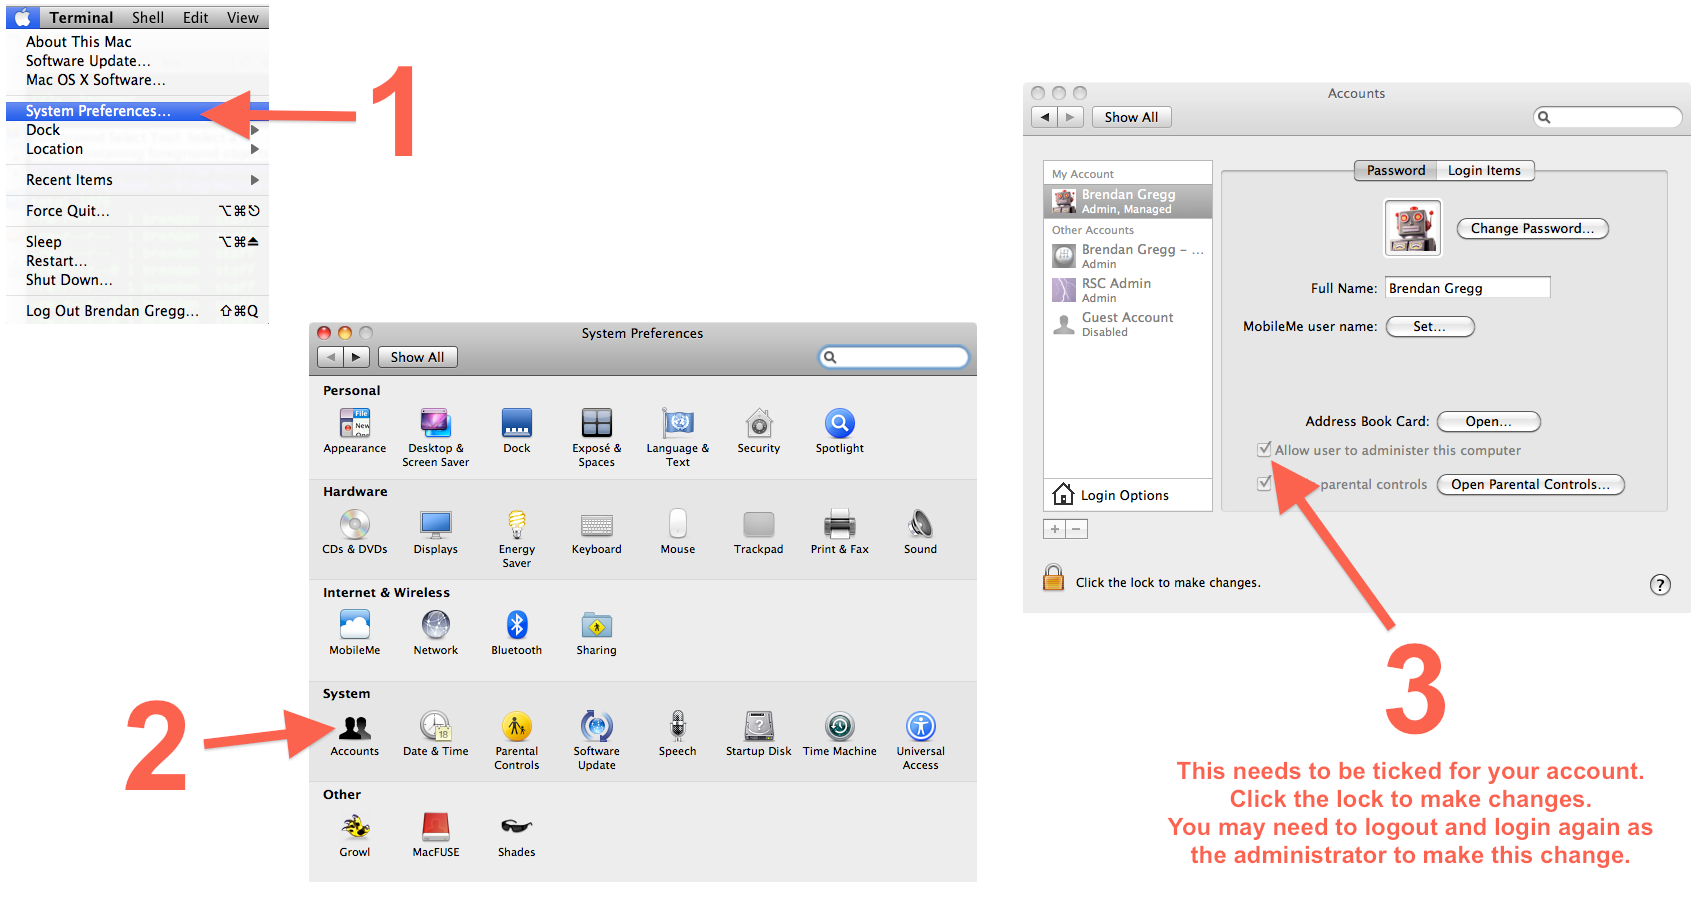
DTrace requires admin privileges, so to use it you'll usually need to type in a password to authenticate, provided you have administrator access (if you aren't sure you do, click here to see how to check).
You can run DTrace by prefixing your DTrace commands with "sudo", which will prompt for the password the first time around (but not for some time after that). When a DTrace command is running, you usually type Ctrl-C to end it. Here's an example:
Brendan-2:~ brendan$ sudo iosnoop
Password: password
  UID   PID D    BLOCK   SIZE       COMM PATHNAME
  503 67261 W 384070496  73728  TweetDeck ??/Cookies/Cookies.plist_tmp_67261_0.dat
  503 67261 W 384070640   4096  TweetDeck ??/Local Store/td_26_brendangregg.db-journal
  503 67261 W 384070640   4096  TweetDeck ??/Local Store/td_26_brendangregg.db-journal
  503 67261 W 308056800   4096  TweetDeck ??/Local Store/td_26_brendangregg.db
  503 67261 W 308056856   4096  TweetDeck ??/Local Store/td_26_brendangregg.db
^C
brendan@macbook:~>
If sudo says "permission denied", check your admin status.
and here's what happens if you forgot the "sudo":
Brendan-2:~ brendan$ iosnoop
dtrace: failed to initialize dtrace: DTrace requires additional privileges
Scripts
The scripts follow. A note on style: if the script ends with ".d", it's a basic DTrace script. If it doesn't, then it's a shell-wrapped script that provides command line options. Use "-h" to list them.
And if you'd like to learn DTrace, I'd recommend starting by reading the basic ones.
1. iosnoop
This "traces" disk I/O execution live. Each time a disk I/O completes, a line of output is printed to summarize it, including process name and filename details:
Brendan-2:~ brendan$ sudo iosnoop
  UID   PID D    BLOCK   SIZE       COMM PATHNAME
  503 54079 R 286522800   4096 Google Chrome ??/Cache/data_2
  503 54079 R 286522808   4096 Google Chrome ??/Cache/data_2
  503 34852 W 385001216  53248      Adium ??/Default/.dat8824.01b
  503 65002 W 308056800   4096  TweetDeck ??/Local Store/td_26_brendangregg.db
  503 65002 W 308056864   4096  TweetDeck ??/Local Store/td_26_brendangregg.db
  503 65002 W 385001320   4096  TweetDeck ??/Local Store/td_26_brendangregg.db-journal
  503 65002 W 385001320   4096  TweetDeck ??/Local Store/td_26_brendangregg.db-journal
  503 65002 W 385001320   4096  TweetDeck ??/Local Store/td_26_brendangregg.db-journal
  503 54079 W 385001384  12288 Google Chrome ??/Default/Cookies-journal
  503 54079 W 385001384   4096 Google Chrome ??/Default/Cookies-journal
  503 54079 W 134993856   4096 Google Chrome ??/Default/Cookies
  503 54079 W 134994056   4096 Google Chrome ??/Default/Cookies
  503 54079 W 134994176   4096 Google Chrome ??/Default/Cookies
  503 54079 W 134994224   8192 Google Chrome ??/Default/Cookies
[...]
This lets you instantly find out which applications are using the disk, and what files they are reading or writing to. Disk I/O is typically slow (for non-SSD disks), so an application calling frequent disk I/O (a dozen per second or more) may run slowly as it waits for the disk I/O to complete.
The output columns show: UID = user ID, PID = process ID (unique identifier for the process), D = direction (R = read, W = write), BLOCK = location on disk, SIZE = I/O size in bytes, COMM = process name, PATHNAME = trailing portion of file pathname.
In that output I caught Google Chrome reading from a cache file ("data_2"), and writing to cookie files ("Cookies-journal" and "Cookies"). TweetDeck also wrote to database files ("td_26_brendangregg.db" and "td_26_brendangregg.db-journal"). The "??" is where the path information ends for iosnoop (if you are a darwin programmer and want to take a swing at improving that, see the fi_pathname translator in /usr/lib/dtrace/io.d).
The "-h" option lists options (don't need "sudo" for this):
Brendan-2:~ brendan$ iosnoop -h
USAGE: iosnoop [-a|-A|-DeghiNostv] [-d device] [-f filename]
               [-m mount_point] [-n name] [-p PID]
       iosnoop          # default output
                -a      # print all data (mostly)
                -A      # dump all data, space delimited
                -D      # print time delta, us (elapsed)
                -e      # print device name
                -g      # print command arguments
                -i      # print device instance
                -N      # print major and minor numbers
                -o      # print disk delta time, us
                -s      # print start time, us
                -t      # print completion time, us
                -v      # print completion time, string
                -d device       # instance name to snoop
                -f filename     # snoop this file only
                -m mount_point  # this FS only
                -n name         # this process name only
                -p PID          # this PID only
   eg,
        iosnoop -v      # human readable timestamps
        iosnoop -N      # print major and minor numbers
        iosnoop -m /    # snoop events on filesystem / only
For tricky performance issues I often use "-stoD" to get start and end timestamps for each I/O in microseconds, and a couple of different types of I/O time calculations.
In hindsight, I should have called it diskiosnoop, since "io" could refer to different locations in the kernel I/O stack.
2. hfsslower.d
This script answers an iosnoop FAQ: why dosen't iosnoop see my application disk I/O?
The reason is that applications rarely request disk I/O directly, rather, they access a file system that does disk I/O on their behalf. To increase performance, the file system will usually try to cache as much file data as possible in main memory (DRAM). The application may (by some notion) think that it's doing disk I/O, but it's actually reading from very fast DRAM, thanks to the file system. Writes can also buffer in DRAM and write to disk later, which also speeds up application performance.
The hfsslower.d script measures I/O before it is processed by the HFS+ file system (Apple's current default file system). iosnoop measures I/O after the file system, and only if it reaches disk:

A couple of points:
- hfsslower.d will see a lot more I/O than iosnoop, as it includes file system cache hits.
- hfsslower.d better reflects application performance, as it measures the same latency that the application directly suffered.
The hfsslower.d script is from the DTrace book, and can be found here. To run it, you'll need to create a text file containing the script (or pull it from the DTrace book tarball), and make the file executable from Terminal by running "chmod 755 hfsslower.d".
This script takes an argument which is the minimum number of milliseconds to show I/O for. Here's tracing 1ms HFS+ I/O and slower:
Brendan-2:~ brendan$ sudo ./dtbook_scripts/Chap5/hfsslower.d 1
TIME                 PROCESS          D   KB     ms FILE
2011 Sep 27 19:00:15 Google Chrome    R    0     15 data_5
2011 Sep 27 19:00:15 Google Chrome    R    0     10 data_0
2011 Sep 27 19:00:15 Google Chrome    R    0     10 data_0
2011 Sep 27 19:00:15 Google Chrome    R    0     10 data_5
2011 Sep 27 19:00:21 TweetDeck        W    0      1 td_26_brendangregg.db-journal
2011 Sep 27 19:00:25 Adium            R    0     18 Smile.png
2011 Sep 27 19:01:08 firefox-bin      W    0     17 _CACHE_001_
2011 Sep 27 19:01:36 firefox-bin      W    0      9 _CACHE_001_
2011 Sep 27 19:01:36 firefox-bin      W    2     14 _CACHE_002_
2011 Sep 27 19:01:36 firefox-bin      W    0      7 _CACHE_001_
2011 Sep 27 19:01:37 firefox-bin      W    0      1 _CACHE_001_
2011 Sep 27 19:01:40 firefox-bin      W    0      6 _CACHE_001_
2011 Sep 27 19:01:46 firefox-bin      W    0     14 _CACHE_001_
2011 Sep 27 19:01:49 firefox-bin      R   15      1 _CACHE_003_
2011 Sep 27 19:01:49 firefox-bin      W   12      7 _CACHE_003_
2011 Sep 27 19:01:49 firefox-bin      W    0      4 _CACHE_001_
2011 Sep 27 19:01:51 firefox-bin      W    0      9 _CACHE_001_
2011 Sep 27 19:01:52 firefox-bin      R   21     27 Times.dfont/..namedfork/rsrc
2011 Sep 27 19:01:52 fontd            R    0     16 annex_aux
2011 Sep 27 19:01:52 firefox-bin      W    0      5 _CACHE_001_
[...]
Columns are: TIME = time of I/O completion, PROCESS = application name, D = direction (R = read, W = write), KB = I/O size in Kbytes, ms = I/O latency in milliseconds, FILE = filename.
If you use the argument "0", it will trace everything. If I'm chasing down slow I/O, I'll often use an argument of "10" for I/O slower than 10 milliseconds.
At this point you may think: if you just care about slow I/O, then just use iosnoop. That works to a point, but there can be slow I/O caused by something other than disks (file system lock contention, for example). The other advantage of the hfsslower.d script is that the measured latency matches the application pain suffered, whereas at the disk level you can only assume a correlation.
3. execsnoop
This traces the execution of new processes. This is great at identifying short-lived processes that may be caused by misbehaving applications and can slow down your system. These short-lived processes are usually too quick to be picked up by standard monitoring tools like the Activity Monitor or top(1).
To demonstrate this tool, here's what happens when you type "man ls":
Brendan-2:~ brendan$ sudo execsnoop -v
STRTIME                UID    PID   PPID ARGS
2011 Sep 28 20:19:18     0  67234  66312 man
2011 Sep 28 20:19:18     0  67234  66312 man
2011 Sep 28 20:19:18     0  67235  67234 sh
2011 Sep 28 20:19:18     0  67235  67234 gzip
2011 Sep 28 20:19:19     0  67236  67234 sh
2011 Sep 28 20:19:18     0  67234  66312 man
2011 Sep 28 20:19:19     0  67236  67234 gzip
2011 Sep 28 20:19:19     0  67234  66312 man
2011 Sep 28 20:19:19     0  67244  67243 less
2011 Sep 28 20:19:19     0  67242  67239 sh
2011 Sep 28 20:19:19     0  67242  67239 gzip
2011 Sep 28 20:19:19     0  67240  67238 tbl
2011 Sep 28 20:19:19     0  67241  67238 groff
2011 Sep 28 20:19:19     0  67245  67241 troff
2011 Sep 28 20:19:19     0  67246  67241 grotty
This prints a line for each new process that is executed, in a rolling output similar to the previous tools. The fields are: STRTIME = (string) timestamp, UID = user ID, PID = process ID, PPID = parent process ID, ARGS = process name (should be process + arguments, but that doesn't yet work on Mac OS X; if you want to debug, see pr_psargs in /usr/lib/dtrace/proc.d).
Here's what happens when I turn AirPort (wifi) off, then on:
Brendan-2:~ brendan$ sudo execsnoop -v
STRTIME                UID    PID   PPID ARGS
2011 Sep 28 20:28:00     0  67204      1 airportd
2011 Sep 28 20:28:01   503  67205    140 fontworker
2011 Sep 28 20:28:01     0  67206      1 mDNSResponderHel
2011 Sep 28 20:28:06     0     49      1 autofsd
2011 Sep 28 20:28:10     0  67208     37 ManagedClient
2011 Sep 28 20:28:31   503  67209    140 fontworker
2011 Sep 28 20:28:43     0  67210      1 airportd
2011 Sep 28 20:28:49     0  67211      1 mDNSResponderHel
2011 Sep 28 20:28:49   503  67212    140 fontworker
2011 Sep 28 20:28:51     0  67214      1 kerberosautoconf
2011 Sep 28 20:28:51     0  67215      1 kerberosautoconf
2011 Sep 28 20:28:56     0     49      1 autofsd
2011 Sep 28 20:29:01     0  67219     37 ManagedClient
2011 Sep 28 20:29:04     0  67220      1 ocspd
2011 Sep 28 20:29:16   503  67221  54079 Google Chrome He
2011 Sep 28 20:29:19   503  67222    140 fontworker
Near the end I opened up a new tab in Mozilla Firefox and another in Google Chrome. You can see a fundamental difference: Chrome creates a new process for that tab, Firefox doesn't.
execsnoop has various options, use -h to list them all. I used -v above, to print the time.
4. opensnoop
This traces file opens and prints various details, including the time and error code when using "-ve". I usually use it to look for failed opens, which can be a sign of misconfigured applications. Discovering their config files and resource files can also be useful.
Brendan-2:~ brendan$ sudo opensnoop -ve
STRTIME                UID    PID COMM          FD ERR PATH
2011 Sep 30 01:44:15     0     11 DirectoryServic  -1   2 /var/db/dslocal/nodes/Default/hosts
2011 Sep 30 01:44:15     0     11 DirectoryServic  20   0 /etc/hosts
2011 Sep 30 01:44:15     0  85198 dtrace         5   0 /etc/localtime
2011 Sep 30 01:44:15   503    146 SystemUIServer  19   0 /Users/brendan/Library/Preferences/com.apple.menuextra.clock.plist.47C2X9o
2011 Sep 30 01:44:15   503    146 SystemUIServer  19   0 /System/Library/CoreServices/Menu Extras/TimeMachine.menu/Contents/Resources/TMRotatingArrow.pdf
2011 Sep 30 01:44:15   503    146 SystemUIServer  19   0 /System/Library/CoreServices/Menu Extras/Clock.menu/Contents/Resources/Clock.pdf
2011 Sep 30 01:44:15   503    146 SystemUIServer  19   0 /System/Library/CoreServices/Menu Extras/TimeMachine.menu/Contents/Resources/TMRotatingArrow.pdf
2011 Sep 30 01:44:17   503  67261 TweetDeck     17   0 /Users/brendan/Library/Cookies/Cookies.plist_tmp_67261_0.dat
2011 Sep 30 01:44:17   503  67261 TweetDeck     17   0 /Users/brendan/Library/Cookies/Cookies.plist
2011 Sep 30 01:44:18   503  54079 Google Chrome  72   0 /var/folders/bU/bU0WYlnwE6KKnMBrvI5QUU+++TQ/-Tmp-/.com.google.Chrome.sQdN3D
2011 Sep 30 01:44:19     0     36 mds            9   0 .
^C
While tracing, I changed the clock in the top bar from digital:
to analogue:
The files opened to performed this can be seen by the "SystemUIServer" process, beginning with a Preferences file and then some PDFs. Huh? PDFs? What are those PDFs?

That's bizarre. I didn't know that those tiny icons were implemented as PDFs!
5. dtruss
The previous two tools, opensnoop and execsnoop, operate by tracing specific system calls. A system call (or "syscall") is what an application performs to request the operating system kernel to perform privileged work, including process creation, file operations, and other I/O (eg, disk or network I/O). Syscalls are a great target for analysis with DTrace, since examining them often provides a pretty good picture of what an application is trying to do. They can also provide useful details including byte counts, file and process names, error codes, and latency.
The dtruss tool traces all types of system calls, which is very useful for general debugging, especially since Mac OS X doesn't come with a standard syscall tracer (like Linux's "strace" or Solaris's "truss"). One advantage of dtruss over those other tools is that dtruss can trace multiple processes at the same time, matching on the process name "-n". For example, tracing Firefox via its process name "firefox-bin":
Brendan-2:~ brendan$ sudo dtruss -n firefox-bin
    PID/THRD  SYSCALL(args)          = return
67254/0x720286:  write_nocancel(0x7, "8\0", 0x1)         = 1 0
67254/0x720286:  lseek(0x24, 0x75500, 0x0)       = 480512 0
67254/0x720286:  read_nocancel(0x24, "\0", 0x200)        = 512 0
67254/0x720286:  write_nocancel(0x7, "8\0", 0x1)         = 1 0
67254/0x720286:  lseek(0x24, 0x73B00, 0x0)       = 473856 0
67254/0x720286:  read_nocancel(0x24, "\0", 0x200)        = 512 0
67254/0x746a81:  select_nocancel(0x3D, 0xB04909B8, 0xB0490938)       = 1 0
67254/0x746a81:  read_nocancel(0x6, "8\0", 0x400)        = 1 0
67254/0x746a81:  recvfrom_nocancel(0x36, 0xB0490C3F, 0x1)        = -1 Err#35
67254/0x746a81:  select_nocancel(0x3D, 0xB0490998, 0xB0490918)       = 1 0
67254/0x746a81:  sendto_nocancel(0x36, 0x20A51008, 0x292)        = 658 0
67254/0x720286:  write_nocancel(0x7, "8\0", 0x1)         = 1 0
67254/0x720286:  lseek(0x24, 0x74000, 0x0)       = 475136 0
[...]
The output will be many pages, as applications commonly make frequent system calls.
dtruss can also launch and trace a program. Here the humble "ls -l" command was traced:
Brendan-2:~ brendan$ sudo dtruss ls -l hfsslower.d
-rwxr-xr-x  1 brendan  staff  1152 Jan 28  2011 hfsslower.d
SYSCALL(args)        = return
ioctl(0x3, 0x80086804, 0x7FFF5FBFD710)       = 0 0
close(0x3)       = 0 0
stat64("/usr/lib/libstdc++.6.dylib\0", 0x7FFF5FBFCB20, 0x7FFF5FBFD160)       = 0 0
mmap(0x0, 0xD000, 0x3, 0x1002, 0x1000000, 0x7FFF00000001)        = 0x20000 0
[...100 lines truncated...]
open_nocancel("/etc/sysinfo.conf\0", 0x0, 0x1B6)         = -1 Err#2
lstat64_extended(0x100100768, 0x7FFF5FBFE3F0, 0x100101580)       = 0 0
listxattr(0x100100768, 0x0, 0x0)         = 0 0
fstat64(0x1, 0x7FFF5FBFD960, 0x7FFF5FBFDA2C)         = 0 0
ioctl(0x1, 0x4004667A, 0x7FFF5FBFD9AC)       = 0 0
access("/etc/localtime\0", 0x4, 0x0)         = 0 0
open_nocancel("/etc/localtime\0", 0x0, 0x0)      = 4 0
fstat64(0x4, 0x7FFF5FBFB8B0, 0x0)        = 0 0
read_nocancel(0x4, "TZif\0", 0x2A64)         = 1017 0
close_nocancel(0x4)      = 0 0
write_nocancel(0x1, "-rwxr-xr-x  1 brendan  staff  1152 Jan 28  2011 hfsslower.d\n\0", 0x3C)         = 60 0
fchdir(0x3, 0x100100000, 0xFC080)        = 0 0
fchdir(0x3, 0x0, 0x100800000)        = 0 0
close_nocancel(0x3)      = 0 0
100 lines were trimmed to keep that example short.
dtruss supports various options, including the printing of system call timing for use when analyzing performance.
Brendan-2:~ brendan$ dtruss -h
USAGE: dtruss [-acdefholLs] [-t syscall] { -p PID | -n name | command }

          -p PID          # examine this PID
          -n name         # examine this process name
          -t syscall      # examine this syscall only
          -a              # print all details
          -c              # print syscall counts
          -d              # print relative times (us)
          -e              # print elapsed times (us)
          -f              # follow children
          -l              # force printing pid/lwpid
          -o              # print on cpu times
          -s              # print stack backtraces
          -L              # don't print pid/lwpid
          -b bufsize      # dynamic variable buf size
   eg,
       dtruss df -h       # run and examine "df -h"
       dtruss -p 1871     # examine PID 1871
       dtruss -n tar      # examine all processes called "tar"
       dtruss -f test.sh  # run test.sh and follow children
I've used the "-e" option many times to figure out what's slowing down an application. It shows the elapsed time for the system call in microseconds:
Brendan-2:~ brendan$ dtruss -e ls -l hfsslower.d
-rwxr-xr-x  1 brendan  staff  1152 Jan 28  2011 hfsslower.d
 ELAPSD SYSCALL(args)        = return
    245 mmap(0x10000B000, 0x2000, 0x5, 0x12, 0x3, 0x7FFF00000001)        = 0xB000 0
     11 mmap(0x10000D000, 0x1000, 0x3, 0x12, 0x3, 0x7FFF00000001)        = 0xD000 0
     10 mmap(0x10000E000, 0x1F10, 0x1, 0x12, 0x3, 0x7FFF00000001)        = 0xE000 0
     31 open("/dev/dtracehelper\0", 0x2, 0x7FFF5FC45370)         = 3 0
     40 __sysctl(0x7FFF5FBFD5B0, 0x2, 0x7FFF5FBFD5DC)        = 0 0
I then look down the "ELAPSD" column for the largest times.
A dtruss FAQ is: why is the output in the wrong order?
As with other DTrace "tracing" style tools (that print lines of output as they occur) the output can be shuffled slightly due to CPU buffering on multi-CPU systems. The "-d" option for relative times (since program start) is useful for cases where the output order is important. You can then post-sort by that column so that the dtruss output is in the correct order. (For example, by redirecting the output to a file, then using the sort(1) command on that column.)
Ryan Dahl (creator of node.js) had been using dtruss so frequently recently that he made some enhancements and posted a newer version on github here.
6. soconnect_mac.d
This script is from the DTrace book, and traces outbound TCP connections along with details:
Brendan-2:~ brendan$ sudo ./dtbook/Chap6/soconnect_mac.d
PID    PROCESS          FAM ADDRESS          PORT   LAT(us) RESULT
45343  firefox-bin      2   70.32.100.166    443        735 In progress
65002  TweetDeck        2   199.59.148.201   80          94 In progress
65002  TweetDeck        2   208.93.137.53    80          89 In progress
54079  Google Chrome    2   97.74.215.143    80          76 In progress
45343  firefox-bin      2   97.74.215.143    80         752 In progress
45343  firefox-bin      2   97.74.215.143    80          88 In progress
45343  firefox-bin      2   97.74.215.143    80          85 In progress
45343  firefox-bin      2   97.74.215.143    80          39 In progress
45343  firefox-bin      2   97.74.215.143    80          22 In progress
45343  firefox-bin      2   97.74.215.143    80          20 In progress
27     ntpd             2   17.151.16.20     123         24 Success
[...]
It's a quick way to find out what applications are connecting to whom on the Internet. The script is here.
Columns are: PID = process ID, PROCESS = process name, FAM = protocol family (2 = IPv4), ADDRESS = IP address, PORT = TCP destination port, LAT(us) latency of the connect() system call in microseconds, RESULT = return of the connect().
Many connections these days are "non-blocking", so the latency appears low and has the result "In progress". The actual connection completes sometime later (the timing can be traced using some more DTrace, when desired).
There is a companion tool, soaccept_mac.d, which shows inbound TCP connections. If you ran both regularly, you may catch something performing networking that shouldn't be (e.g., spyware, virus, ...).
7. errinfo
This tool provides a summary of which system calls were failing, showing the process name, error code, and short description of the error:
Brendan-2:~ brendan$ sudo errinfo -c
Tracing... Hit Ctrl-C to end.
^C
            EXEC          SYSCALL  ERR  COUNT  DESC
       TweetDeck          lstat64    2      1  No such file or directory
       TweetDeck           select    9      1  Bad file descriptor
       TweetDeck           stat64    2      1  No such file or directory
           cupsd           unlink    2      1  No such file or directory
     firefox-bin connect_nocancel   36      1  Operation now in progress
         launchd            mkdir   17      1  File exists
         launchd    open_nocancel    2      1  No such file or directory
[...]
          Google           Chrome    0     35
          Google           Chrome    0     35
        mdworker      getattrlist    2     24  No such file or directory
        mdworker            mkdir   13     24  Permission denied
       TweetDeck           access    2     33  No such file or directory
       TweetDeck             read   35     35  Resource temporarily unavailable
   mDNSResponder          recvmsg   35     38  Resource temporarily unavailable
        mdworker           stat64    2     47  No such file or directory
       gpg-agent    read_nocancel   35     60  Resource temporarily unavailable
        thnuclnt            ioctl   25     60  Inappropriate ioctl for device
            ntpd __pthread_canceled   22     69  Invalid argument
            ntpd        sigreturn   -2     69
            ntpd       sigsuspend    4     69  Interrupted system call
          Google           Chrome    0      0
 activitymonitor        proc_info    3   1495  No such process
This can be another quick way to track down failing or misconfigured applications. Note that (usually) most system call errors are not a problem: it can be normal for system calls to fail, and the calling application handles that condition correctly. errinfo is particularly useful when the application didn't handle the failure correctly, and the system calls are silently failing.
8. bitesize.d
This is a simple DTrace script that characterizes the disk I/O workload, showing a distribution of the size of the I/O in bytes along with the application name:
Brendan-2:~ brendan$ sudo bitesize.d
Tracing... Hit Ctrl-C to end.
^C

     PID  CMD
   31502  vim\0

           value  ------------- Distribution ------------- count
            2048 |                                         0
            4096 |@@@@@@@@@@@@@@@@@@@@@@@@@@@@@@@@         4
            8192 |                                         0
           16384 |@@@@@@@@                                 1
           32768 |                                         0

   54079  Google Chrome\0

           value  ------------- Distribution ------------- count
            2048 |                                         0
            4096 |@@@@@@@@@@@@@@@@@@@@@@@@@@@@@@@@@        18
            8192 |@@@@@@@                                  4
           16384 |                                         0

   86143  bsdtar\0

           value  ------------- Distribution ------------- count
            2048 |                                         0
            4096 |@@@                                      19
            8192 |@@@@                                     23
           16384 |@@                                       12
           32768 |@@@@@@@@@@@@@@@@@@@@@@@                  151
           65536 |@@@@                                     25
          131072 |@@                                       10
          262144 |@@                                       10
          524288 |@                                        8
         1048576 |                                         3
         2097152 |                                         0
The "value" column shows the minimum size of the I/O in bytes, and the "count" column shows the number of I/O in that range: between the minimum size and the next size shown.
To follow an example: the "bsdtar" command shown above performed 151 disk I/Os that were between 32768 bytes and 65535 bytes in size (32K to 64K), which was where most of its I/O fell. The text plot in the middle provides a visualization for the distribution of the events, which shows a spike that corresponds to this 32K to 64K range. Google Chrome did a couple of dozen I/O between 4 and 16 Kbytes.
Disk I/O is an expensive operation, so it's usually preferable for it to be larger in size to improve the throughput to the device.
9. iotop
This presents the same data as iosnoop, but in a summarized way similar to top(1). It's handy when disk I/O is so frequent that iosnoop is too verbose, and you want a high level summary of which process is rattling the disks. Here I've used "-CP" to not clear the screen and provide a rolling output (-C), and to show disk busy percentages (-P):
Brendan-2:~ brendan$ sudo iotop -CP 1
Tracing... Please wait.
2011 Sep 27 19:33:11,  load: 0.74,  disk_r:      0 KB,  disk_w:  57344 KB

  UID    PID   PPID CMD              DEVICE  MAJ MIN D   %I/O
    0  66661  66312 cp               ??       14   2 W     98

2011 Sep 27 19:33:12,  load: 0.74,  disk_r:      4 KB,  disk_w:  55752 KB

  UID    PID   PPID CMD              DEVICE  MAJ MIN D   %I/O
    0  66661  66312 cp               ??       14   2 W     93

2011 Sep 27 19:33:13,  load: 0.68,  disk_r:     60 KB,  disk_w:  54464 KB

  UID    PID   PPID CMD              DEVICE  MAJ MIN D   %I/O
    0  66661  66312 cp               ??       14   2 R     11
    0  66661  66312 cp               ??       14   2 W     88

2011 Sep 27 19:33:14,  load: 0.68,  disk_r:   2560 KB,  disk_w:  32928 KB

  UID    PID   PPID CMD              DEVICE  MAJ MIN D   %I/O
  503  65002    140 TweetDeck        ??       14   2 W      0
    0      1      0 launchd          ??       14   2 W      1
    0  66661  66312 cp               ??       14   2 R     11
    0  66661  66312 cp               ??       14   2 W     71
The "??" is for where some details aren't yet available to DTrace, for the same reason as was described for the iosnoop script (if you are a programmer, you can see what needs to be fixed in the /usr/lib/dtrace/io.d file).
If you get "dynvardrops", sorry: back when I wrote this (6 years ago), I never saw a disk workload heavy enough to cause these. A remedy can be to increase the dynvarsize tunable by adding the following line:
#pragma D option dynvarsize=16m
near this one:
#pragma D option quiet
in /usr/bin/iotop. You may want to make a backup of iotop first (iotop.orig) or copy it somewhere else to run it.
10. maclife.d
This script is from the DTrace book, and traces the creation and deletion of files:
Brendan-2:~ brendan$ sudo ./dtbook/Chap5/maclife.d
TIME(ms)        UID    PID PROCESS      CALL         DIR/FILE
3754594958      503  54079 Google Chrom VNOP_CREATE  Chrome/.com.google.Chrome.K7I9jy
3754597703      503  54079 Google Chrom VNOP_CREATE  -Tmp-/.com.google.Chrome.8MIKKL
3754597703      503  54079 Google Chrom VNOP_REMOVE  -Tmp-/.com.google.Chrome.8MIKKL
3754597703      503  54079 Google Chrom VNOP_CREATE  -Tmp-/.com.google.Chrome.TLlOje
3754597703      503  54079 Google Chrom VNOP_REMOVE  -Tmp-/.com.google.Chrome.TLlOje
3754598365      503  54079 Google Chrom VNOP_CREATE  -Tmp-/.com.google.Chrome.yIwTdE
3754598365      503  54079 Google Chrom VNOP_REMOVE  -Tmp-/.com.google.Chrome.yIwTdE
3754603801      503  65002 TweetDeck    VNOP_CREATE  Cookies/Cookies.plist_tmp_65002_0.dat
3754605028      503  65002 TweetDeck    VNOP_REMOVE  Local Store/td_26_brendangregg.db-journal
3754605026      503  65002 TweetDeck    VNOP_CREATE  Local Store/td_26_brendangregg.db-journal
3754607674      503  65002 TweetDeck    VNOP_CREATE  Local Store/td_26_brendangregg.db-journal
3754607676      503  65002 TweetDeck    VNOP_REMOVE  Local Store/td_26_brendangregg.db-journal
3754609536      503  34852 Adium        VNOP_CREATE  Default/.dat8824.9fa
3754711583      503  17726 thnuclnt     VNOP_CREATE  thnuclnt-17717/thnuclnt.conf-fta17726
3754711587      503  17726 thnuclnt     VNOP_REMOVE  -Tmp-/4e8220118e918
3754711617      503  17726 thnuclnt     VNOP_REMOVE  -Tmp-/4e8220118ead8
3754711620      503  17726 thnuclnt     VNOP_REMOVE  -Tmp-/4e8220119621c
3754711623      503  17726 thnuclnt     VNOP_REMOVE  -Tmp-/4e82201196d7e
3754711624      503  17726 thnuclnt     VNOP_REMOVE  thnuclnt-17717/thnuclnt.conf-fta17726
3754612740      503  31502 vim          VNOP_CREATE  macosx/4913
3754612740      503  31502 vim          VNOP_REMOVE  macosx/4913
3754612741      503  31502 vim          VNOP_CREATE  macosx/top10dtrace.html
3754612741      503  31502 vim          VNOP_REMOVE  macosx/top10dtrace.html~
[...]
Interesting! While tracing I saved the file I was editing in vim, which is seen in the last four lines. This tells me that vim is creating and removing temporary files as part of the save process.
Also note that it looks like TweetDeck created the file twice before removing it (two VNOP_CREATEs followed by a VNOP_REMOVE). This isn't the correct order, which can be seen by examining the TIME(ms) column. A side-effect of DTrace's negligible performance impact design is that output can be slightly shuffled due to the way it collects data from per-CPU buffers. I often include a TIME column like that one, not just for the usefulness of knowing time, but also as a means to post sort the output.
Other Scripts
There are other tools ready-to-go in Mac OS X. If you run the "man -k dtrace" command in a Terminal (or "apropos dtrace"), you'll see the following output:
Brendan-2:~ brendan$ man -k dtrace
[...]
bitesize.d(1m)           - analyse disk I/O size by process. Uses DTrace
cpuwalk.d(1m)            - Measure which CPUs a process runs on. Uses DTrace
creatbyproc.d(1m)        - snoop creat()s by process name. Uses DTrace
dappprof(1m)             - profile user and lib function usage. Uses DTrace
dapptrace(1m)            - trace user and library function usage. Uses DTrace
diskhits(1m)             - disk access by file offset. Uses DTrace
dispqlen.d(1m)           - dispatcher queue length by CPU. Uses DTrace
dtrace(1)                - generic front-end to the DTrace facility
dtruss(1m)               - process syscall details. Uses DTrace
errinfo(1m)              - print errno for syscall fails. Uses DTrace
execsnoop(1m)            - snoop new process execution. Uses DTrace
fddist(1m)               - file descriptor usage distributions. Uses DTrace
filebyproc.d(1m)         - snoop opens by process name. Uses DTrace
hotspot.d(1m)            - print disk event by location. Uses DTrace
httpdstat.d(1m)          - realtime httpd statistics. Uses DTrace
iofile.d(1m)             - I/O wait time by file and process. Uses DTrace
iofileb.d(1m)            - I/O bytes by file and process. Uses DTrace
iopattern(1m)            - print disk I/O pattern. Uses DTrace
iopending(1m)            - plot number of pending disk events. Uses DTrace
iosnoop(1m)              - snoop I/O events as they occur. Uses DTrace
iotop(1m)                - display top disk I/O events by process. Uses DTrace
kill.d(1m)               - snoop process signals as they occur. Uses DTrace
lastwords(1m)            - print syscalls before exit. Uses DTrace
loads.d(1m)              - print load averages. Uses DTrace
newproc.d(1m)            - snoop new processes. Uses DTrace
opensnoop(1m)            - snoop file opens as they occur. Uses DTrace
pathopens.d(1m)          - full pathnames opened ok count. Uses DTrace
pidpersec.d(1m)          - print new PIDs per sec. Uses DTrace
plockstat(1)             - front-end to DTrace to print statistics about POSIX mutexes and read/write locks
priclass.d(1m)           - priority distribution by scheduling class. Uses DTrace
pridist.d(1m)            - process priority distribution. Uses DTrace
procsystime(1m)          - analyse system call times. Uses DTrace
runocc.d(1m)             - run queue occupancy by CPU. Uses DTrace
rwbypid.d(1m)            - read/write calls by PID. Uses DTrace
rwbytype.d(1m)           - read/write bytes by vnode type. Uses DTrace
rwsnoop(1m)              - snoop read/write events. Uses DTrace
sampleproc(1m)           - sample processes on the CPUs. Uses DTrace
seeksize.d(1m)           - print disk event seek report. Uses DTrace
setuids.d(1m)            - snoop setuid calls as they occur. Uses DTrace
sigdist.d(1m)            - signal distribution by process. Uses DTrace
syscallbypid.d(1m)       - syscalls by process ID. Uses DTrace
syscallbyproc.d(1m)      - syscalls by process name. Uses DTrace
syscallbysysc.d(1m)      - syscalls by syscall. Uses DTrace
topsyscall(1m)           - top syscalls by syscall name. Uses DTrace
topsysproc(1m)           - top syscalls by process name. Uses DTrace
weblatency.d(1m)         - website latency statistics. Uses DTrace
Plus more in the DTrace book.
And More...
DTrace isn't just about running scripts; you can write your own custom scripts, run one-liners, and use higher-level tools that use DTrace behind the scenes, like Apple's Instruments and Joyent's Cloud Analytics. And it's for more than just your MacBook: if you are using servers that have DTrace available, you can use it to diagnose their performance and issues too, including tracing kernel and application code. I regularly use it to see how a MySQL database interacts with a kernel file system, for example.
For more reading about DTrace, you can see my other posts on DTrace, other blogs on dtrace.org, the original 410 page DTrace guide, 1100 page DTrace book, and my original DTrace page (which includes the DTraceToolkit). It's a little old now (and I think prustat needs updating), but there's also Matty's Top Ten DTrace Scripts, which includes some of those above; and Greg Miller's Exploring Leopard with DTrace, which includes Objective-C tracing.
For another post on Mac OS X performance, see my USE Method-based Mac OS X performance checklist.