At the Southern California Linux Expo (SCALE 13x) last weekend, I gave a talk on Linux Profiling at Netflix using perf_events (aka "perf"). I covered:
- How to get CPU profiling to work, including tricky targets like Java and Node.js.
- A tour of perf_events capabilities.
Quick and complete CPU profiling is something everyone should be able to do. It turns out to be tricky, however, due to various gotchas I covered in the talk, including fixing stacks and symbols.
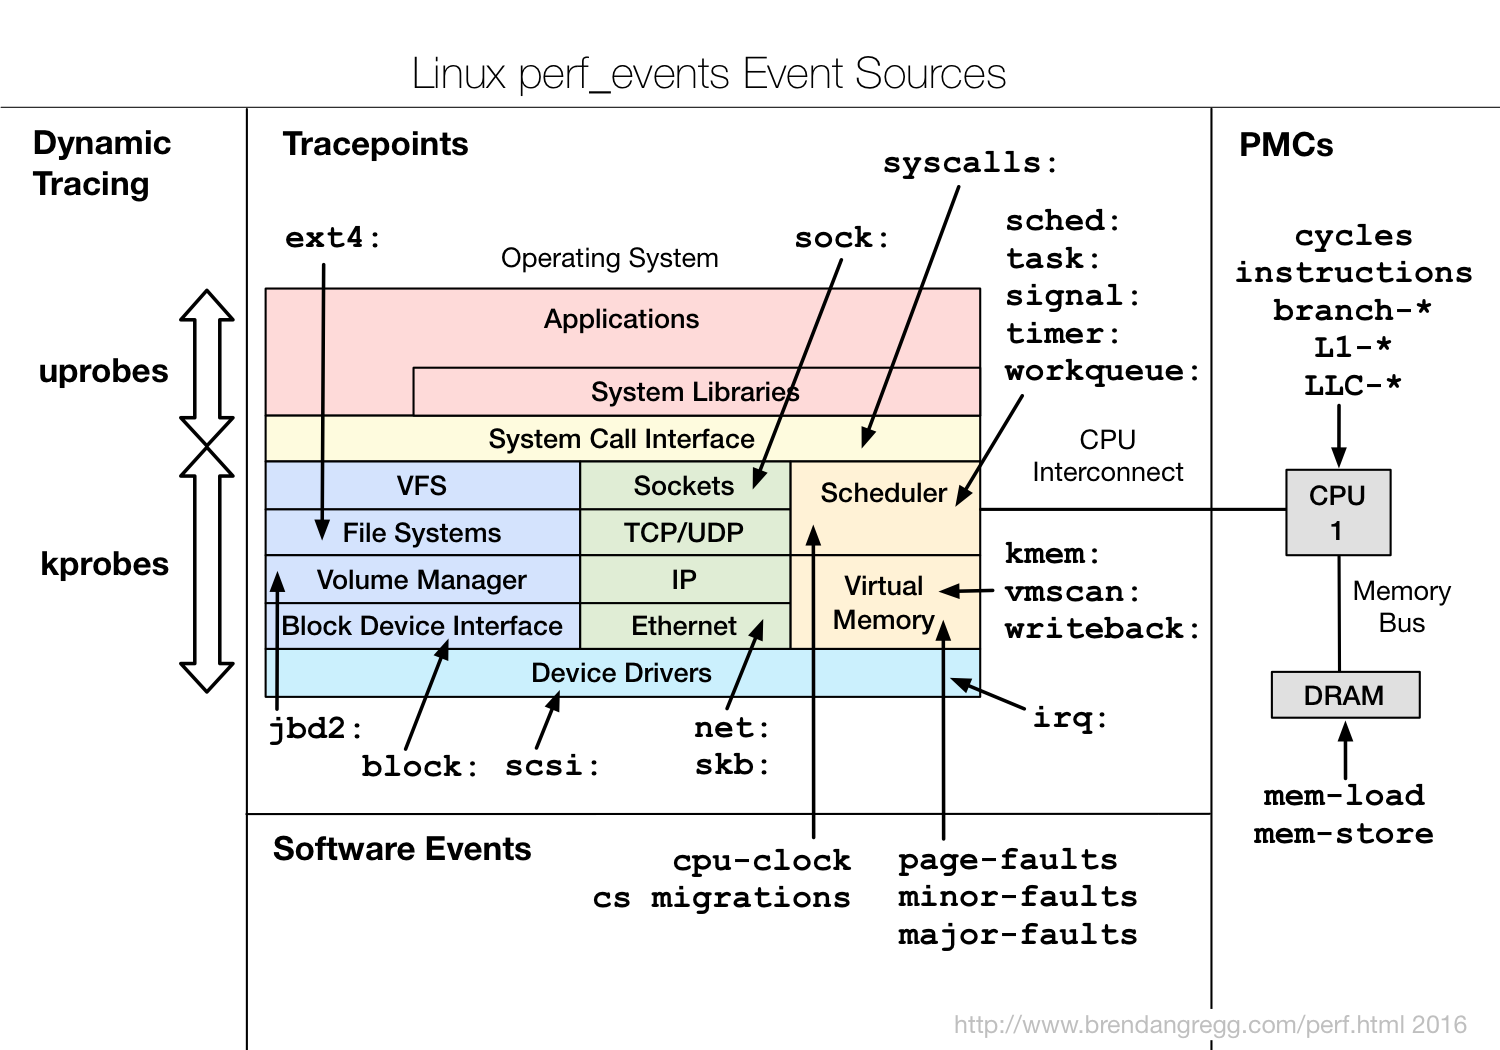
I also included a new map to show the events perf can instrument:

The room for my talk was full, and some people couldn't get in. Fortunately it was recorded, by two cameras: the room livestream and one in the front row:
The slides for the talk are also on slideshare:
There is material in this talk that I've shared for the first time: covering how to really get CPU profiling to work for Java. This is of particular importance at Netflix, since most of our application environment is Java.
Linux perf_events is an excellent profiler, since it works asynchronously (no JVM safety point sampling issues), and it can inspect the full stack: JVM internals, system libraries, Java code, and the kernel. No matter where a CPU issue is, perf_events can find it.
My highlight of the talk was a mixed-mode CPU flame graph of Java (slide 8), which I've included below as an embedded SVG:
Click to zoom. Showing all CPU usage with Java context is amazing and useful. We recently found an issue using these flame graphs where CPU time was mostly spent in the JVM compiler. This issue was invisible to other Java profilers, which only focus on the execution of Java code.
As I covered in the talk, getting these full Java stack profiles to work is tricky, and currently involves patching OpenJDK to fix the frame pointer. My patch has been filed as JDK-8068945, although I hope this becomes an option in both OpenJDK and OracleJDK (eg, -XX:MoreFramePointer). I also started a thread about this on the hotspot compiler dev mailing list.
If you're not interested in Java profiling, I'd still recommend watching this talk. Java makes for an interesting use case for getting system profiling to work, and the same issues may be encountered in other runtimes.
In the talk I included a crash course for perf_events, and many one-liners to tour its capabilities. These included one-liners for counting events, profiling, static tracing, and dynamic tracing. Some examples:
# Sample CPU stack traces for the specified PID, at 99 Hertz, for 10 seconds:
perf record -F 99 -p PID -g -- sleep 10

# Sample CPU stack traces for the entire system, at 99 Hertz, for 10 seconds:
perf record -F 99 -ag -- sleep 10

# Sample CPU stack traces, once every 10,000 Level 1 data cache misses, for 5 s:
perf record -e L1-dcache-load-misses -c 10000 -ag -- sleep 5

# Sample CPU stack traces, once every 100 last level cache misses, for 5 seconds:
perf record -e LLC-load-misses -c 100 -ag -- sleep 5

# Sample on-CPU kernel instructions, for 5 seconds:
perf record -e cycles:k -a -- sleep 5
...
For more about perf, see my perf_events page which has full lists of these one-liners, the perf wiki, and the documentation in the Linux source under tools/perf/Documentation.
SCALE, as always, is a really good conference, and I had a great time meeting people and listing to what others are working on. My thanks to the volunteers who run SCALE, as well as Deirdré Straughan for editing the video, and Harsh Karmarkar from Apcera for running the camera.


Click here for Disqus comments (ad supported).