

System performance analysis is an enormous topic, and it's a challenge to know what can be analyzed and how. At the last MeetBSD CA, I gave a talk titled "Performance Analysis" where I discussed five key facets of this topic: observability tools, methodologies, benchmarking, profiling, and tracing. I'd recommend this talk for anyone working in the BSD family of operating systems.
For the talk I created an observability tools diagram for FreeBSD:
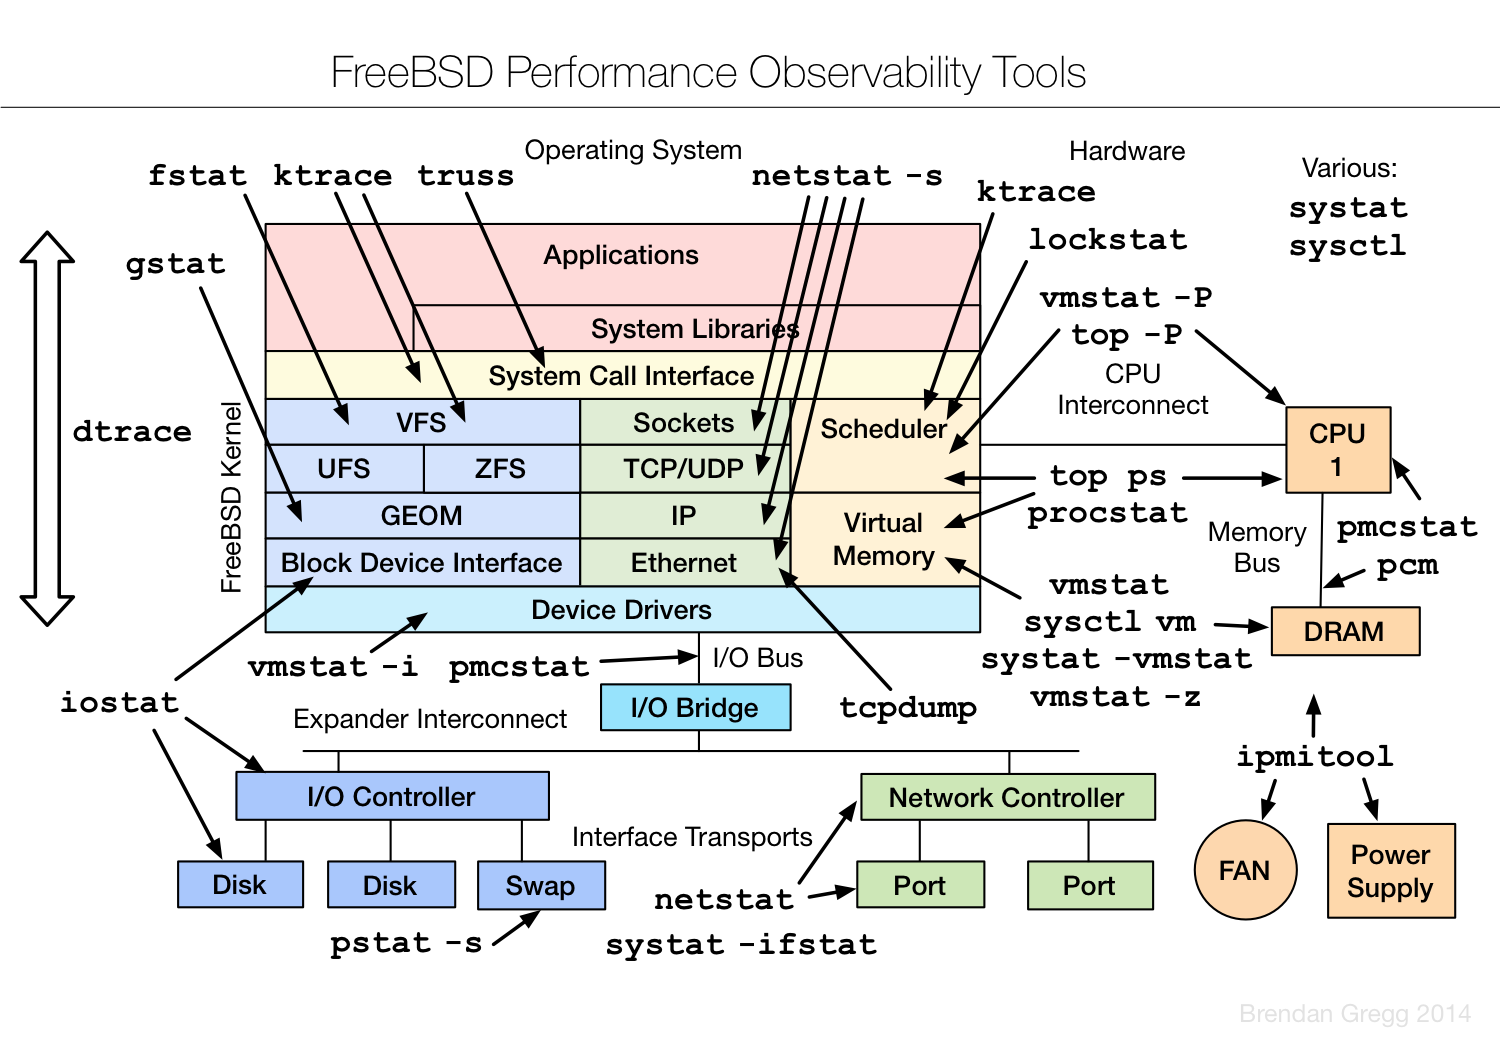
I have this, and my Linux ones, printed out and hung up around my desk. It helps jog the memory, especially when I'm switching between operating systems.
The slides for my talk are on slideshare:
The talk was also videoed (thanks, iXsystems), which is on youtube:
Apart from the slide content, my talk included additional discussion and live demos of profiling the Netflix Open Connect Appliances (OCAs), which stream our content. I even did some cscope browsing of kernel source, to understand tracing targets.
FreeBSD has the most advanced performance analysis toolset, which includes pmcstat(8) for CPU performance monitoring counter (PMC) analysis, and DTrace for static and dynamic tracing. On Linux I can get the same jobs done, but it sometimes feels like I can't get out of second gear. On FreeBSD, I can fly.
For pmcstat(8), I came up with a neat diagram for the PMC groups:
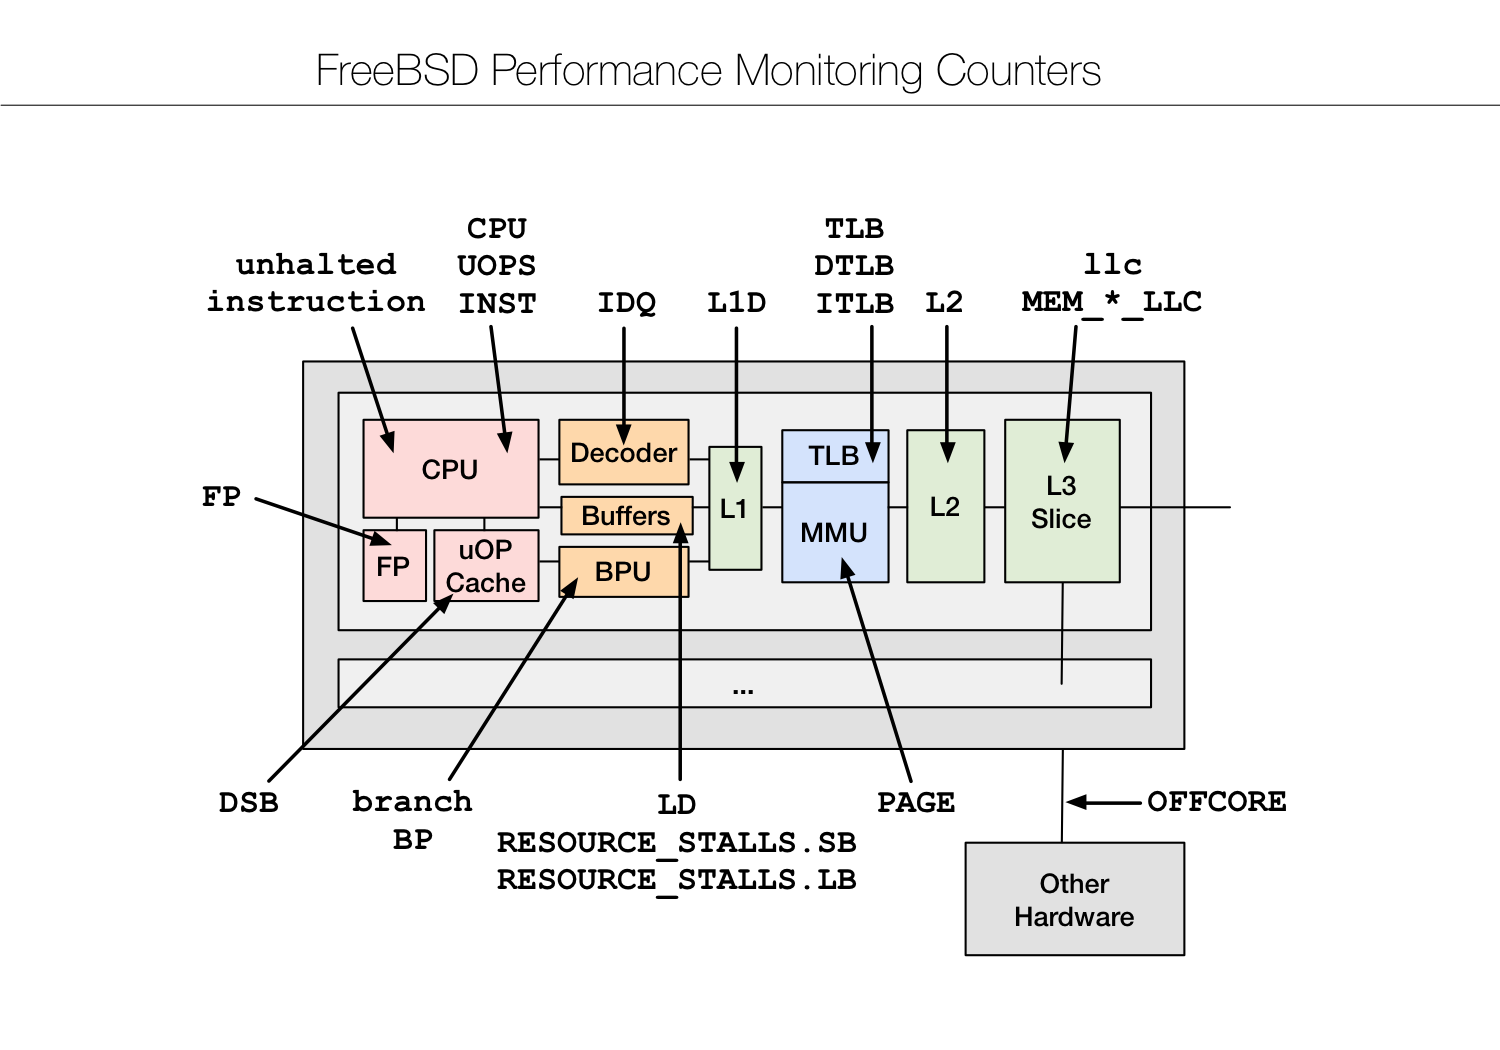
I'm pretty happy with how this turned out. I do want to improve it next time I use it, and try to highlight frontend vs backend stall cycles, since that can be a useful approach for CPU analysis.
This is also an example of how more developed performance analysis is on FreeBSD: I tried to create this diagram for Linux perf_events for my SCALE 13x talk, but it was lacking so many PMC groups that I didn't use it. Linux can get the job done, but more often you'll need to use the raw PMC counter specifications from the Intel manual. Stuck in second gear again.
Just before the talk I published a collection of DTrace scripts (DTrace-tools) which I wrote for the Netflix OCAs, and are installed by default. I'll find a better home for these (FreeBSD wiki or source).
In the talk I said I should have written a script beforehand for measuring storage I/O size, without using the DTrace io provider, as there is a bug in its translator (involving struct types). Here's one way, by instrumenting GEOM using dynamic tracing:
# dtrace -n 'fbt::g_disk_start:entry { @ = quantize(args[0]->bio_length); }'
dtrace: description 'fbt::g_disk_start:entry ' matched 1 probe
^C

           value  ------------- Distribution ------------- count
            2048 |                                         0
            4096 |@@                                       196
            8192 |@                                        147
           16384 |                                         4
           32768 |                                         1
           65536 |                                         32
          131072 |                                         0
          262144 |                                         0
          524288 |                                         0
         1048576 |@@@@@@@@@@@@@@@@@@@@@@@@@@@@@@@@@@@@@    4799
         2097152 |                                         0
This histogram shows that most of the I/O fell into the 1-2 Mbyte bucket, which explains the 1 millisecond minimum latency from my demo. These Netflix OCAs are tuned for streaming workloads.
I enjoyed meeting others in the BSD community at MeetBSD CA, and watching the talks. I was a little surprised at how welcoming, happy, and relaxed the BSD community is. I've been to Linux events recently (SCALE is an exception) where the mood felt a bit tense: hallway conversations were about Linus's attitude, and whether that's ok, and how much people hate or love systemd. Things are currently much more relaxed in BSD land!
I hope you like my talk. Check out the playlist for other MeetBSD CA talks. The day after this talk, I gave another on FreeBSD flame graphs, which I'll describe in a follow up post.
Click here for Disqus comments (ad supported).