

Most instance analysis and monitoring products of today are neither interesting nor are solving new problems. It's usually the same old sar metrics as line graphs. That was great... 20 years ago.
If you haven't used the sar(1) tool, you are likely familiar with its metrics: load averages, CPU utilization, disk IOPS, disk average latency, etc. These are useful and do solve problems, but today they are the basics. There are many more operating system metrics, analysis capabilities, and visualizations that are possible, and should be included in Linux instance analysis tools.
Last week I spoke at Monitorama in Portland on Netflix instance analysis requirements and desirables. For vendors, this shows what's actually interesting and required. For customers, what you can ask for.
The video is on vimeo:
And the slides are on slideshare:
The performance monitoring industry has dozens of companies focused on application performance monitoring, and on network performance monitoring and diagnostics. Gartner has previously estimated these industries to be $1.8 billion and $1 billion respectively. Many of their products include some form of server or instance analysis capabilities, however, most are just sar metrics.
I asked one monitoring vendor why they hadn't included latency heat maps, and their answer was that they build what customers ask for, and not enough customers had asked. This reminded me of the quote:
If I had asked people what they wanted, they would have said faster horses.
(This is often attributed to Henry Ford, although he probably never said it.)
I don't want a faster horse... I don't want another sar-metrics-as-line-graphs product that's somewhat better than the others. I want something radically different.
I covered what we do want and desire in the talk, which included the following visual checklist:
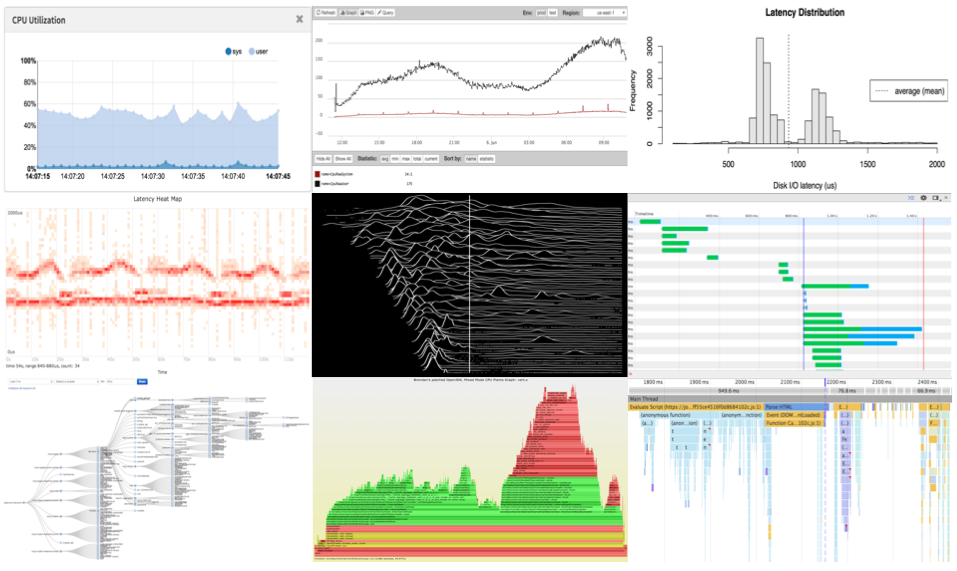
Performance Analysis Visualizations
How many of these does your instance monitoring tool currently have?
We generally have to build our own tools for this. For example, we've been using flame graphs ad hoc at Netflix for over a year for instance analysis, and now we're developing them into our Vector analysis tool. I've also published perf-tools for deeper systems analysis.
There were two other talks from Netflix at Monitoroma:
- Roy Rapoport, who runs the insight team that builds our cloud-wide monitoring tool Atlas, gave a talk titled operational insight concepts and examples. See the video and slides.
- Sergey Fedorov gave a talk on monitoring the Open Connect Appliance: our FreeBSD CDN which streams the content. See the video and slides.
There were many other interesting talks at Monitorama, and the videos have been posted already. Thanks Jason Dixon and the Monitorama crew for organizing a great conference!
Click here for Disqus comments (ad supported).