

Ubuntu 16.04 LTS (aka Ubuntu Xenial) was released about two months ago, and can run new performance analysis and troubleshooting tools thanks to its Linux 4.4 kernel. These tools use enhanced BPF, and there's a growing number of front ends, including bcc, which I've written about before. Let's take a quick look.
Installation
The following three commands install bcc on Xenial, and are from the Ubuntu Xenial install docs (UPDATED 3-Oct-2016):
# echo "deb [trusted=yes] https://repo.iovisor.org/apt/xenial xenial-nightly main" | sudo tee /etc/apt/sources.list.d/iovisor.list
deb [trusted=yes] https://repo.iovisor.org/apt/xenial xenial-nightly main
# sudo apt-get update
[...]
# sudo apt-get install bcc-tools
Reading package lists... Done
Building dependency tree
Reading state information... Done
The following additional packages will be installed:
  binutils libbcc libpython-stdlib libpython2.7-minimal libpython2.7-stdlib python python-bcc python-minimal python2.7 python2.7-minimal
Suggested packages:
  binutils-doc python-doc python-tk python2.7-doc binfmt-support
The following NEW packages will be installed:
  bcc-tools binutils libbcc libpython-stdlib libpython2.7-minimal libpython2.7-stdlib python python-bcc python-minimal python2.7 python2.7-minimal
0 upgraded, 11 newly installed, 0 to remove and 80 not upgraded.
Need to get 17.2 MB of archives.
After this operation, 69.3 MB of additional disk space will be used.
Do you want to continue? [Y/n] y
[...]
At some point bcc-tools should also be available as an Ubuntu snap, making the install process even easier. The bcc install docs also contain instructions for an Ubuntu source build of bcc, which you can do if you want to develop your own bcc tools.
Screenshots
Tools appear under /usr/share/bcc/tools. Eg, tracing disk I/O:
# /usr/share/bcc/tools/biosnoop
TIME(s)        COMM           PID    DISK    T  SECTOR    BYTES   LAT(ms)
0.000000000    bash           2952   sda     R  9457088   4096       0.99
0.000979000    bash           2952   sda     R  9457072   4096       0.48
0.001760000    bash           2952   sda     R  9483416   4096       0.43
0.006208000    bash           2967   sda     R  9667584   16384      0.39
0.007636000    cksum          2967   sda     R  9667616   16384      0.66
0.009509000    cksum          2967   sda     R  9664280   53248      0.92
0.010854000    cksum          2967   sda     R  6119520   4096       0.41
0.011985000    cksum          2967   sda     R  9661832   4096       0.35
0.013343000    cksum          2967   sda     R  5887144   24576      0.75
0.014787000    cksum          2967   sda     R  6047760   16384      0.54
[...]
This is more efficient than my earlier versions of this tool, as it times events in kernel context, and only sends the summary lines to user space for printing.
Perhaps that's overkill, and you just want to see the latency distribution. Here's biolatency:
# /usr/share/bcc/tools/biolatency
Tracing block device I/O... Hit Ctrl-C to end.
^C
     usecs               : count     distribution
         0 -> 1          : 0        |                                        |
         2 -> 3          : 0        |                                        |
         4 -> 7          : 0        |                                        |
         8 -> 15         : 0        |                                        |
        16 -> 31         : 2        |                                        |
        32 -> 63         : 1        |                                        |
        64 -> 127        : 4        |*                                       |
       128 -> 255        : 8        |***                                     |
       256 -> 511        : 86       |************************************    |
       512 -> 1023       : 94       |****************************************|
      1024 -> 2047       : 43       |******************                      |
      2048 -> 4095       : 1        |                                        |
This tool uses BPF to create a custom histogram that is counted in kernel context, for efficiency. Only an array of numbers (the "count" column) is transferred to user space.
These tools usually have Unix-like usage, eg:
# cd /usr/share/bcc/tools
# ./biolatency -h
usage: biolatency [-h] [-T] [-Q] [-m] [-D] [interval] [count]

Summarize block device I/O latency as a histogram

positional arguments:
  interval            output interval, in seconds
  count               number of outputs

optional arguments:
  -h, --help          show this help message and exit
  -T, --timestamp     include timestamp on output
  -Q, --queued        include OS queued time in I/O time
  -m, --milliseconds  millisecond histogram
  -D, --disks         print a histogram per disk device

examples:
    ./biolatency            # summarize block I/O latency as a histogram
    ./biolatency 1 10       # print 1 second summaries, 10 times
    ./biolatency -mT 1      # 1s summaries, milliseconds, and timestamps
    ./biolatency -Q         # include OS queued time in I/O time
    ./biolatency -D         # show each disk device separately
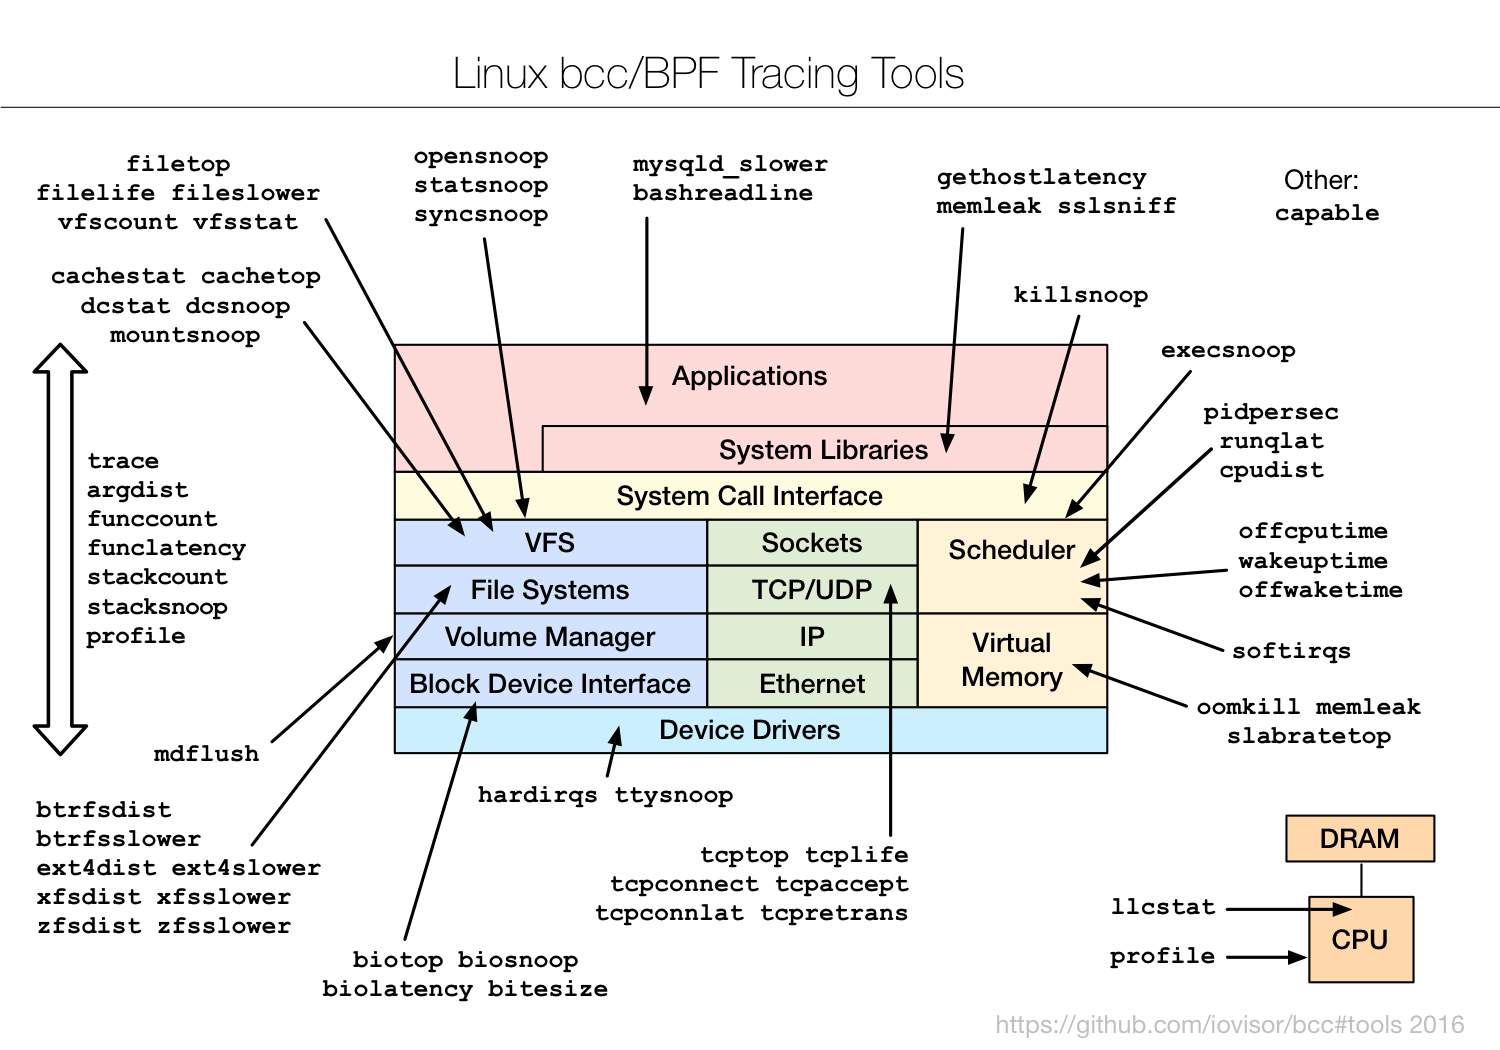
There are lots more tools so far, and more will be added. Here's a diagram:
Finally, one more of my favorites, ext4slower, which can show I/O slower than a custom threshold, timed and filtered in kernel context:
# ./ext4slower 1
Tracing ext4 operations slower than 1 ms
TIME     COMM           PID    T BYTES   OFF_KB   LAT(ms) FILENAME
03:36:05 cksum          2738   R 29162   0           1.32 h2ph
03:36:05 cksum          2738   R 27280   0           1.39 hostid
03:36:05 cksum          2738   R 65536   0           1.15 info
03:36:05 cksum          2738   R 65536   0           1.01 lexgrog
03:36:05 cksum          2738   R 1577    0           2.10 linux-boot-prober
03:36:05 cksum          2738   R 65536   0           1.14 localectl
03:36:05 cksum          2738   R 65536   128         1.48 localectl
03:36:05 cksum          2738   R 65536   0           1.04 ltrace
03:36:05 cksum          2738   R 65536   128         1.84 ltrace
03:36:05 cksum          2738   R 65536   640         1.25 lxc
03:36:06 cksum          2738   R 65536   11008       5.37 lxd
You can browse the *example.txt files in the bcc tools directory for more screenshots and examples. Some are single-purpose tools, like biolatency and ext4slower, and some are multi-tools, like trace and argdist.
Documentation
All tools have man pages, and example files (see previous links).
# export MANPATH=$MANPATH:/usr/share/bcc/man
# man biosnoop
biosnoop(8)                 System Manager's Manual                biosnoop(8)

NAME
       biosnoop - Trace block device I/O and print details incl. issuing PID.

SYNOPSIS
       biosnoop

DESCRIPTION
       This  tools  traces  block device I/O (disk I/O), and prints a one-line
       summary for each I/O showing various details. These include the latency
       from the time of issue to the device to its completion, and the PID and
       process name from when the I/O was first created (which usually identi‐
       fies the responsible process).
[...]
Caveats
Usual warnings about tracers apply: even though BPF is JIT-optimized kernel context summaries, you could trace such a high frequency of events (millions/sec) that the performance overhead slows other apps. Test in a lab environment before use.
Ubuntu Xenial is also a 4.4 kernel, and the bcc tools are developed for the latest kernel, so some tools may not work. We've been putting older versions under /usr/share/bcc/tools/old, which might be worth checking. For example, tools that print stack traces (eg, stackcount) won't work on Xenial (which is missing the newer BPF stack trace support), but the tools/old versions may work instead (although they were workarounds until proper support existed).
bcc/BPF has more capabilities that the tools don't use yet, but will over time. See my bcc/BPF road ahead post for what's next.
Click here for Disqus comments (ad supported).