

These are rough notes.
Disk %busy went to 80% on a jenkins host. Why? Cloud-wide monitoring (Atlas) showed this for an instance:
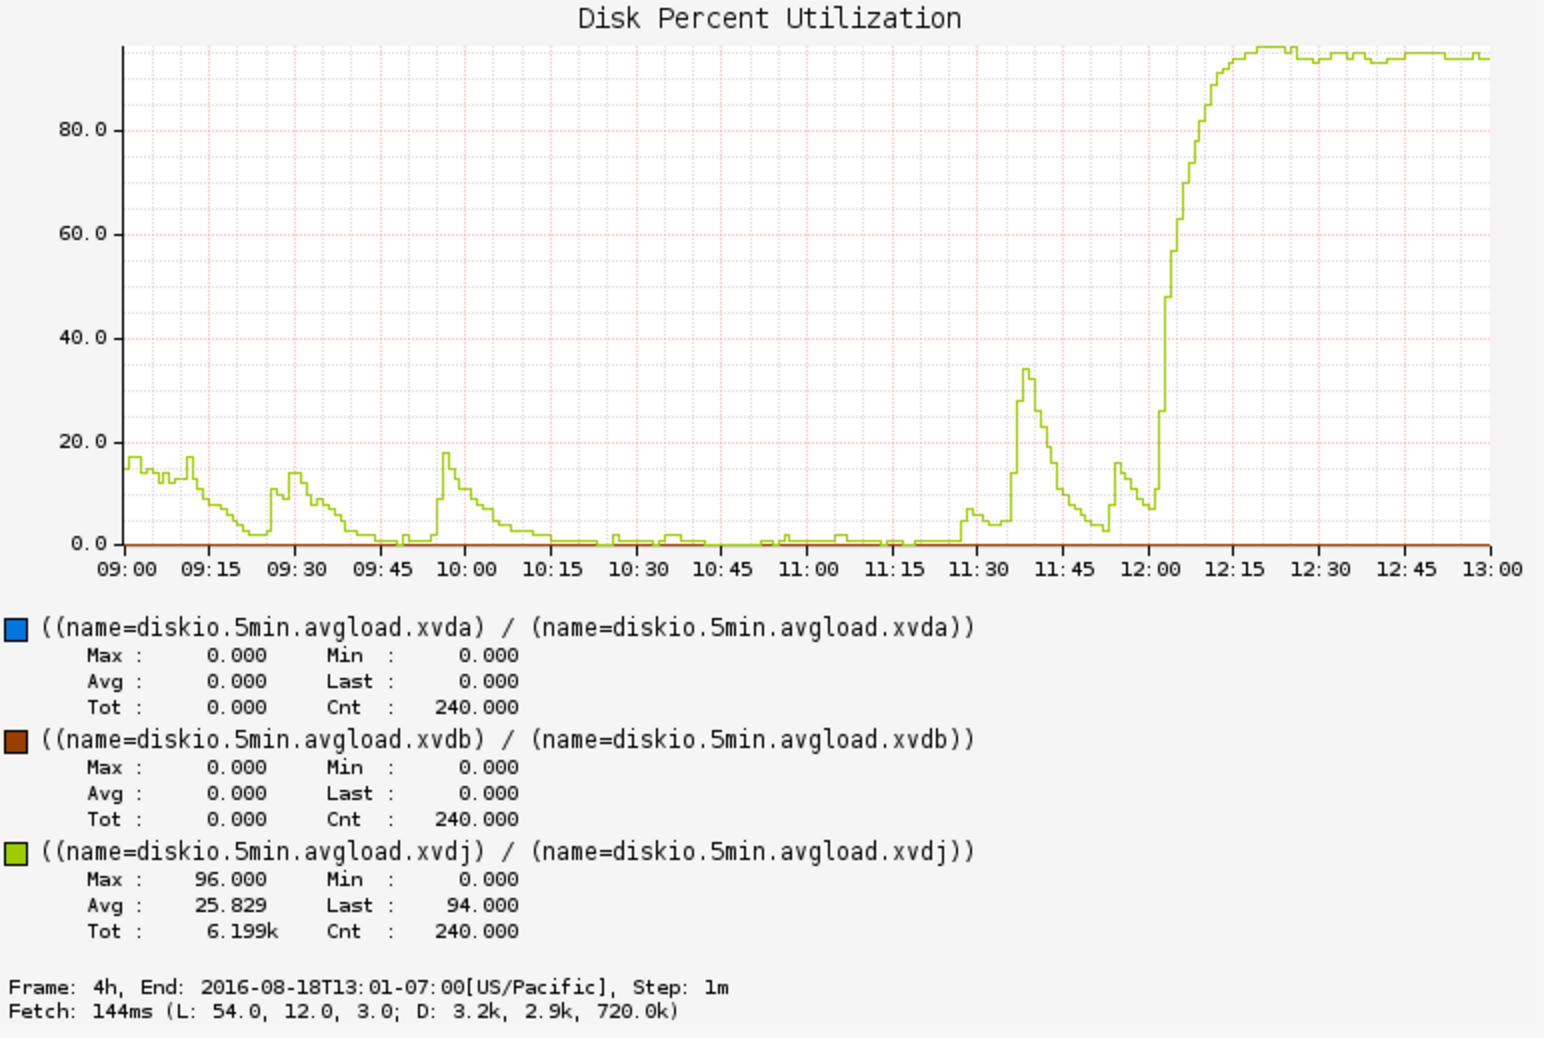
Disk utilization was well over 80% and steady (1 minute averages).
I ran some CLI tools:
# iostat –x 1
[…]
avg-cpu:  %user   %nice %system %iowait  %steal   %idle
           5.37    0.00    0.77    0.00    0.00   93.86

Device:   rrqm/s   wrqm/s     r/s     w/s    rkB/s    wkB/s avgrq-sz avgqu-sz   await r_await w_await  svctm  %util
xvda        0.00     0.00    0.00    0.00     0.00     0.00     0.00     0.00    0.00    0.00    0.00   0.00   0.00
xvdb        0.00     0.00    0.00    0.00     0.00     0.00     0.00     0.00    0.00    0.00    0.00   0.00   0.00
xvdj        0.00     0.00  139.00    0.00  1056.00     0.00    15.19     0.88    6.19    6.19    0.00   6.30  87.60
[…]
This shows an average disk I/O latency of about 6 milliseconds (await). Not unusual as an average for rotational disks and random disk I/O.
I also used my kernel tracing perf-tools to measure disk I/O latency histograms:
# /apps/perf-tools/bin/iolatency 10
Tracing block I/O. Output every 10 seconds. Ctrl-C to end.

  >=(ms) .. <(ms)   : I/O      |Distribution                          |
       0 -> 1       : 421      |######################################|
       1 -> 2       : 95       |#########                             |
       2 -> 4       : 48       |#####                                 |
       4 -> 8       : 108      |##########                            |
       8 -> 16      : 363      |#################################     |
      16 -> 32      : 66       |######                                |
      32 -> 64      : 3        |#                                     |
      64 -> 128     : 7        |#                                     |
^C
Looks like 7200 RPM disks, bi-modal, with some queueing. But disks normally behave like this under high load. This points towards a problem of workload and not the target.
# /apps/perf-tools/bin/iosnoop
Tracing block I/O. Ctrl-C to end.
COMM         PID    TYPE DEV      BLOCK        BYTES     LATms
java         30603  RM   202,144  1670768496   8192       0.28
cat          6587   R    202,0    1727096      4096      10.07
cat          6587   R    202,0    1727120      8192      10.21
cat          6587   R    202,0    1727152      8192      10.43
java         30603  RM   202,144  620864512    4096       7.69
java         30603  RM   202,144  584767616    8192      16.12
java         30603  RM   202,144  601721984    8192       9.28
java         30603  RM   202,144  603721568    8192       9.06
java         30603  RM   202,144  61067936     8192       0.97
java         30603  RM   202,144  1678557024   8192       0.34
java         30603  RM   202,144  55299456     8192       0.61
java         30603  RM   202,144  1625084928   4096      12.00
java         30603  RM   202,144  618895408    8192      16.99
java         30603  RM   202,144  581318480    8192      13.39
java         30603  RM   202,144  1167348016   8192       9.92
java         30603  RM   202,144  51561280     8192      22.17
[...]
Again, looks bi-modal, with I/O taking 10 ms and higher. Mostly java. I should check the stacks that issued I/O, but wait...what's TYPE=M?
I'm printing a standard flag string from the kernel – the rwbs field – which is encoded that way. I saw it asked online once what the characters mean. I replied that they weren't documented, and you had to read the kernel code. They said I was wrong, they were documented in a man page. Huh. Well I’m an idiot. What man page? It was my own man page.
# perf record -e block:block_rq_issue --filter rwbs ~ "*M*" -g -a
# perf report -n –stdio
[...]
# Overhead       Samples       Command      Shared Object                Symbol
# ........  ............  ............  .................  ....................
#
    70.70%           251          java  [kernel.kallsyms]  [k] blk_peek_request
                    |
                    --- blk_peek_request
                        do_blkif_request
                        __blk_run_queue
                        queue_unplugged
                        blk_flush_plug_list
                        blk_finish_plug
                        _xfs_buf_ioapply
                        xfs_buf_iorequest
                       |
                       |--88.84%-- _xfs_buf_read
                       |          xfs_buf_read_map
                       |          |
                       |          |--87.89%-- xfs_trans_read_buf_map
                       |          |          |
                       |          |          |--97.96%-- xfs_imap_to_bp
                       |          |          |          xfs_iread
                       |          |          |          xfs_iget
                       |          |          |          xfs_lookup
                       |          |          |          xfs_vn_lookup
                       |          |          |          lookup_real
                       |          |          |          __lookup_hash
                       |          |          |          lookup_slow
                       |          |          |          path_lookupat
                       |          |          |          filename_lookup
                       |          |          |          user_path_at_empty
                       |          |          |          user_path_at
                       |          |          |          vfs_fstatat
                       |          |          |          |
                       |          |          |          |--99.48%-- SYSC_newlstat
                       |          |          |          |          sys_newlstat
                       |          |          |          |          system_call_fastpath
                       |          |          |          |          __lxstat64
                       |          |          |          |Lsun/nio/fs/UnixNativeDispatcher;.lstat0
                       |          |          |          |          0x7f8f963c847c
All coming from stat(). The developers then realized they had enabled an app called "DiskUsageMonitor", which constantly stat()s the file system to track used space.
Disabling DiskUsageMonitor fixed the issue immediately:
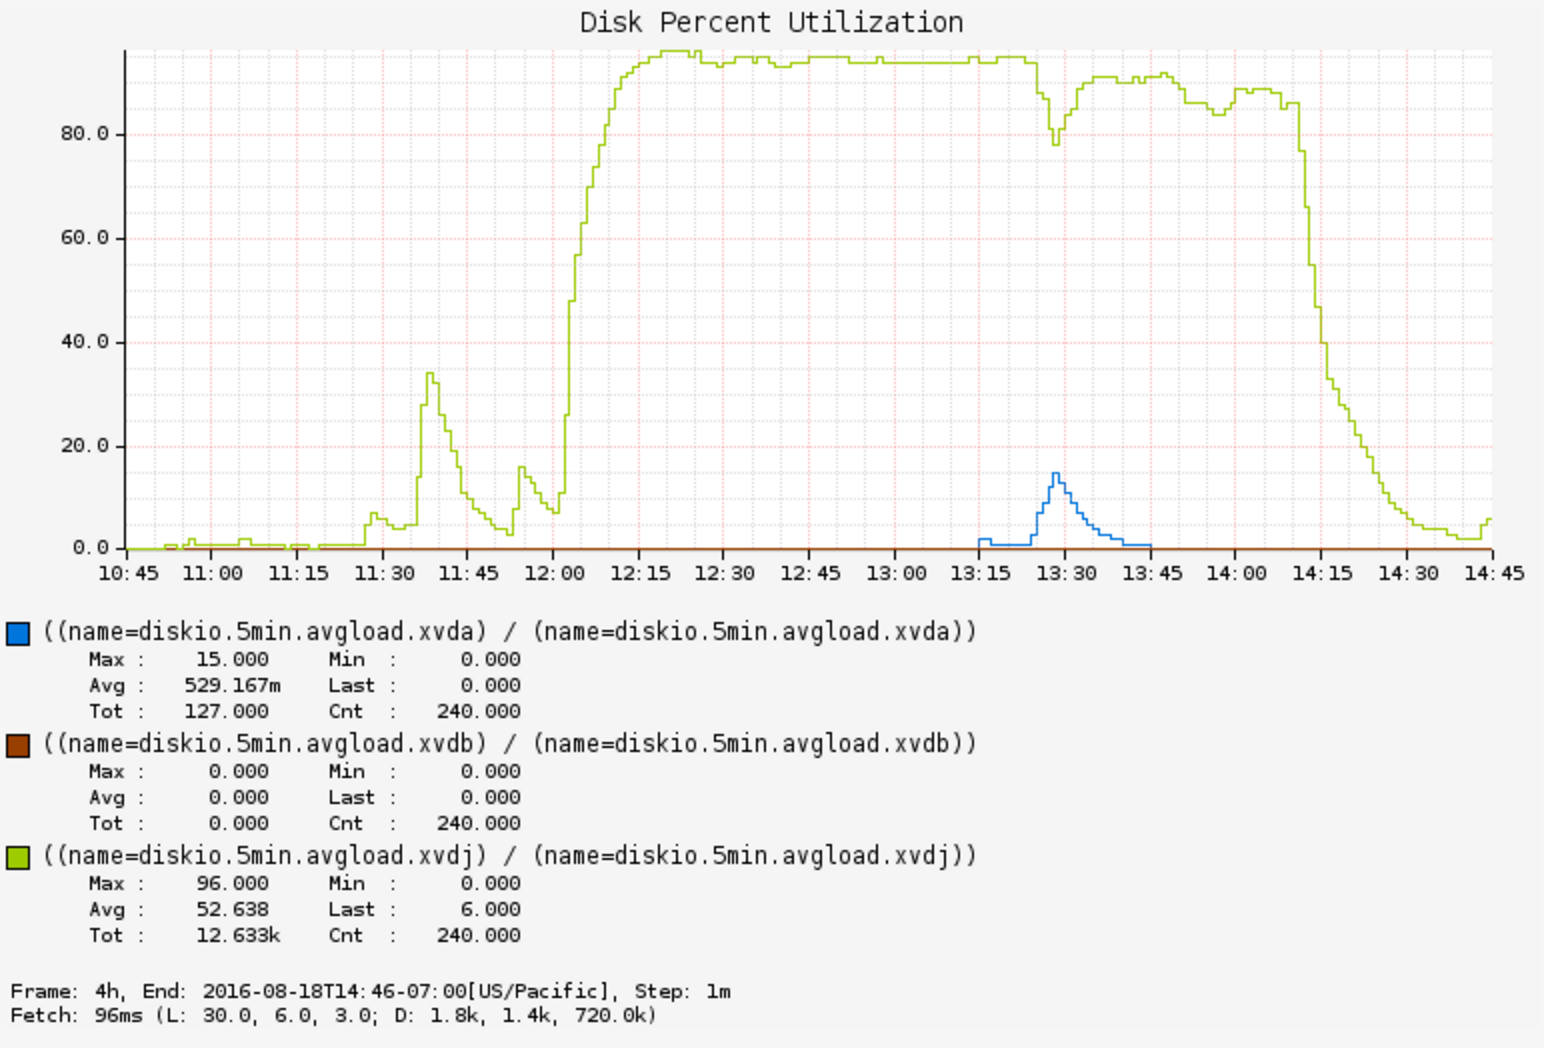
It's not the first time I've seen a monitoring tool cause a performance issue, and it won't be the last.
As this was a neat short example of using kernel tracing tools, I've used it in a talk at Facebook. It predates eBPF being available on these production hosts, so the perf-tools I was using are perf and Ftrace based.