

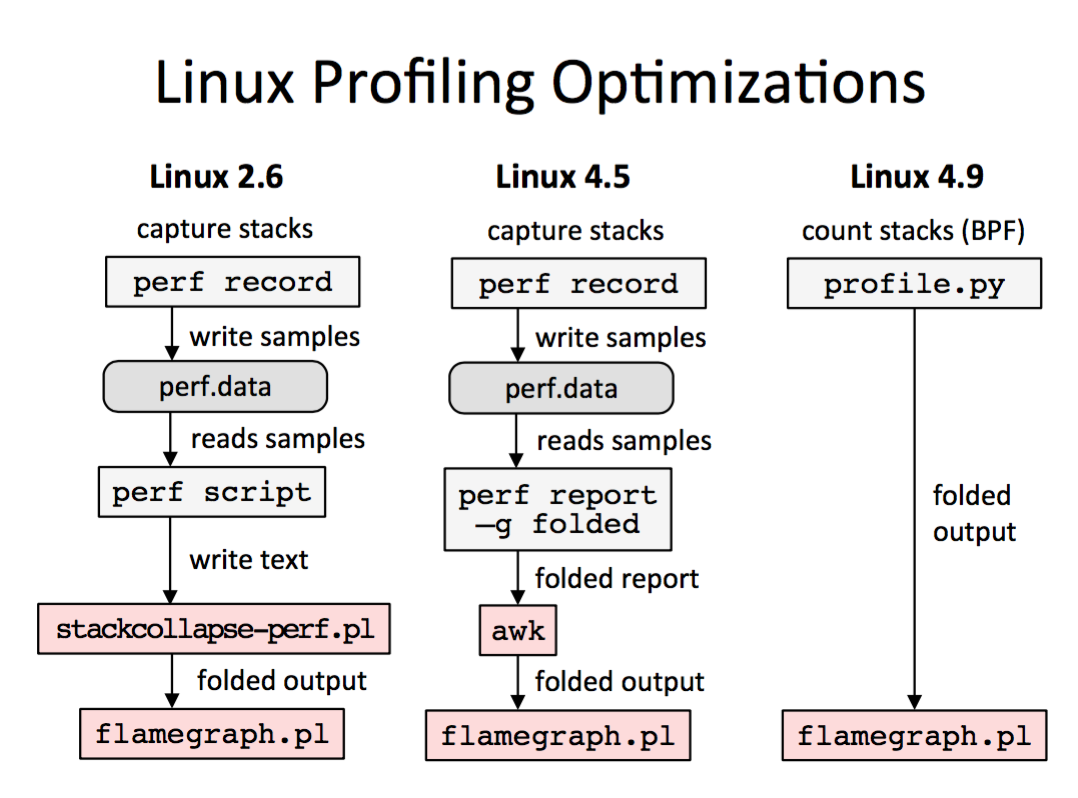
BPF-optimized profiling arrived in Linux 4.9-rc1 (patchset), allowing the kernel to profile via timed sampling and summarize stack traces. Here's how I explained it recently in a talk alongside other prior perf methods for CPU flame graph generation:
Linux 4.9 skips needing the perf.data file entirely, and its associated overheads. I wrote about this as a missing BPF feature in March. It is now done.
In detail:
- Linux 2.6: perf record dumps all stack samples to a binary perf.data file for post-processing in user space. This is copied via a ring buffer, and perf wakes up an optimal number of times to read that buffer, so this has already been optimized somewhat. With low frequency sampling (<50 Hertz), it would be hard to measure the runtime overhead. The post-processing, however, could take up to several seconds of CPU time (and some disk I/O for perf.data) for a busy application and many CPUs.
- Linux 4.5: The prior use of stackcollapse-perf.pl was to frequency count stack traces, but really, the perf command has this capability, it just couldn't emit output in the folded format (stack traces on single lines, with frames delimitered by ";"). Linux 4.5 added a "-g folded" option to perf report, making this workflow more efficient. I blogged about this previously.
- Linux 4.9: BPF was enhanced (eBPF) to attach to perf_events, which are created by perf_event_open() with a PERF_EVENT_IOC_SET_BPF ioctl() to attach a BPF program. Voilà! Timed samples can now run BPF programs. BPF already had the capability to walk stack traces and frequency count them, added in Linux 4.6, we just needed this capability to attach it to timed samples.
I developed profile.py for bcc tools as a BPF profiler (see example output), which uses this new Linux 4.9 support. Here's a truncated screenshot:
# ./profile.py 10
Sampling at 49 Hertz of all threads by user + kernel stack for 10 secs.
[...]
    ffffffff81414025 copy_user_enhanced_fast_string
    ffffffff817b0774 tcp_sendmsg
    ffffffff817dd145 inet_sendmsg
    ffffffff8173ea48 sock_sendmsg
    ffffffff8173eae5 sock_write_iter
    ffffffff81232db3 __vfs_write
    ffffffff81233438 vfs_write
    ffffffff812348a5 sys_write
    ffffffff818737bb entry_SYSCALL_64_fastpath
    00007fae0a2614fd [unknown]
    0000000000020000 [unknown]
    -                iperf (21262)
        132

    ffffffff81414025 copy_user_enhanced_fast_string
    ffffffff8174e76b skb_copy_datagram_iter
    ffffffff817addb3 tcp_recvmsg
    ffffffff817dd0ae inet_recvmsg
    ffffffff8173e65d sock_recvmsg
    ffffffff8173e89a SYSC_recvfrom
    ffffffff8173fb9e sys_recvfrom
    ffffffff818737bb entry_SYSCALL_64_fastpath
    00007f9c16cf58bf recv
    -                iperf (21266)
        200
The output are stack traces, process details, and a single number: the number of times this stack trace was sampled. The entire stack trace is used as a key in an in-kernel hash, so that only the summary is emitted to user space.
You can use my profile tool to output folded format directly, for flame graph generation. Here I'm also including -d, for stack delimiters, which the flame graph software will color grey:
# ./profile.py -df 10
[...]
iperf;[unknown];[unknown];-;entry_SYSCALL_64_fastpath;sys_write;vfs_write;__vfs_write;sock_write_iter;sock_sendmsg;inet_sendmsg;tcp_sendmsg;copy_user_enhanced_fast_string 140
iperf;recv;-;entry_SYSCALL_64_fastpath;sys_recvfrom;SYSC_recvfrom;sock_recvmsg;inet_recvmsg;tcp_recvmsg;skb_copy_datagram_iter;copy_user_enhanced_fast_string 177
This can be read directly by flamegraph.pl -- it doesn't need stackcollapse-perf.pl (as pictured in the slide).
Here's the USAGE message for profile, which shows other capabilities:
# ./profile.py -h
usage: profile.py [-h] [-p PID] [-U | -K] [-F FREQUENCY] [-d] [-a] [-f]
                  [--stack-storage-size STACK_STORAGE_SIZE]
                  [duration]

Profile CPU stack traces at a timed interval

positional arguments:
  duration              duration of trace, in seconds

optional arguments:
  -h, --help            show this help message and exit
  -p PID, --pid PID     profile this PID only
  -U, --user-stacks-only
                        show stacks from user space only (no kernel space
                        stacks)
  -K, --kernel-stacks-only
                        show stacks from kernel space only (no user space
                        stacks)
  -F FREQUENCY, --frequency FREQUENCY
                        sample frequency, Hertz (default 49)
  -d, --delimited       insert delimiter between kernel/user stacks
  -a, --annotations     add _[k] annotations to kernel frames
  -f, --folded          output folded format, one line per stack (for flame
                        graphs)
  --stack-storage-size STACK_STORAGE_SIZE
                        the number of unique stack traces that can be stored
                        and displayed (default 2048)

examples:
    ./profile             # profile stack traces at 49 Hertz until Ctrl-C
    ./profile -F 99       # profile stack traces at 99 Hertz
    ./profile 5           # profile at 49 Hertz for 5 seconds only
    ./profile -f 5        # output in folded format for flame graphs
    ./profile -p 185      # only profile threads for PID 185
    ./profile -U          # only show user space stacks (no kernel)
    ./profile -K          # only show kernel space stacks (no user)
I have an older version of this tool in the bcc tools/old directory, which works on Linux 4.6 to 4.8 using an old kprobe trick, although one that had caveats.
Thanks to Alexei Starovoitov (Facebook) for getting the kernel BPF profiling support done, and Teng Qin (Facebook) for adding bcc support yesterday.
We could have developed BPF profiling sooner, but since the 2.6 style of profiling was somewhat sufficient, BPF effort has been on other higher priority areas. But now that BPF profiling has arrived, it means more than just saving CPU (and disk I/O) resources: imagine real-time flame graphs!
Click here for Disqus comments (ad supported).