Off-CPU Flame Graphs

On-CPU performance issues can solved using CPU Flame Graphs. That leaves off-CPU issues: the time spent by processes and threads when they are not running on-CPU. If this time is spent during an application request, synchronously, then it directly and proportionally affects performance.
I've previously documented the analysis of this off-CPU time as its own performance methodology: Off-CPU Analysis. On this page, I'll explore this and related types of analysis using Flame Graphs.
Figure 1 illustrates off-CPU time, showing an application thread which blocks during a system call. This system call is called during an application request (eg, for file system reads). Around 60% of the application request time is blocked off-CPU during this system call – time that won't be visible when only profiling on-CPU time.
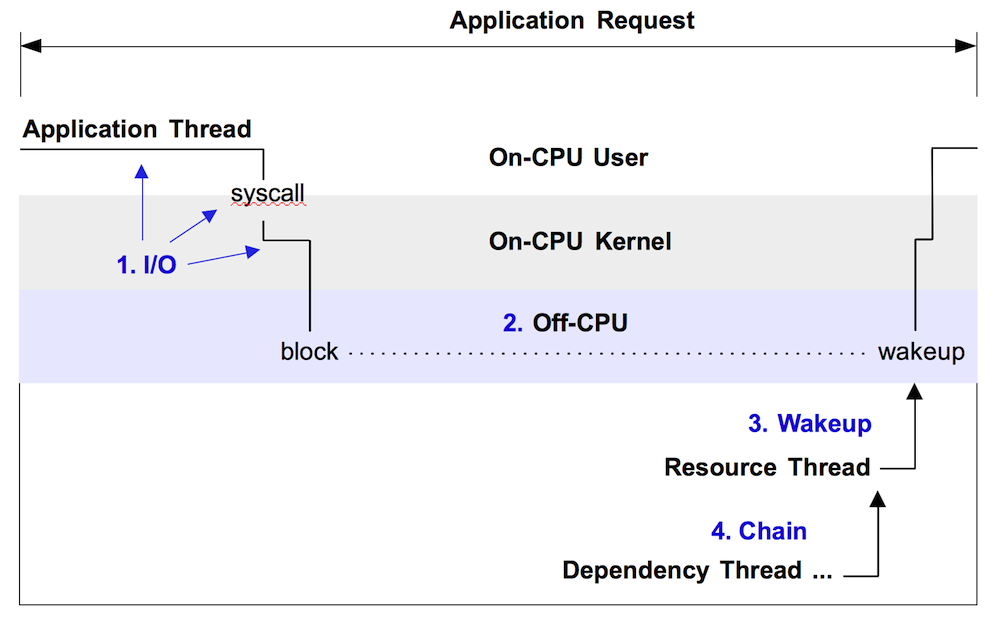
Figure 1. Example off-CPU event, with enumerated approaches for analysis.
Note that this only shows one form of off-CPU time. Applications can also spend time off-CPU due to involuntary context switching (time sharing), memory mapped disk I/O, and scheduler latency. These may not involve a system call. I first summarized off-CPU time flame graphs in the later part of my USENIX LISA 2013 plenary, and more recently in my USENIX ATC 2017 talk, starting at 50:16 (youtube, slides).
There are at least four approaches for analyzing off-CPU time with flame graphs, enumerated in figure 1 and explained in following sections. These should be read in-order, as each section provides background for the next.
Prerequisites
All of the following approaches require stack traces to be available to tracers, which you may need to fix first. Many applications are compiled with the -fomit-frame-pointer gcc option, breaking frame pointer-based stack walking. VM runtimes like Java compile methods on the fly, and tracers may not find their symbol information without additional help, causing the stack trace to be hexadecimal only. There are other gotchas as well. See my previous write ups on fixing Stack Traces and JIT Symbols for perf.
Overhead
WARNING: These tracing approaches trace I/O events or scheduler events, which can be very frequent – millions of events per second – and although tracers may only add a tiny amount of overhead to each event, due to the event rate that overhead can add up and become significant. Pay attention to overhead and the rate of the event you are tracing. I discussed this in more detail here: Off-CPU Analysis Overhead.
Linux: perf, eBPF
The following are generic approaches. I'll use Linux as the target example, then summarize other OSes.
There are many tracers available on Linux for off-CPU analysis. I'll mostly use bcc/eBPF here, and some perf, both of which are standard Linux tracers. These are part of the Linux kernel source. perf works on older Linux systems, whereas eBPF requires at least Linux 4.8 for doing stack traces. eBPF can more easily do in-kernel summaries, making it more efficient and lowering overhead, which is important here.
1. I/O
Kernels usually provide facilities for tracing I/O types, such as disk I/O or I/O related system calls. Since I/O is mostly off-CPU time, tracing I/O is a form of off-CPU analysis. Although some I/O may not leave the CPU at all, for example, file system cache hits. To generate a flame graph, the tracing facility needs to capture the I/O time and the stack trace or code-path that led to the I/O. For stack traces, we can use eBPF or perf.
Pay attention to the I/O context, whether it is synchronous to the application request or not. If it is synchronous, then I/O latency causes direct application latency, and the resulting flame graph is a direct measure of performance. An example of this is where an application performs (blocking) file system reads, which block on disk I/O. Asynchronous I/O may or may not affect the application, or may but in an indirect way. An example of this is a file system which buffers writes and flushes them to disk later. The eventual I/O and their latency may be high, but not endured directly by the application. They may be endured indirectly, as contention with later synchronous reads.
1.1. File I/O
As an example of I/O tracing, here is my fileslower tool from bcc, which traces reads and writes from the VFS interface:
# fileslower 1
Tracing sync read/writes slower than 1 ms
TIME(s)  COMM           PID    D BYTES   LAT(ms) FILENAME
0.000    bash           9647   R 128        5.83 man
0.050    man            9647   R 832       19.52 libmandb-2.6.7.1.so
0.066    man            9647   R 832       15.79 libman-2.6.7.1.so
0.123    man            9647   R 832       56.36 libpipeline.so.1.3.0
0.135    man            9647   R 832        9.79 libgdbm.so.3.0.0
0.323    man            9647   R 4096      59.52 locale.alias
0.540    man            9648   R 8192      11.11 ls.1.gz
0.558    man            9647   R 72         6.97 index.db
[...]
The argument to that tool is the duration threshold for printing events. I would expect that by setting it to 1 millisecond, it would mostly show I/O that blocked on the storage devices, since I/O that was served from cache would be CPU only and return quicker than one millisecond (usually).
For flame graphs, we need stack traces. I created a new bcc/eBPF tool to do this, fileiostacks, based on the following tracing pseudocode:
on file read/write function entry:
	start[thread_id] = timestamp

on file read/write function return:
	if !start[thread_id]
		return
	delta = timestamp - start[thread_id]
	totaltime[PID, execname, user stack] += delta
	start[thread_id] = 0

on tracer exit:
	for each key in totaltime:
		print key
		print totaltime[key]
As an implementation detail, the bcc/eBPF program currently saves user stacks as raw addresses, and does symbol translation when printing.
Here is some sample output:
# ./fileiostacks.py
Tracing VFS read/write time (us) of all threads by user stack... Hit Ctrl-C to end.
^C
[...]

    __GI___libc_pread
    Query_cache::store_query(THD*, TABLE_LIST*)
    handle_query(THD*, LEX*, Query_result*, unsigned long long, unsigned long long)
    [unknown]
    mysql_execute_command(THD*, bool)
    Prepared_statement::execute(String*, bool)
    Prepared_statement::execute_loop(String*, bool, unsigned char*, unsigned char*)
    mysqld_stmt_execute(THD*, unsigned long, unsigned long, unsigned char*, unsigned long)
    dispatch_command(THD*, COM_DATA const*, enum_server_command)
    do_command(THD*)
    handle_connection
    pfs_spawn_thread
    start_thread
    -                mysqld (1744)
        13124

    __GI___libc_pread
    [unknown]
    os_file_read_func(IORequest&, int, void*, unsigned long, unsigned long)
    fil_io(IORequest const&, bool, page_id_t const&, page_size_t const&, unsigned long, unsigned long, void*, void*)
    buf_read_page(page_id_t const&, page_size_t const&)
    buf_page_get_gen(page_id_t const&, page_size_t const&, unsigned long, buf_block_t*, unsigned long, char const*, unsigned long, mtr_t*, bool)
    btr_cur_search_to_nth_level(dict_index_t*, unsigned long, dtuple_t const*, page_cur_mode_t, unsigned long, btr_cur_t*, unsigned long, char const*, unsigned long, mtr_t*)
    [unknown]
    ha_innobase::records_in_range(unsigned int, st_key_range*, st_key_range*)
    handler::multi_range_read_info_const(unsigned int, st_range_seq_if*, void*, unsigned int, unsigned int*, unsigned int*, Cost_estimate*)
    DsMrr_impl::dsmrr_info_const(unsigned int, st_range_seq_if*, void*, unsigned int, unsigned int*, unsigned int*, Cost_estimate*)
    [unknown]
    test_quick_select(THD*, Bitmap<64u>, unsigned long long, unsigned long long, bool, st_order::enum_order, QEP_shared_owner const*, Item*, Bitmap<64u>*, QUICK_SELECT_I**)
    JOIN::estimate_rowcount()
    JOIN::make_join_plan()
    JOIN::optimize()
    st_select_lex::optimize(THD*)
    handle_query(THD*, LEX*, Query_result*, unsigned long long, unsigned long long)
    [unknown]
    mysql_execute_command(THD*, bool)
    Prepared_statement::execute(String*, bool)
    Prepared_statement::execute_loop(String*, bool, unsigned char*, unsigned char*)
    mysqld_stmt_execute(THD*, unsigned long, unsigned long, unsigned char*, unsigned long)
    dispatch_command(THD*, COM_DATA const*, enum_server_command)
    do_command(THD*)
    handle_connection
    pfs_spawn_thread
    start_thread
    -                mysqld (3652)
        27596
The output was many pages long. I've just included two sample stack traces, which show 13 and 27 milliseconds of time total in those code paths from mysqld (a MySQL database server).
fileiostacks has a -f option for emitting stack traces in "folded format": semi-colon delimited on one line, followed by the total time blocked. This is the format that my FlameGraph software takes as input.
Here are the steps for generating a file I/O time flame graph, for 30 seconds:
# ./fileiostacks.py -f 30 > out.stacks
[...copy out.stacks to your local system if desired...]
# git clone https://github.com/brendangregg/FlameGraph
# cd FlameGraph
# ./flamegraph.pl --color=io --title="File I/O Time Flame Graph" --countname=us < out.stacks > out.svg
Then open out.svg in a web browser. Here is an example (SVG, PNG):
Great. The width is proportional to the total time in the code paths, so look for the widest towers first to understand the biggest sources of latency. The left-to-right ordering has no meaning, and the y-axis is the stack depth.
I actually generated that flame graph with a filter on the do_command() MySQL function, so that it only showed latencies during an database client request. Since the folded format is single-line entries, it's easy to filter for things using grep:
# grep do_command out.stacks | ./flamegraph.pl --color=io --title="File I/O Time Flame Graph" --countname=us > out.svg
You can adjust the grep pattern to match what you are looking for.
1.2. Block Device I/O
The previous example traced reads and writes from the VFS interface, which is close to the application's request. I/O can also traced from other points in the kernel stack, such as block device I/O, storage driver I/O, different layers in the TCP/IP stack, etc. As an example here, I'll move down to block device I/O.
Since block device I/O (disk I/O) is usually relatively infrequent when compared to scheduler events, I haven't always needed eBPF's efficient in-kernel summaries for tracing it. A very simple way to analyze disk I/O with flame graphs is to use perf to simple trace their rate, then render that as a flame graph. Eg:
# perf record -e block:block_rq_insert -a -g -- sleep 30
# perf script --header > out.stacks
[...copy out.stacks to your local system if desired...]
# git clone https://github.com/brendangregg/FlameGraph
# cd FlameGraph
# ./stackcollapse-perf.html < out.stacks | ./flamegraph.pl --color=io \
    --title="Block I/O Flame Graph" --countname="I/O" > out.svg
Then open out.svg in a web browser. Here is an example (SVG, PNG):
Not bad. The widths are relative to I/O counts, not time, but it's still useful as a rough look at who is causing disk I/O. I actually filtered on the mysqld do_command function like last time, and also demangled the C++ symbols (since perf didn't automatically), so my actual command for generating this was:
# ./stackcollapse-perf.html < out.stacks | grep do_command | c++filt | \
    ./flamegraph.pl --color=io --title="Block I/O Flame Graph" --countname="I/O" > out.svg
It would be better to measure block I/O with stacks and the time of the I/O, so I created a new bcc/eBPF tool to do this, biostacks, based on the following tracing pseudocode:
on block I/O queue insertion:
	start[request_id] = timestamp
	info[request_id] = [PID, execname, user stack, kernel stack]

on block I/O completion:
	if !start[request_id] or !info[request_id]
		return
	delta = timestamp - start[request_id]
	totaltime[info[request_id]] += delta
	start[request_id] = 0
	info[request_id] = 0

on tracer exit:
	for each key in totaltime:
		print key
		print totaltime[key]
Some notes on this: process and stack context is measured at the start, when the block I/O is first created and inserted onto a queue. This is because the block I/O completion is asynchronous, and measuring the context on completion would not identify who caused the I/O. Another detail is that the information is keyed in a request_id, rather than a thread_id.
Here are the steps for generating a block I/O time flame graph, for 30 seconds:
# ./biostacks.py -f 30 > out.stacks
[...copy out.stacks to your local system if desired...]
# git clone https://github.com/brendangregg/FlameGraph
# cd FlameGraph
# ./flamegraph.pl --color=io --title="Block I/O Time Flame Graph" --countname=us < out.stacks > out.svg
Here is an example (SVG, PNG):
Great. This is now showing MySQL code paths causing storage device (disk) I/O, and the total durtion of that disk I/O. Most of the I/O is from JOIN::optimize(), shown as the tower in the middle.
I actually filtered the flame graph to only show paths in do_command(), like so:
# grep do_command out.stacks | ./flamegraph.pl --color=io --title="File I/O Time Flame Graph" --countname=us > out.svg
An unfiltered flame graph is here.
These block I/O time flame graphs show who is causing the I/O and their duration, but not necessarily their effect on application latency. If the I/O was synchronous, it will have also caused latency in mysqld, but that may not be the case – it may be asynchronous I/O that didn't block mysqld. To focus on blocking events, we can make an off-CPU flame graph instead.
2. Off-CPU
This is a generic approach for analyzing all off-CPU events, including I/O. I've documented it separately as a methodology: Off-CPU Analysis. It is also the counterpart to on-CPU analysis, as can be performed by using CPU Flame Graphs. Off-CPU time flame graphs show the time threads spend off-CPU, with their stack traces. Yichun Zhang (agentzh) first created these using SystemTap, and gave a great presentation (PDF) about them with examples of their use on Nginx. I've also previously posted how to create these using perf, Linux perf off-CPU flame graph, but that was a higher-overhead workaround until eBPF was available to do this.
I've written about eBPF off-CPU flame graphs before, however at that time eBPF didn't support stack traces, so I had to hack in my own BPF stack walker. Since 4.8, eBPF has stack trace support, now used by my eBPF tool offcputime for measuring measure off-CPU duration with stack traces, for use with flame graphs.
Here is the tracing pseudocode for tracing off-CPU stacks with times:
on context switch finish:
	sleeptime[prev_thread_id] = timestamp
	if !sleeptime[thread_id]
		return
	delta = timestamp - sleeptime[thread_id]
	totaltime[pid, execname, user stack, kernel stack] += delta
	sleeptime[thread_id] = 0

on tracer exit:
	for each key in totaltime:
		print key
		print totaltime[key]
Some notes on this: all measurements happen from one instrumentation point, the end of the context switch routine, which is in the context of the next thread (eg, the Linux finish_task_switch() function). That way, we can calculate the off-CPU duration at the same time as retrieving the context for that duration by simply fetching the current context (pid, execname, user stack, kernel stack), which tracers make easy. If this were to instrument the beginning of the context switch, in the context of the thread that's beginning to go to sleep, then this would become more complex and require saving and retrieving that context. Also note that we can fetch the stack traces at the end of the off-CPU duration and they'll be the same as at the start: the thread hasn't been running, so the stack hasn't changed.
For example output of offcputime, see Off-CPU Analysis. WARNING: offcputime traces scheduler events, which may be frequent, and so the overhead can add up to become noticable. See my discussion in Off-CPU Analysis Overhead.
Here are the steps for creating an off-CPU time flame graph with offcputime, tracing 30 seconds for the PID of a MySQL server:
# /usr/share/bcc/tools/offcputime -df -p `pgrep -nx mysqld` 30 > out.stacks
[...copy out.stacks to your local system if desired...]
# git clone https://github.com/brendangregg/FlameGraph
# cd FlameGraph
# ./flamegraph.pl --color=io --title="Off-CPU Time Flame Graph" --countname=us < out.stacks > out.svg
Then open out.svg in a web browser. It looks like this (SVG, PNG):
The blocking file I/O is shown as the taller towers on the right, now showing what truly blocked mysqld. This time there also are delimiter frames "-" between the kernel and user stacks, which were inserted by offcputime's -d option.
Now a problem with this type of analysis is evident: this flame graph shows considerable off-CPU time other than the disk I/O, but that time is largely for threads that are sleeping waiting for work. This is fascinating for a number of reasons:
- This has revealed various code-paths that MySQL uses for housekeeping or waiting for work. There are a number of columns that represent a single thread, and if you mouse-over the 4th row from the bottom, the function name describes the thread's task. Eg, io_handler_thread, lock_wait_timeout_thread, pfs_spawn_thread, srv_error_monitor_thread, etc. This reveals details about mysqld's higher level architecture.
- Some of these columns are between 25 and 30 seconds wide. These are likely to represent single threads. One shows 30 seconds, some 29 seconds, and one is 25 seconds. I would guess that these are for threads which wake up every 1 or 5, with the final wakeup either caught or not by the 30 second tracing window.
- Some columns are more than 30 seconds wide, such as io_handler_thread and pfs_spawn_thread. These are likely to represent a pool of threads that are executing the same code, and their total wait time sums to be higher than the elapsed tracing time.
There are a few challenges with this type of analysis. Having multiple threads on one flame graph can be more confusing than it was for CPU flame graphs, since off-CPU time usually overlaps, and a pool of idle threads can dominate – as we saw here. We can either zoom to the more interesting towers, or use some command line filtering to automate that (grep do_command ...).
Another challenge is that off-CPU stacks may be caused by involuntary context switching, as I described in Off-CPU Analysis Caveats. A solution on Linux is to filter the thread state to those of interest, for example, to only include the TASK_UNINTERRUPTIBLE state (2):
# /usr/share/bcc/tools/offcputime -df -p `pgrep -nx mysqld` --state=2 30 > out.stacks
But a more difficult challenge is that the off-CPU stack traces often don't explain what the performance problem is. In user-level, the stack may show that the application is blocked on file descriptor I/O, or waiting on a lock, but not why this took so much time. Kernel-level stacks can shed some more light, but these still can hit the same problem. The problem is that off-CPU stacks can be waiting on some other thread or resource to wake them up, and we'd like to know what that other thread or resources is, and why it took time.
3. Wakeup
When a thread is off-CPU sleeping, it is eventually woken up. This is performed by another thread, the waker thread, and its stack trace can be interesting to examine and render as a flame graph. It often shows what took so long – what the sleeping thread was waiting on. This lets us solve more problems than off-CPU tracing alone, as the wakeup information can explain the real reason for blocking. This is especially helpful for lock contention, where the off-CPU path shows that we're blocking on a lock but not why: who is holding the lock. The wakeup path can reveal who held and finally released the lock, causing the wakeup. As with tracing off-CPU events you need to be careful with the overheads, which can start to add up depending on the rate of events and tracer you use.
I wrote a tool to do this, wakeuptime in bcc/eBPF, which works like the following tracing pseudocode:
on context switch start:
	sleeptime[thread_id] = timestamp

on wakeup:
	if !sleeptime[target_thread_id]
		return
	delta = timestamp - sleeptime[target_thread_id]
	totaltime[pid, execname, user stack, kernel stack, target_pid, target_execname] += delta
Here is sample output from wakeuptime:
# ./wakeuptime.py
Tracing blocked time (us) by kernel stack... Hit Ctrl-C to end.
^C
[...]

    target:          mysqld
    ffffffff810013aa xen_hypercall_sched_op
    ffffffff818ca709 xen_do_hypervisor_callback
    ffffffff81522167 xen_evtchn_do_upcall
    ffffffff815200dc __xen_evtchn_do_upcall
    ffffffff81522a93 evtchn_2l_handle_events
    ffffffff810d9a61 generic_handle_irq
    ffffffff810decbd handle_percpu_irq
    ffffffff810da880 handle_irq_event_percpu
    ffffffff810da73b __handle_irq_event_percpu
    ffffffff8101a8eb xen_timer_interrupt
    ffffffff810f55f2 hrtimer_interrupt
    ffffffff810f4efc __hrtimer_run_queues
    ffffffff810f4c1e hrtimer_wakeup
    waker:           swapper/5
        3500523

    target:          mysqld
    ffffffff818c973b entry_SYSCALL_64_fastpath
    ffffffff81776333 SYSC_sendto
    ffffffff81775dd0 sock_sendmsg
    ffffffff8184712e unix_stream_sendmsg
    ffffffff8177978c sock_def_readable
    ffffffff810bf80c __wake_up_common_lock
    ffffffff810bf6f7 __wake_up_common
    ffffffff81259805 pollwake
    waker:           sysbench
        35985186

[...]
Each output stack is intended to be read bottom-up. The first line shows the total time in microseconds spent in this wakeup path. The next, "waker:", identifies the process name that did the wakeup, and is followed by the waker stack. Finally, on the top, "target:" identifies the process name of the thread that was woken up.
The bottom stack shows sysbench waking up mysqld via a socket sendmsg(). sysbench is a microbenchmark tool that is sending mysqld load. The top stack is harder to understand: it shows "swapper/5" (a kernel thread) waking up mysqld because of a timer interrupt (this is a cloud system under the Xen hypervisor). In reality, it could be a timer interrupt that has triggered processing of other pending interrupts, such as network I/O.
Here are the steps for creating a wakeup time flame graph with wakeuptime, tracing 30 seconds for the entire system:
# /usr/share/bcc/tools/wakeuptime -f 30 > out.stacks
[...copy out.stacks to your local system if desired...]
# git clone https://github.com/brendangregg/FlameGraph
# cd FlameGraph
# ./flamegraph.pl --color=wakeup --title="Wakeup Time Flame Graph" --countname=us < out.stacks > out.svg
I've used a different color palette to differentiate that this showing wakeup time, rather than off-CPU time. It looks like this (SVG, PNG):
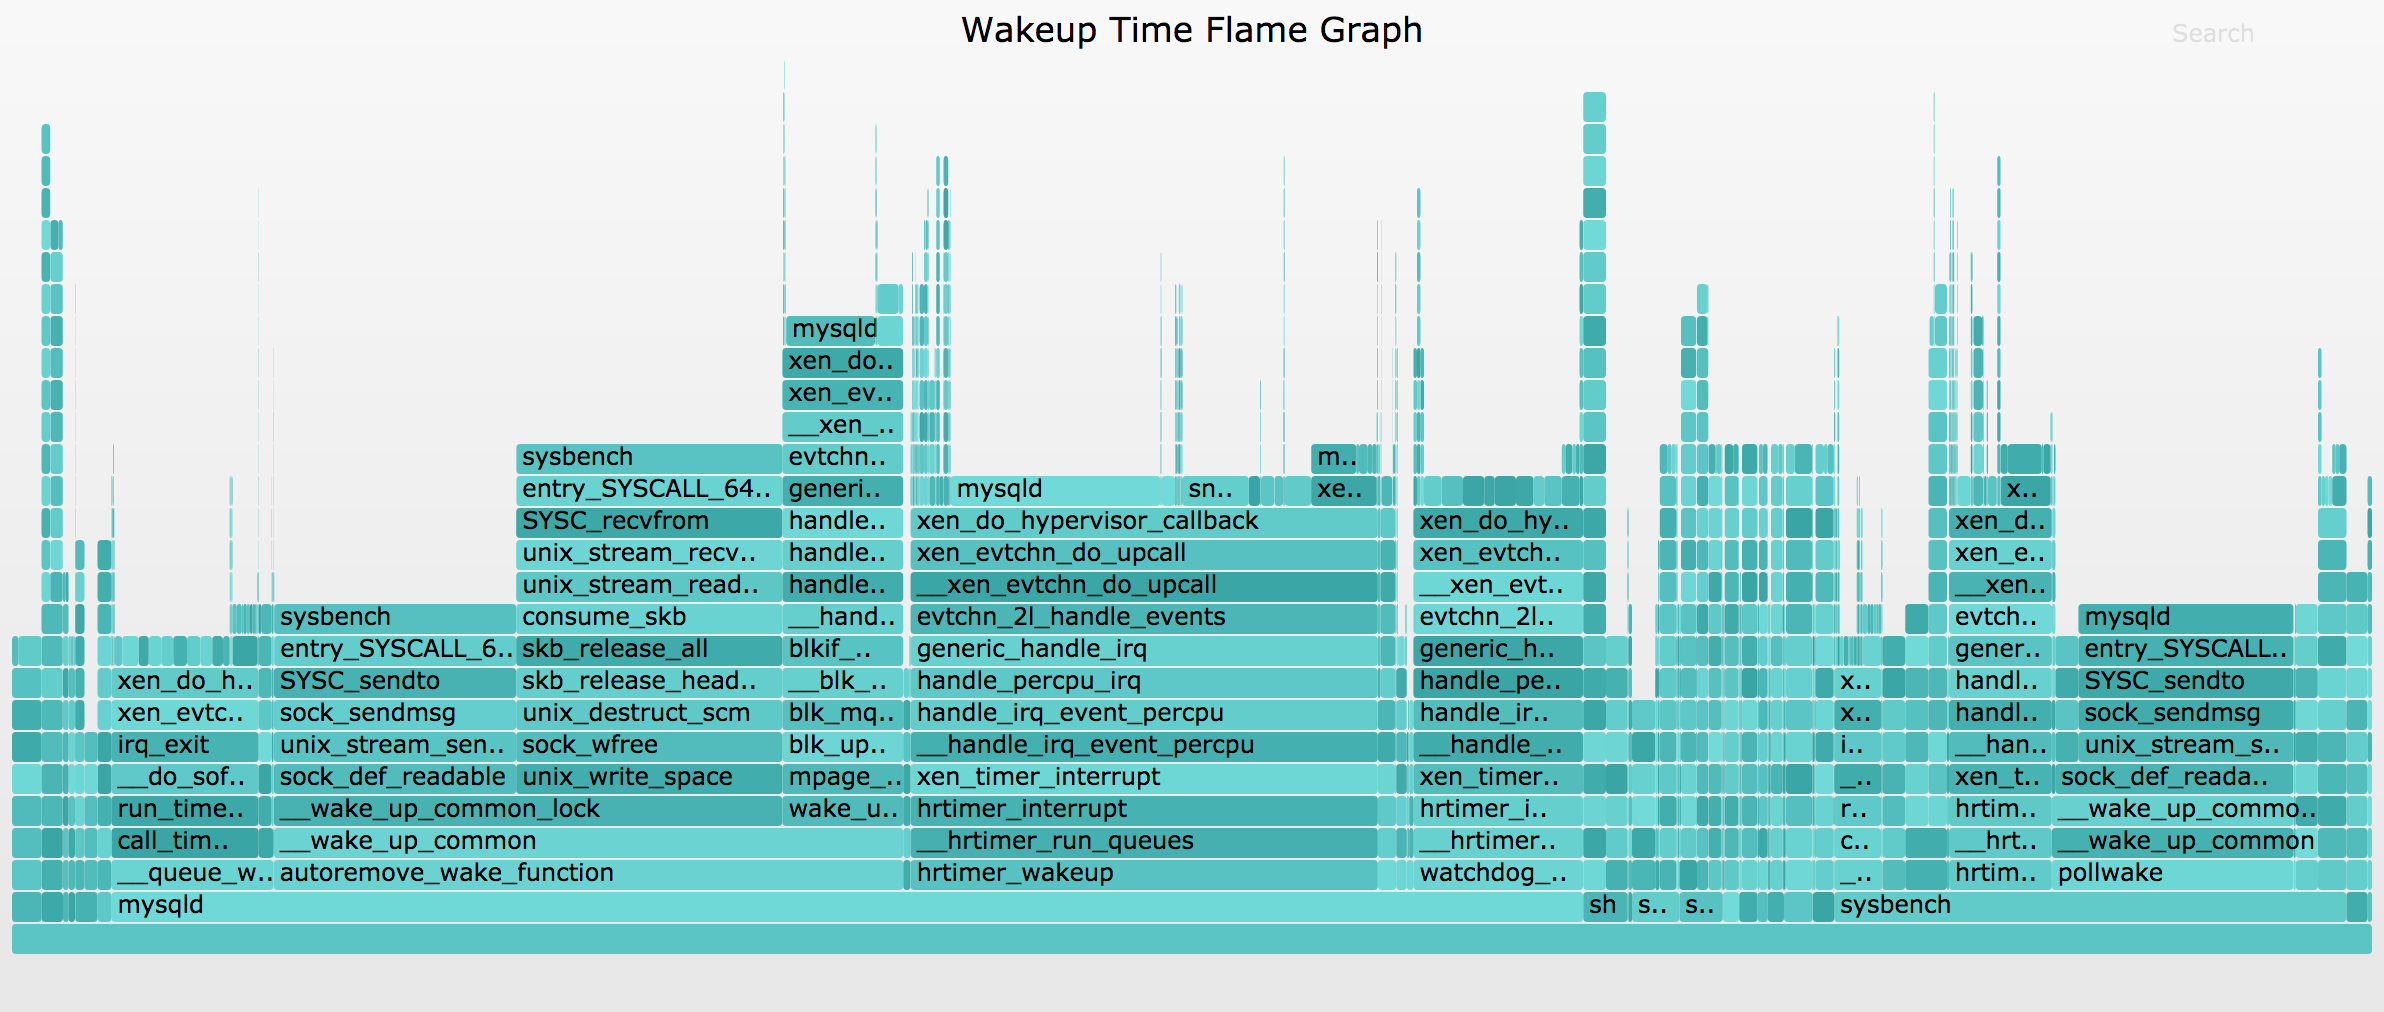
This version of wakeuptime is showing kernel stacks only (a future version will show both kernel and user). This flame graph shows that mysqld was often wakeup up sysbench, and vice versa.
So with both off-CPU and wakeup stack information, and some human navigation and cross-referencing, we can follow latency from the application down to metal. Would it be possible to programatically follow wakeups and objects, to build a chain of stacks from application latency to metal? And how could this be visualized?
4. Chain Graphs
Chain graphs are an experimental visualization that associates off-CPU stacks with their wakeup stacks, and those wakeup stacks with their wakeup stacks, and so on, following the full chain of wakeups. This is ambitious and may incur high overhead, but the payoff is a powerful tool for understanding all off-CPU events, regardless of wakeup chain complexity.
4.1. Off-Wake Flame Graphs
As an intermediate and more practical step, I began by associating off-CPU stacks with a single wakeup stack. This is my offwaketime bcc/eBPF tool. Alexei Starovoitov, eBPF creator, rewrote it in raw eBPF and added to the Linux kernel: offwaketime_kern.c and offwaketime_user.c. I first wrote about this tool in Linux Wakeup and Off-Wake Profiling, but that was before eBPF had stack trace support.
Some output of offwaketime, tracing the entire system:
# ./offwaketime.py
Tracing blocked time (us) by user + kernel off-CPU and waker stack... Hit Ctrl-C to end.
[...]

    waker:           swapper/1 0
    xen_hypercall_sched_op
    xen_do_hypervisor_callback
    xen_evtchn_do_upcall
    __xen_evtchn_do_upcall
    evtchn_2l_handle_events
    generic_handle_irq
    handle_edge_irq
    handle_irq_event
    handle_irq_event_percpu
    __handle_irq_event_percpu
    blkif_interrupt
    __blk_mq_complete_request
    blk_mq_end_request
    blk_update_request
    mpage_end_io
    wake_up_page_bit
    __wake_up_common
    autoremove_wake_function
    --               --
    finish_task_switch
    __schedule
    schedule
    io_schedule
    generic_file_read_iter
    __vfs_read
    vfs_read
    SyS_pread64
    entry_SYSCALL_64_fastpath
    __GI___libc_pread
    target:          mysqld 18067
        1324845

    waker:           mysqld 0
    entry_SYSCALL_64_fastpath
    SYSC_sendto
    sock_sendmsg
    unix_stream_sendmsg
    sock_def_readable
    __wake_up_common_lock
    __wake_up_common
    autoremove_wake_function
    --               --
    finish_task_switch
    __schedule
    schedule
    schedule_timeout
    unix_stream_read_generic
    unix_stream_recvmsg
    SYSC_recvfrom
    entry_SYSCALL_64_fastpath
    [unknown]
    target:          sysbench 18106
        1421478

[...]
I've tried a number of arrangements and found this to work best: you begin in the middle ("--") and read down for the off-CPU stack, and up for the waker stack which is in reverse order. I found this aids interpretation, as the stacks meet in the middle ("--") and you have the waker function adjacent to the sleeping function that it is waking up. And for both functions, you can read away from the middle to understand ancestry. Putting both stacks in the same order meant frequently visually hopping from the top of one stack to the top of another stack some distance away, which was harder to read.
Here are the steps for creating a wakeup time flame graph with wakeuptime, tracing 30 seconds for the entire system:
# /usr/share/bcc/tools/offwaketime -f 30 > out.stacks
[...copy out.stacks to your local system if desired...]
# git clone https://github.com/brendangregg/FlameGraph
# cd FlameGraph
# ./flamegraph.pl --color=chain --title="Off-Wake Time Flame Graph" --countname=us < out.stacks > out.svg
The off-wake palette switches from off-CPU colors to wakeup colors after the delimiter. The result looks like this (SVG, PNG):
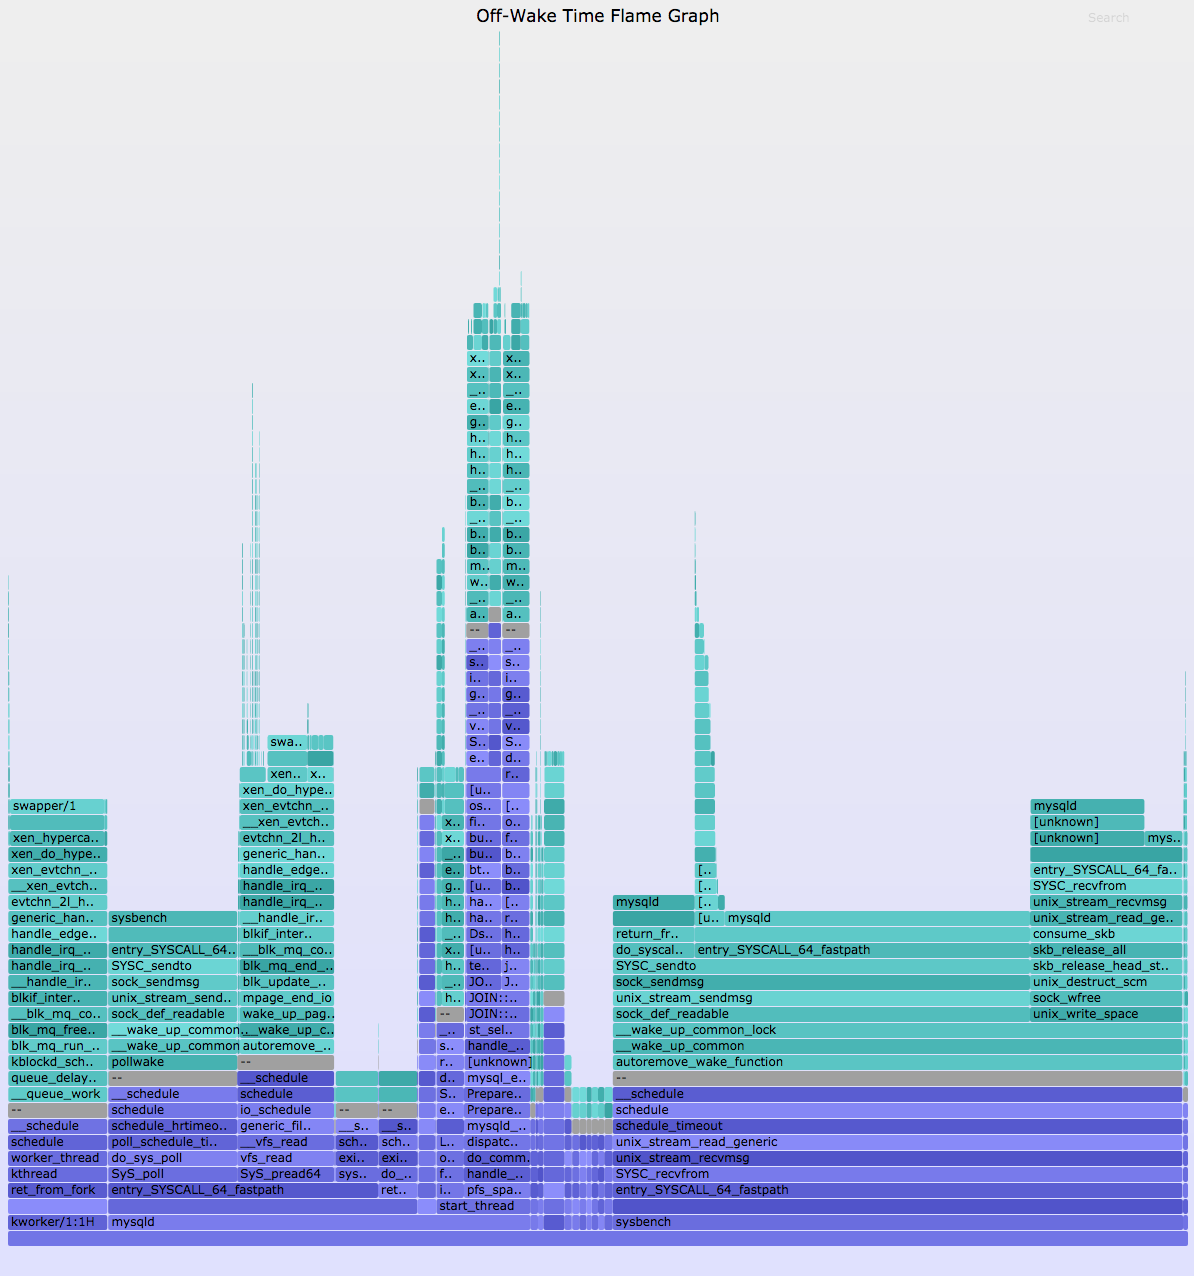
You can browse this and more about the off-CPU stacks that we had been studying earlier. Zoom into the do_command() function (use Search on the top right, if you can't find it) and you can see the block I/O completion interrupts waking up our vfs_read() stacks. This is really great.
4.2. Chain Graphs
In practice, I've found that off-CPU flame graphs only solve about 40% of issues: applications frequently block on locks or select/poll, and you need to know the waker to solve the issue. Off-wake flame graphs help, but I've found they only increase the successful win rate to about 70% of issues: sometimes one waker is not enough, and you need to know who it was woken up on. This is the role of chain graphs: to show the full wakeup chain.
I first introduced chain graphs in my 2013 USENIX LISA plenary. Chain graphs are like off-wake flame graphs, but continue to add waker stacks on top of waker stacks. I more recently wrote about them in Linux chain graph prototype, where I implemented a prototype chain graph in eBPF and included the following legend to explain the ordering:
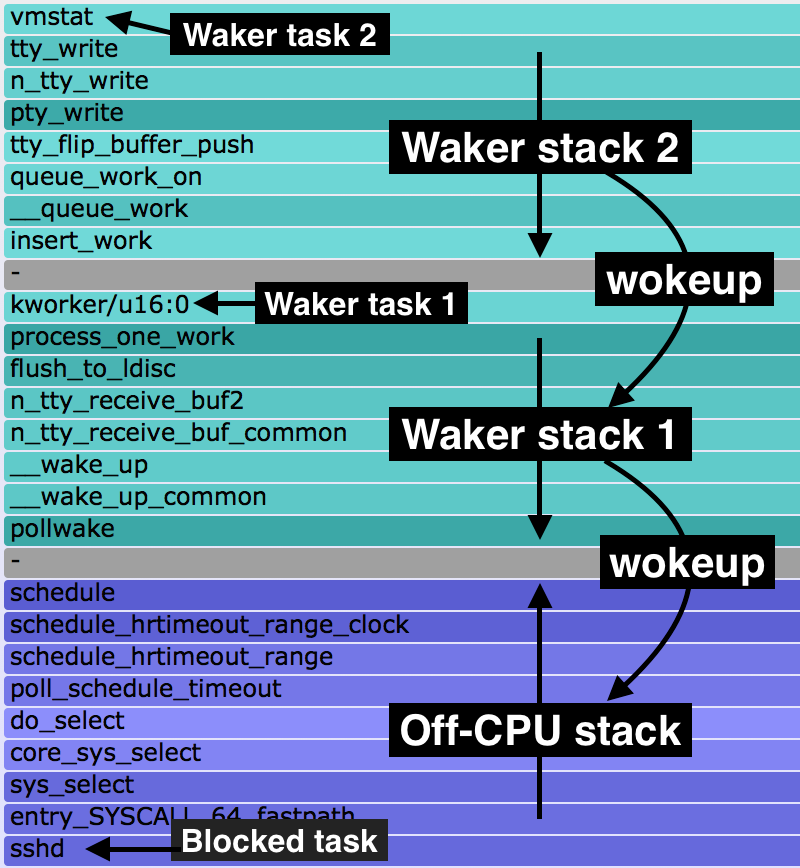
At the bottom is the off-CPU stack, with a gray frame on top. Above that are wakeup stacks in reverse order, as with off-wake flame graphs. Multiple wakeup stacks are separated by an additional gray frame.
This is how you read this:
- bottom-up: up to the first gray frame shows the code-path that led to a blocking and off-CPU event.
- top-down: down to the bottom gray frame shows the chain of code-paths that led to wakeup up an off-CPU event.
I have a newer eBPF implementation of chain graphs that uses the 4.8 BPF stack support, which can walk more and deeper waker stacks. Eg, here's a 6-level chain graph. I'm still working on challenges, though, such as wakeup loops on local systems, and overheads. Practically, off-wake time flame graphs may be as far as we usually take this. They are already provided by my offwaketime tool in bcc.
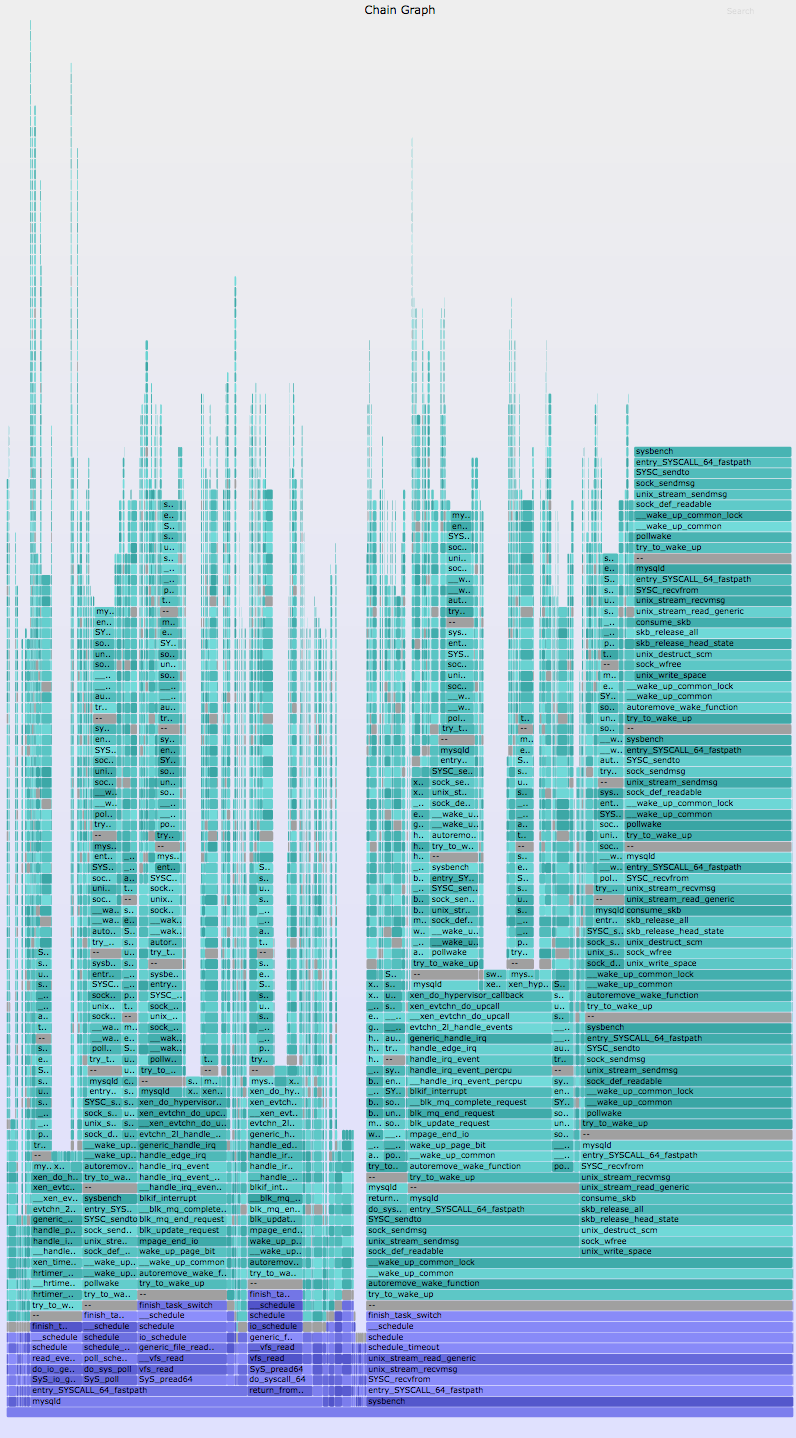
See the main Flame Graphs page for other types of flame graphs and links. There is also an older Solaris Off-CPU flame graphs page, which provides more examples (although a different OS). Also see my Off-CPU Analysis page for more discussion on off-CPU analysis as a methodology.