FreeBSD Off-CPU Analysis
Off-CPU analysis is a performance methodology where high resolution off-CPU time is measured and studied. This reveals which code-paths led to time spent waiting (blocked), and can be a quick and generic way to root-cause a wide range of performance issues.
See the main Off-CPU Analysis page for the introduction and explanation of this methodology. That page uses Linux as an example implementation of off-CPU analysis. On this page I'll show you how to apply it on FreeBSD. It's assumed that you've read the main page, so many important topics won't be duplicated here, including Introduction, Prerequisites, Overhead, and Caveats.
I originally wrote much of the material below for DTrace on Solaris, and have since been updating it for FreeBSD.
Introduction
I explained off-CPU analysis using flame graphs in my EuroBSD keynote: System Performance Analysis Methodologies. This can serve as a quick introduction to the topic, and starts at 36:41:
I also covered off-CPU and CPU flame graphs in my 2014 talk: FreeBSD Flame Graphs at the FreeBSD dev and vendor summit.
For comparison with off-CPU analysis, timed CPU sampling can be performed with pmcstat and DTrace. For example:
# dtrace -n 'profile-99 /execname == "mysqld"/ { @[ustack()] = count(); }'.
Off-CPU Time
DTrace can instrument scheduler events using dynamic tracing of kernel scheduler functions, or the stable kernel provider ("sched"):
# dtrace -ln 'sched:::*cpu'
   ID   PROVIDER            MODULE                          FUNCTION NAME
18268      sched              unix                             swtch remain-cpu
18289      sched              unix                  resume_from_intr on-cpu
18290      sched              unix                resume_from_zombie on-cpu
18291      sched              unix                            resume on-cpu
18323      sched              unix                  resume_from_intr off-cpu
18324      sched              unix                resume_from_zombie off-cpu
18325      sched              unix                            resume off-cpu
Off-CPU time can be calculated as the timestamp delta between the sched:::off-cpu probe and the sched:::on-cpu probe, for the same thread:
# dtrace -n 'sched:::off-cpu { self->ts = timestamp; }
    sched:::on-cpu /self->ts/ { @["ns"] = quantize(timestamp - self->ts);
    self->ts = 0; }'
dtrace: description 'sched:::off-cpu ' matched 6 probes
^C

  ns
           value  ------------- Distribution ------------- count
            4096 |                                         0
            8192 |@@@                                      55
           16384 |@@@@@@@@@@@@@                            243
           32768 |@@@@                                     75
           65536 |                                         8
          131072 |@                                        24
          262144 |                                         3
          524288 |                                         0
         1048576 |                                         0
         2097152 |                                         1
         4194304 |                                         0
         8388608 |                                         2
        16777216 |@@@@@@                                   105
        33554432 |@@@                                      66
        67108864 |@@@                                      55
       134217728 |@@@                                      61
       268435456 |@                                        28
       536870912 |@@                                       32
      1073741824 |                                         0
That shows two groupings, the first showing threads leaving CPU between 8 and 65 us, and the second showing between 16 ms and 1 second.
Off-CPU Analysis
An off-CPU sampler can be hacked together using procstat -ka, which lists kernel stacks for all threads on the system. Eg:
# procstat -ka
  PID    TID COMM             TDNAME           KSTACK
    0 100000 kernel           swapper          mi_switch sleepq_timedwait _sleep swapper btext
    0 100023 kernel           firmware taskq   mi_switch sleepq_wait _sleep taskqueue_thread_loop fork_exit fork_trampoline
    0 100025 kernel           kqueue taskq     mi_switch sleepq_wait _sleep taskqueue_thread_loop fork_exit fork_trampoline
    0 100026 kernel           ffs_trim taskq   mi_switch sleepq_wait _sleep taskqueue_thread_loop fork_exit fork_trampoline
    0 100027 kernel           acpi_task_0      mi_switch sleepq_wait msleep_spin_sbt taskqueue_thread_loop fork_exit fork_trampoline
    0 100028 kernel           acpi_task_1      mi_switch sleepq_wait msleep_spin_sbt taskqueue_thread_loop fork_exit fork_trampoline
    0 100029 kernel           acpi_task_2      mi_switch sleepq_wait msleep_spin_sbt taskqueue_thread_loop fork_exit fork_trampoline
    0 100033 kernel           aiod_bio taskq   mi_switch sleepq_wait _sleep taskqueue_thread_loop fork_exit fork_trampoline
    0 100035 kernel           thread taskq     mi_switch sleepq_wait _sleep taskqueue_thread_loop fork_exit fork_trampoline
    0 100037 kernel           mps0 taskq       mi_switch sleepq_wait _sleep taskqueue_thread_loop fork_exit fork_trampoline
    0 100049 kernel           mps1 taskq       mi_switch sleepq_wait _sleep taskqueue_thread_loop fork_exit fork_trampoline
[...]
I learned about this command while giving a talk, and so I built a flame graph from the output live, and I've since written a post about it: FreeBSD Off-CPU Flame Graphs. It's a coarse approach that may only be able to sample all threads at 1 Hertz, and kernel stacks only.
DTrace can be used for off-CPU tracing with much higher resolution, and show both kernel and user stack traces using its stack() and ustack() functions. Adding these to the previous one-liner, and also filtering to only match our target application, "mysqld":
# dtrace -x ustackframes=100 -n 'sched:::off-cpu /execname == "mysqld"/ {
    self->ts = timestamp; } sched:::on-cpu /self->ts/ { @[stack(), ustack(), "ns"] =
    quantize(timestamp - self->ts); self->ts = 0; }'
dtrace: description 'sched:::off-cpu ' matched 6 probes
^C
[...]

              genunix`cv_wait+0x61		<- kernel-level stack trace
              zfs`zio_wait+0x5d
              zfs`dmu_buf_hold_array_by_dnode+0x21e
              zfs`dmu_buf_hold_array+0x71
              zfs`dmu_read_uio+0x4d
              zfs`zfs_read+0x19a
              genunix`fop_read+0x6b
              genunix`pread+0x22c
              unix`sys_syscall+0x17a

              libc.so.1`__pread+0xa		<- user-level stack trace
              mysqld`os_file_pread+0x8e
              mysqld`os_file_read+0x3b			<- filesystem I/O
              mysqld`fil_io+0x2b0
              mysqld`buf_read_page_low+0x14e
              mysqld`buf_read_page+0x81
              mysqld`buf_page_get_gen+0x143
              mysqld`btr_cur_search_to_nth_level+0x4dd
              mysqld`row_sel_get_clust_rec_for_mysql+0x9a
              mysqld`row_search_for_mysql+0xdf5
              mysqld`_ZN11ha_innobase13general_fetchEPcjj+0x5b
              mysqld`_Z19join_read_next_sameP14st_read_record+0x32
              mysqld`_Z10sub_selectP4JOINP13st_join_tableb+0x68
              mysqld`_Z9do_selectP4JOINP4ListI4ItemEP8st_tableP9Procedure+0x1fd
              mysqld`_ZN4JOIN4execEv+0x12a9
              mysqld`_Z12mysql_selectP3THDPPP4ItemP10TABLE_LISTjR4ListIS1_ES2_jP8...
              mysqld`_Z13handle_selectP3THDP6st_lexP13select_resultm+0x145
              mysqld`_Z21mysql_execute_commandP3THD+0xe6e
              mysqld`_Z11mysql_parseP3THDPKcjPS2_+0x116
              mysqld`_Z16dispatch_command19enum_server_commandP3THDPcj+0xfc1
              mysqld`_Z10do_commandP3THD+0xb8
              mysqld`handle_one_connection+0x7f7
              libc.so.1`_thrp_setup+0x8d
              libc.so.1`_lwp_start
  ns
           value  ------------- Distribution ------------- count
          262144 |                                         0
          524288 |                                         1
         1048576 |@                                        2
         2097152 |@@@@@                                    10
         4194304 |@@@@@@@@@@@@@@@@@@@@@@@@@@               53
         8388608 |@@@@@@@@                                 16
        16777216 |                                         1
        33554432 |                                         0
The output is many pages long, consisting of hundreds of kernel + user stack traces, plus their time spent waiting off-CPU as distribution plots ("value" == nanoseconds, "count" == number of occurrences in that range). I've truncated the output to one off-CPU event only: file system I/O.
This DTrace one-liner is only measuring the stack traces on the sched:::on-cpu event; it doesn't need to gather and save them on the sched:::off-cpu event, or during the time spent off-CPU, since the application stack doesn't change (and the kernel stack may not change much either). It's the application (user-level) stack that usually provides the most helpful context.
The file system I/O latency shown in the distribution, from 1 to 16 ms, matches expectation for random disk I/O latency. It also shows that the file system (while I was tracing) was running at a 0% cache hit rate for this code-path; all I/O were at disk speeds. (This is probably due to this MySQL using application-level caches to cache the frequent requests, leaving a trickle of un-cached and infrequent requests for the file system.)
That example stack trace was interesting; Here's an example of one that is much less interesting:
[...]
              genunix`cv_wait_sig_swap_core+0x170
              genunix`cv_wait_sig_swap+0x18
              genunix`cv_waituntil_sig+0x13c
              genunix`lwp_park+0x157
              genunix`syslwp_park+0x31
              unix`sys_syscall+0x17a

              libc.so.1`__lwp_park+0x17
              libc.so.1`cond_wait_queue+0x68
              libc.so.1`__cond_wait+0x7b
              libc.so.1`cond_wait+0x23
              libc.so.1`pthread_cond_wait+0x9		<- event waiting
              mysqld`_Z10end_threadP3THDb+0xba
              mysqld`handle_one_connection+0x3e8
              libc.so.1`_thrp_setup+0x8d
              libc.so.1`_lwp_start
  ns
           value  ------------- Distribution ------------- count
            2048 |                                         0
            4096 |                                         1
            8192 |                                         0
           16384 |                                         0
           32768 |                                         0
           65536 |                                         1
          131072 |                                         3
          262144 |                                         1
          524288 |@                                        9
         1048576 |@@                                       17
         2097152 |@@@@                                     34
         4194304 |@@@@@                                    43
         8388608 |@@@@@@@                                  68
        16777216 |@@@@@@                                   58
        33554432 |@@@@@@                                   58
        67108864 |@@@@                                     41
       134217728 |@@                                       21
       268435456 |@                                        12
       536870912 |@                                        9
      1073741824 |                                         0
I believe this stack trace is from a thread ending and waiting in the MySQL thread cache for more work.
Request-Synchronous Context
The output of the previous one-liners can be manually filtered, as described earlier, looking for blocking code paths that are called from the request. The DTrace pid provider allows a more advanced approach, by tracing the application request functions and so that non-request stacks can be filtered in kernel context, at the time of collection, improving efficiency. Using the pid provider on MySQL, we can identify if a thread is processing a query, such as by checking that the thread is executing a dispatch_command() function. The following script does this, and includes some usability features to produce rolling status of gathered latency until Ctrl-C is hit; it also includes a minimum latency threshold, set to 10 ms, to only include off-CPU wait events that are longer than this time:
$ cat -n mysqld_pid_offcpu.d
     1	#!/usr/sbin/dtrace -s
     2	/*
     3	 * mysqld_pid_offcpu.d	Trace off-CPU time during queries, showing stacks.
     4	 *
     5	 * USAGE: ./mysqld_pid_offcpu.d -p mysqld_PID
     6	 *
     7	 * TESTED: these pid-provider probes may only work on some mysqld versions.
     8	 *	5.0.51a: ok
     9	 *	5.1.13: ok
    10	 *
    11	 * 27-Feb-2011	Brendan Gregg	Created This.
    12	 */
    13
    14	#pragma D option quiet
    15
    16	dtrace:::BEGIN
    17	{
    18		min_ns = 10000000;
    19		printf("Tracing PID %d for queries longer than %d ms\n",
    20		    $target, min_ns / 1000000);
    21		printf("Hit Ctrl-C when ready for off-CPU report.\n\n");
    22	}
    23
    24	pid$target::*dispatch_command*:entry
    25	{
    26		self->start = timestamp;
    27	}
    28
    29	sched:::off-cpu
    30	/self->start/
    31	{
    32		self->off = timestamp;
    33	}
    34
    35	sched:::on-cpu
    36	/self->off && (timestamp - self->off) > min_ns/
    37	{
    38		@offcpu[stack(), ustack()] = quantize(timestamp - self->off);
    39		self->off = 0;
    40	}
    41
    42	pid$target::*dispatch_command*:return
    43	/self->start && (timestamp - self->start) > min_ns/
    44	{
    45		@time = quantize(timestamp - self->start);
    46	}
    47
    48	pid$target::*dispatch_command*:return
    49	{
    50		self->start = 0;
    51		self->off = 0;
    52	}
    53
    54	profile:::tick-1s,
    55	dtrace:::END
    56	{
    57		printf("MySQL query latency (ns):");
    58		printa(@time);
    59		clear(@time);
    60	}
    61
    62	dtrace:::END
    63	{
    64		printf("Top 10 off-CPU user & kernel stacks, by wait latency (ns):");
    65		trunc(@offcpu, 10);
    66	}
The tick-1s probe prints status every second showing the distribution of query latency beyond 10 ms. The intent is that you watch this rolling status until you catch the latency you are looking for (outliers), and then hit Ctrl-C. The real output is in the @offcpu aggregation, which includes the stack traces and latency distribution (beyond 10 ms) for events during queries.
Here's an example (MySQL 5.0.51a):
# ./mysqld_pid_offcpu.d -p 3475
Tracing PID 3475 for queries longer than 10 ms
Hit Ctrl-C when ready for off-CPU report.

MySQL query latency (ns):

           value  ------------- Distribution ------------- count
         4194304 |                                         0
         8388608 |@@@@@@@@@@@@@@@@@@@@@@@@@@@@@@@@@        257
        16777216 |@@@@@                                    35
        33554432 |@                                        10
        67108864 |@                                        5
       134217728 |                                         0
       268435456 |                                         1
       536870912 |                                         0

[...waiting to see latency of interest: beyond 1s...]

MySQL query latency (ns):

           value  ------------- Distribution ------------- count
         4194304 |                                         0
         8388608 |@@@@@@@@@@@@@@@@@@@@@@@@@@@@@@@@@@@@@@@@ 2
        16777216 |                                         0

MySQL query latency (ns):

           value  ------------- Distribution ------------- count
         4194304 |                                         0
         8388608 |@@@@@@@@@@@@@                            1
        16777216 |@@@@@@@@@@@@@                            1
        33554432 |                                         0
        67108864 |                                         0
       134217728 |                                         0
       268435456 |                                         0
       536870912 |                                         0
      1073741824 |@@@@@@@@@@@@@                            1     <- over 1 second
      2147483648 |                                         0

[got it! Ctrl-C now]
^C
[...]

              genunix`cv_timedwait_sig_hires+0x1db
              genunix`cv_waituntil_sig+0xba
              genunix`poll_common+0x56d
              genunix`pollsys+0xe4
              unix`sys_syscall+0x17a

              libc.so.1`__pollsys+0xa
              libc.so.1`pselect+0x18c
              libc.so.1`select+0x70
              mysqld`os_thread_sleep+0x3f	<- innodb thread concurrency
              mysqld`srv_conc_enter_innodb+0xc4
              mysqld`_ZN11ha_innobase10index_readEPcPKcj16ha_rkey_function+0x28a
              mysqld`_Z20join_read_always_keyP13st_join_table+0xc7
              mysqld`_Z10sub_selectP4JOINP13st_join_tableb+0xb7
              mysqld`_Z9do_selectP4JOINP4ListI4ItemEP8st_tableP9Procedure+0x1fd
              mysqld`_ZN4JOIN4execEv+0x12a9
              mysqld`_Z12mysql_selectP3THDPPP4ItemP10TABLE_LISTjR4ListIS1_ES2_jP8...
              mysqld`_Z13handle_selectP3THDP6st_lexP13select_resultm+0x145
              mysqld`_Z21mysql_execute_commandP3THD+0xe6e
              mysqld`_Z11mysql_parseP3THDPKcjPS2_+0x116
              mysqld`_Z16dispatch_command19enum_server_commandP3THDPcj+0xfc1
              mysqld`_Z10do_commandP3THD+0xb8
              mysqld`handle_one_connection+0x7f7
              libc.so.1`_thrp_setup+0x8d
              libc.so.1`_lwp_start

           value  ------------- Distribution ------------- count
         4194304 |                                         0
         8388608 |@@@@@@@@@@@@@@@@@@@@@@@@@@@@@@@@@@@@@@@@ 124
        16777216 |                                         0


              genunix`cv_wait_sig_swap_core+0x170
              genunix`cv_wait_sig_swap+0x18
              genunix`cv_waituntil_sig+0x13c
              genunix`lwp_park+0x157
              genunix`syslwp_park+0x31
              unix`sys_syscall+0x17a

              libc.so.1`__lwp_park+0x17
              libc.so.1`cond_wait_queue+0x68
              libc.so.1`__cond_wait+0x7b
              libc.so.1`cond_wait+0x23
              libc.so.1`pthread_cond_wait+0x9
              mysqld`os_event_wait+0x27
              mysqld`srv_suspend_mysql_thread+0x29b
              mysqld`row_mysql_handle_errors+0x6e	<- DB lock wait
              mysqld`row_search_for_mysql+0x909
              mysqld`_ZN11ha_innobase10index_readEPcPKcj16ha_rkey_function+0x193
              mysqld`_ZN7handler16read_range_firstEPK12st_key_rangeS2_bb+0x99
              mysqld`_ZN7handler22read_multi_range_firstEPP18st_key_multi_rangeS1...
              mysqld`_ZN18QUICK_RANGE_SELECT8get_nextEv+0x100
              mysqld`_Z8rr_quickP14st_read_record+0x1d
              mysqld`_Z12mysql_updateP3THDP10TABLE_LISTR4ListI4ItemES6_PS4_jP8st_...
              mysqld`_Z21mysql_execute_commandP3THD+0x3581
              mysqld`_Z11mysql_parseP3THDPKcjPS2_+0x116
              mysqld`_Z16dispatch_command19enum_server_commandP3THDPcj+0xfc1
              mysqld`_Z10do_commandP3THD+0xb8
              mysqld`handle_one_connection+0x7f7

           value  ------------- Distribution ------------- count
         4194304 |                                         0
         8388608 |@@@@@@@@@@                               1
        16777216 |@@@@@@@@@@@@@@@@@@@@                     2
        33554432 |                                         0
        67108864 |                                         0
       134217728 |                                         0
       268435456 |                                         0
       536870912 |                                         0
      1073741824 |@@@@@@@@@@                               1
      2147483648 |                                         0
I've included the last two off-CPU types and my interpretations: the first is innodb thread concurrency, where threads are put to sleep as part of the algorithm that keeps a certain number of threads running. And by sleep I mean sleep in the programming sense - it's waiting for 10 ms regardless.
The second stack I believe is the DB lock wait code-path, based on DTracing row_mysql_handle_errors() separately.
Since the distribution plot is summarizing latency from 10 ms onwards, this data could be used to provide some early warning that a problem was developing that could slow queries to unacceptable levels (eg, the typical 1 second "slow query").
This is one of the most powerful DTrace scripts I've ever written. Being able to identify these latencies so quickly is awesome.
Flame Graphs
My DTrace offcpu.d script can be used for flame graph generation. It emits stack data in folded format, which is input for flamegraph.pl. Here is the DTrace script (github):
#!/usr/sbin/dtrace -s
/*
 * offcpu.d	Trace off-CPU time and emit in folded format for flame graphs.
 *
 * See the sched:::off-cpu predicate, which currently filters on "bsdtar"
 * processes only. Change/remove as desired. This program traces all off-CPU
 * events, including involuntary context switch preempts.
[...]
 * 23-Sep-2017	Brendan Gregg	Created this.
 */

#pragma D option ustackframes=100
#pragma D option dynvarsize=32m

/*
 * Customize the following predicate as desired.
 * eg, you could add /curthread->td_state <= 1/ to exclude preempt paths and
 * involuntary context switches, which are interesting but their stacks usually
 * aren't. The "1" comes from td_state for TDS_INHIBITED. See sys/proc.h.
 *
sched:::off-cpu /execname == "bsdtar"/ { self->ts = timestamp; }

sched:::on-cpu
/self->ts/
{
	@[stack(), ustack(), execname] = sum(timestamp - self->ts);
	self->ts = 0;
}

dtrace:::END
{
	normalize(@, 1000000);
	printa("%k-%k%s\n%@d\n", @);
}
As the header comment states, you should edit the off-cpu predicate to match on your application of interest, instead of bsdtar, or you can drop it entirely to match everything. And the body comment also notes that you can add a /curthread->td_state <= 1/ predicate to exclude involuntary context switches.
Here are the steps for using this program to generate flame graphs:
# ./offcpu.d > out.stacks
# git clone https://github.com/brendangregg/FlameGraph; cd FlameGraph
# stackcollapse.pl < ../out.stacks | sed 's/kernel`//g' | \
    ./flamegraph.pl --color=io --title="Off-CPU Flame Graph" --countname=ms > out.svg
And the resulting off-CPU flame graph (SVG, PNG):
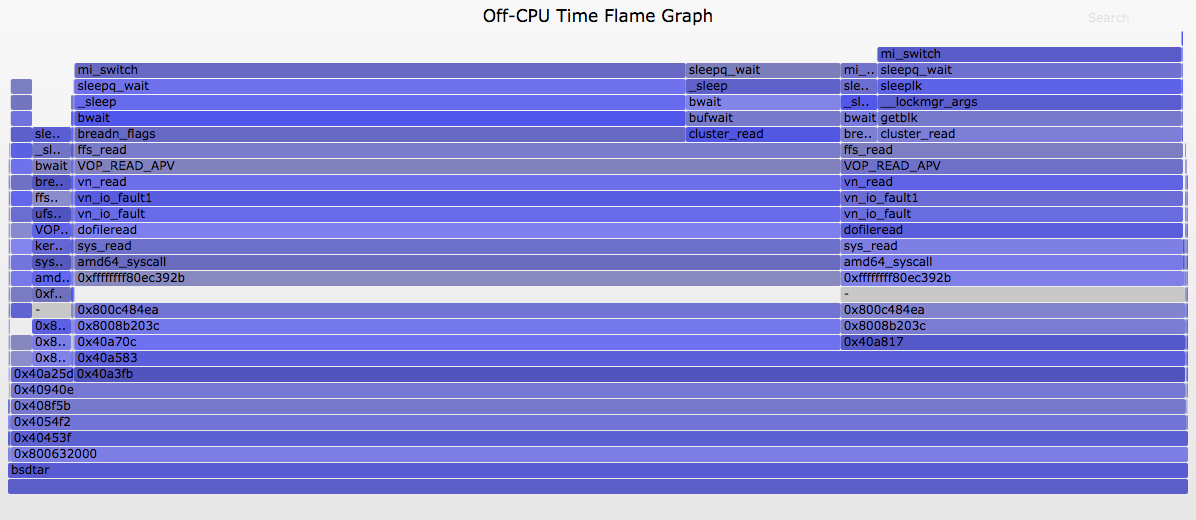
Links
- My FreeBSD Dev and Vendor Summit 2014 talk on off-CPU flame graphs.
- I posted FreeBSD Off-CPU Flame Graphs (2015) to explore the procstat -ka sampling approach.
- My EuroBSDcon 2017 keynote includes off-CPU analysis and flame graphs.
Return to the main Off-CPU Analysis page.