illumosday 2012: DTracing the Cloud
Video: http://www.youtube.com/watch?v=uZTMuXXFG38A talk for illumosday 2012 by Brendan Gregg.
Description: "Cloud computing facilitates rapid deployment and scaling, often pushing high load at applications under continual development. DTrace allows immediate analysis of issues on live production systems even in these demanding environments – no need to restart or run a special debug kernel.
For the illumos kernel, DTrace has been enhanced to support cloud computing, providing more observation capabilities to zones as used by Joyent SmartMachine customers. DTrace is also frequently used by the cloud operators to analyze systems and verify performance isolation of tenants.
This talk covers DTrace in the illumos-based cloud, showing examples of real-world performance wins."
PDF: dtracecloud2012.pdf
Keywords (from pdftotext):
slide 1:
DTracing the Cloud
Brendan Gregg
Lead Performance Engineer
brendan@joyent.com
@brendangregg
Monday, October 1, 12
October, 2012
slide 2:
DTracing the Cloud
Monday, October 1, 12
slide 3:
whoami
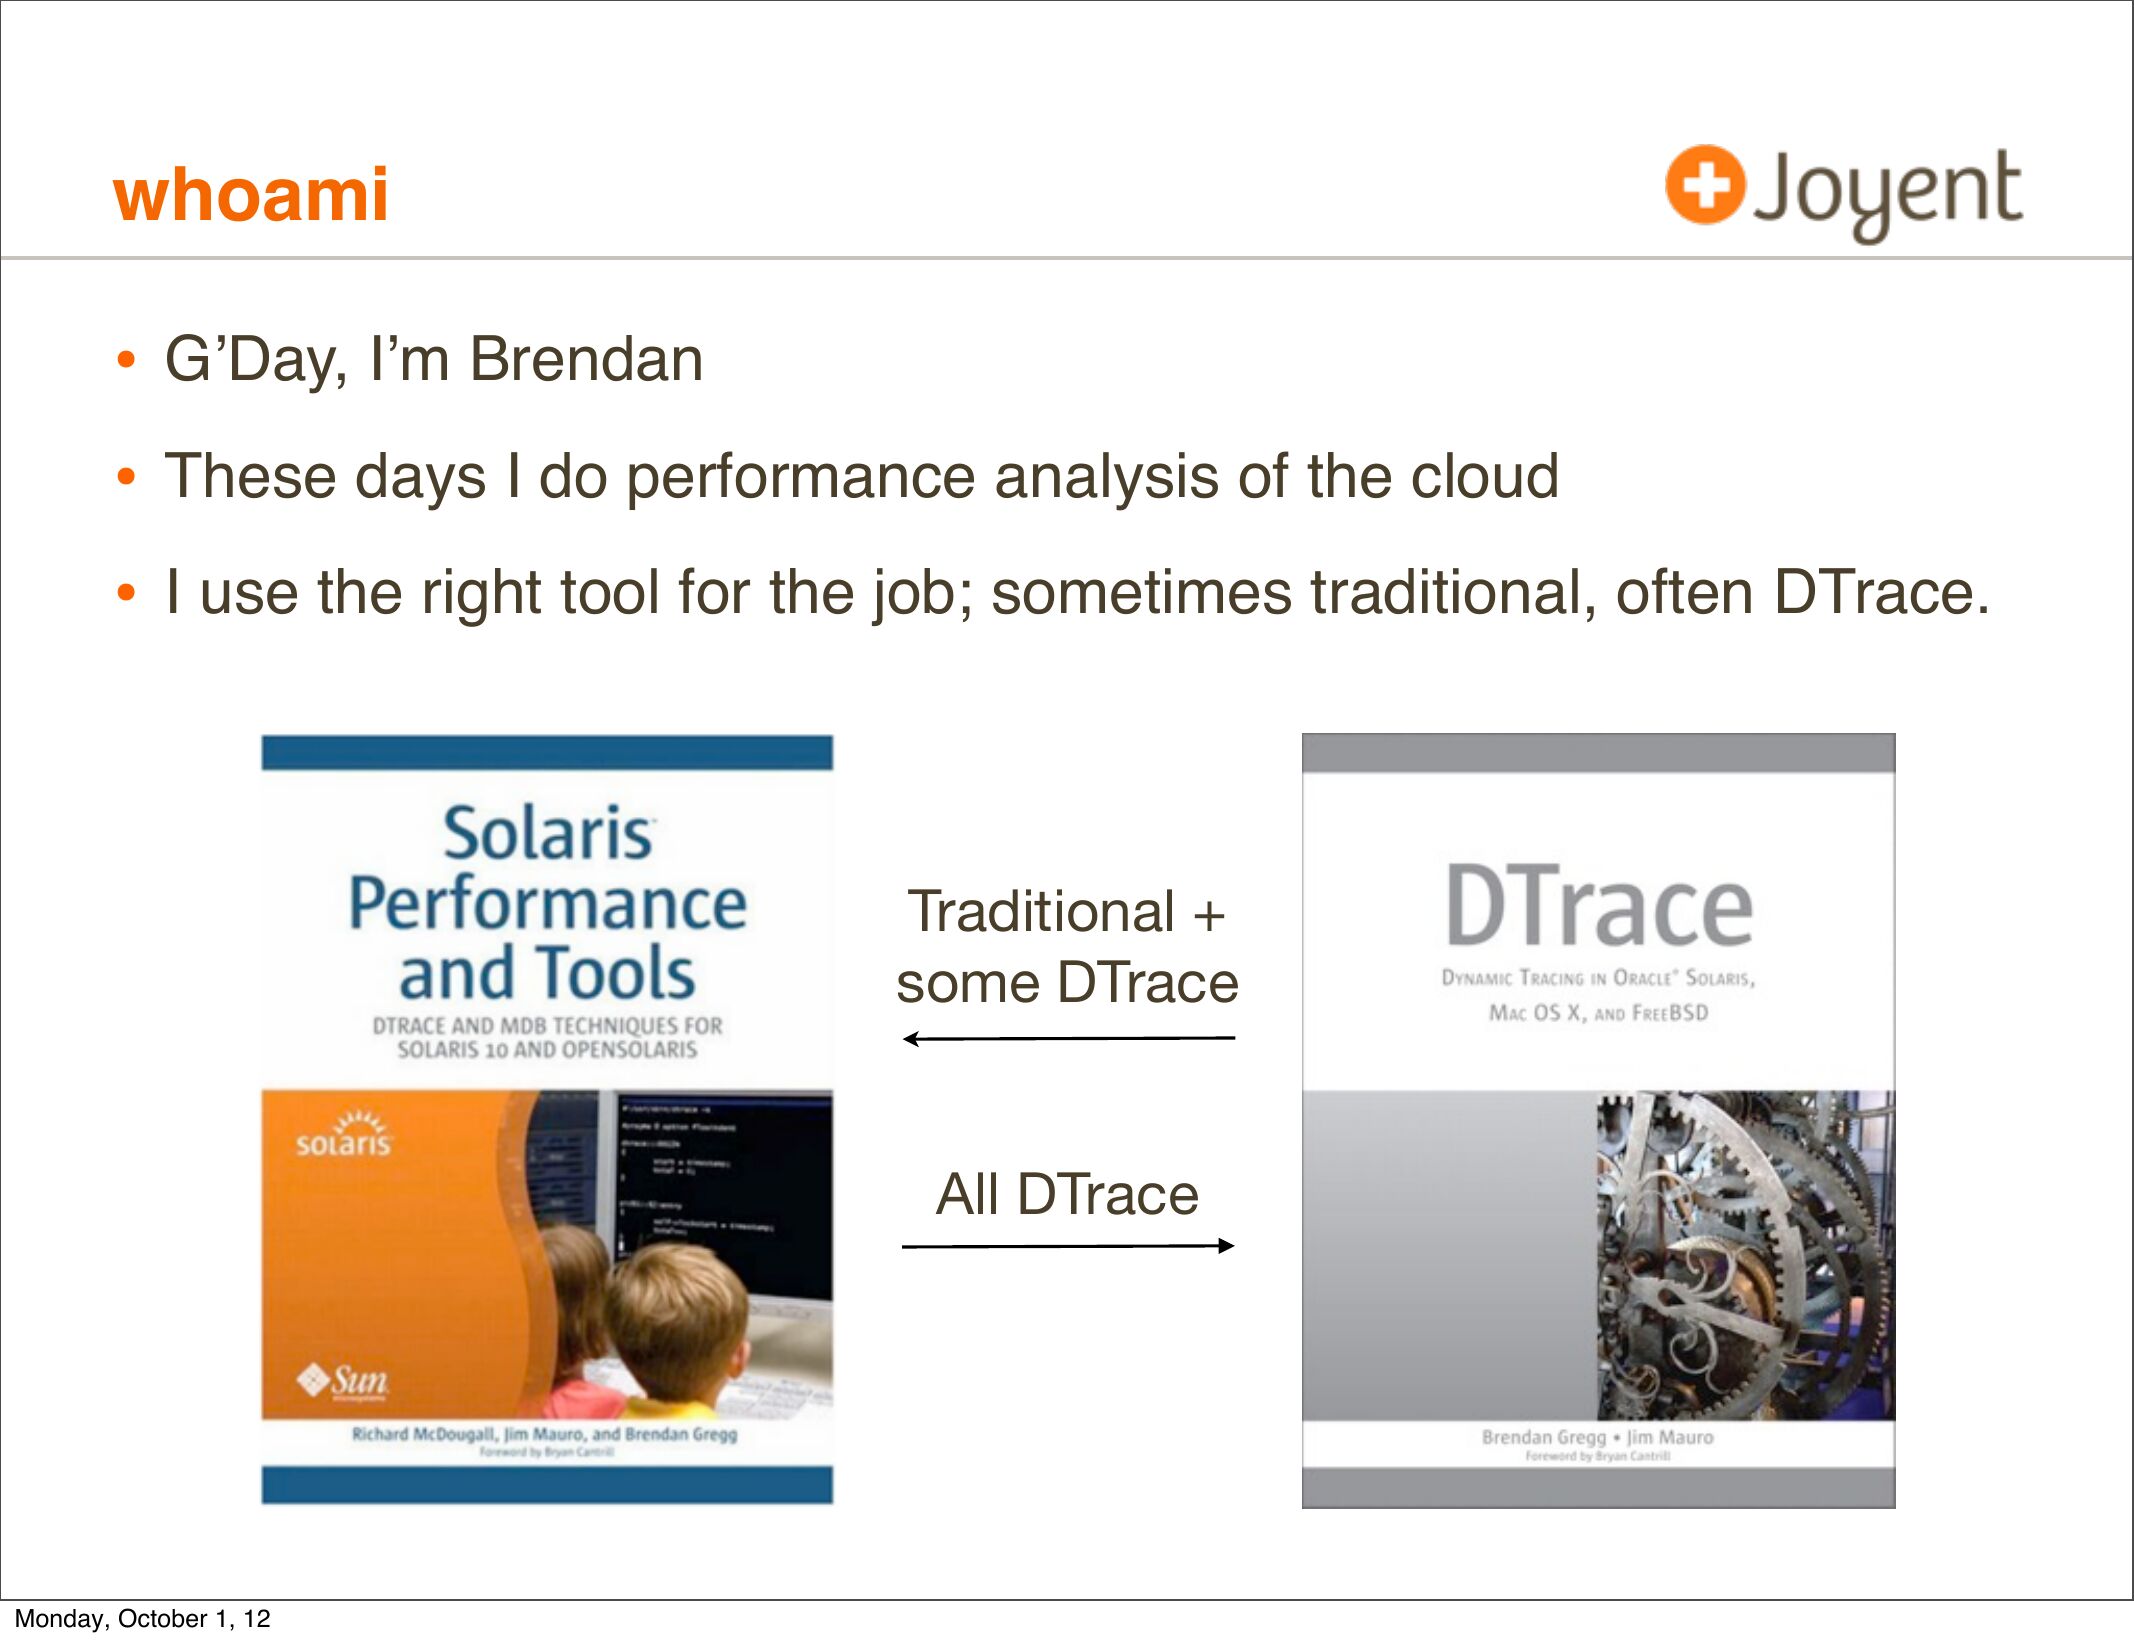
• G’Day, I’m Brendan
• These days I do performance analysis of the cloud
• I use the right tool for the job; sometimes traditional, often DTrace.
Traditional +
some DTrace
All DTrace
Monday, October 1, 12
slide 4:
DTrace
• DTrace is a magician
that conjures up
rainbows, ponies
and unicorns —
and does it all
entirely safely
and in production!
Monday, October 1, 12
slide 5:
DTrace
• Or, the version with fewer ponies:
• DTrace is a performance analysis and troubleshooting tool
• Instruments all software, kernel and user-land.
• Production safe. Designed for minimum overhead.
• Default in SmartOS, Oracle Solaris, Mac OS X and FreeBSD.
Two Linux ports are in development.
• There’s a couple of awesome books about it.
Monday, October 1, 12
slide 6:
illumos
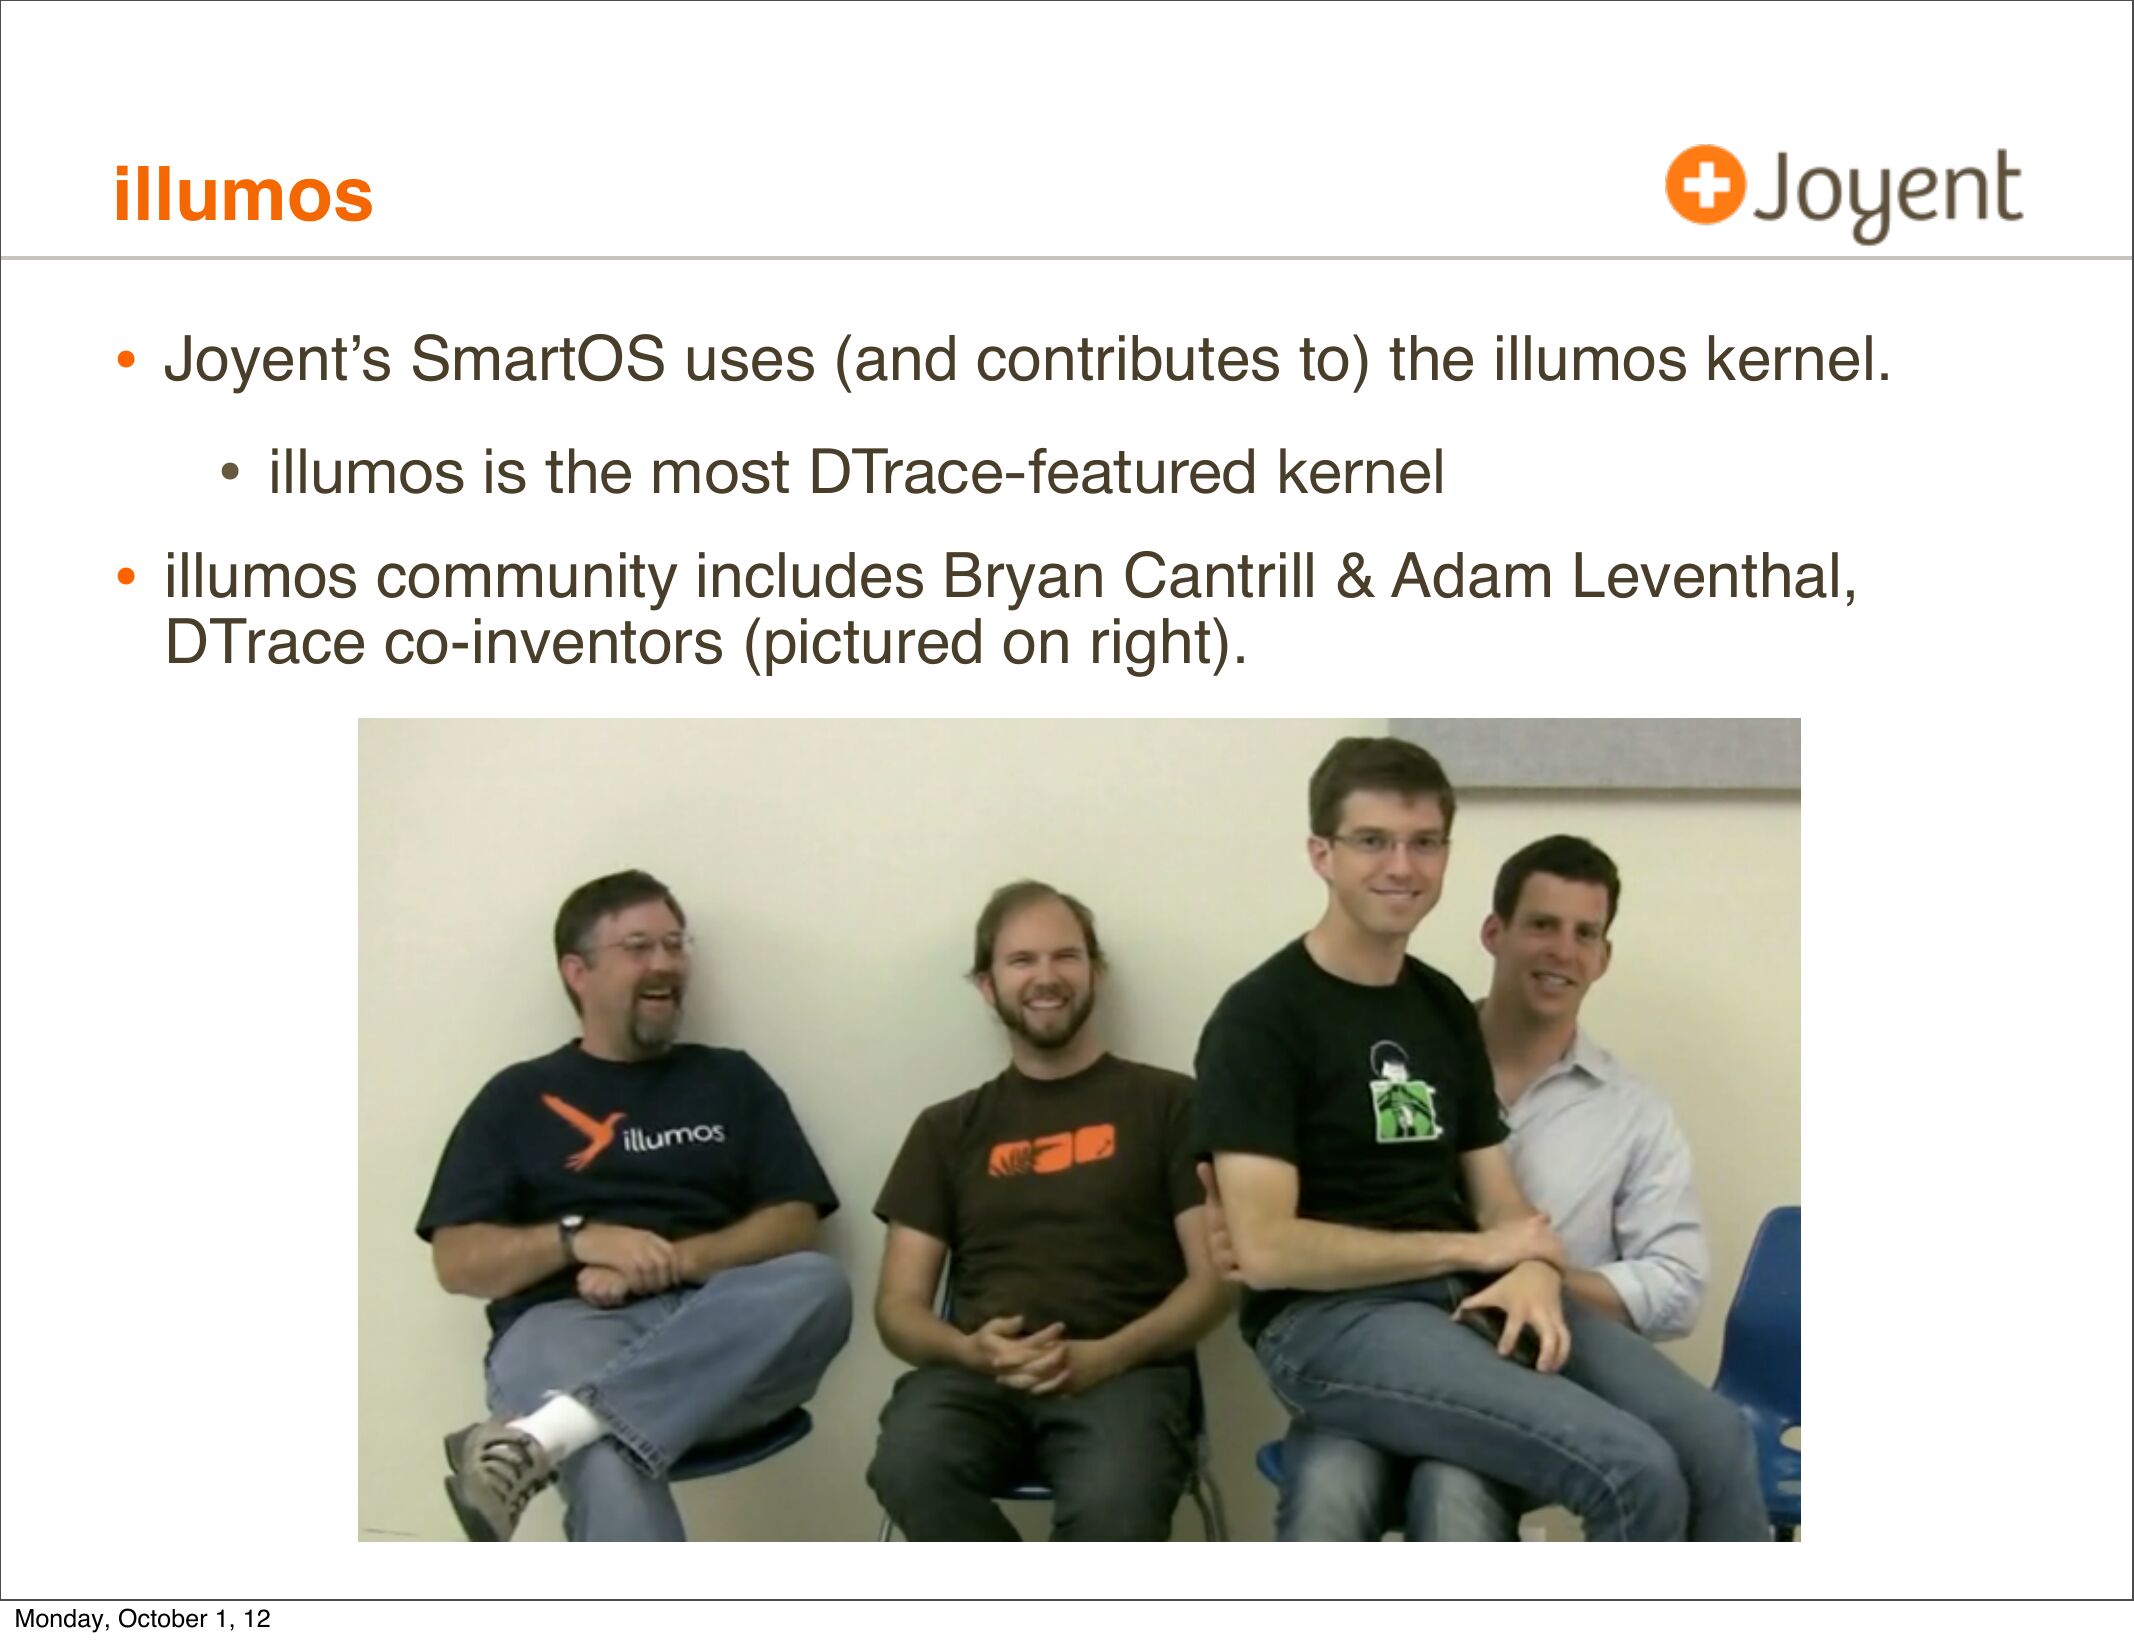
• Joyent’s SmartOS uses (and contributes to) the illumos kernel.
• illumos is the most DTrace-featured kernel
• illumos community includes Bryan Cantrill & Adam Leventhal,
DTrace co-inventors (pictured on right).
Monday, October 1, 12
slide 7:
Agenda
• Theory
• Cloud types and DTrace visibility
• Reality
• DTrace and Zones
• DTrace Wins
• Tools
• DTrace Cloud Tools
• Cloud Analytics
• Case Studies
Monday, October 1, 12
slide 8:
Theory
Monday, October 1, 12
slide 9:
Cloud Types
• We deploy two types of virtualization on SmartOS/illumos:
• Hardware Virtualization: KVM
• OS-Virtualization: Zones
Monday, October 1, 12
slide 10:
Cloud Types, cont.
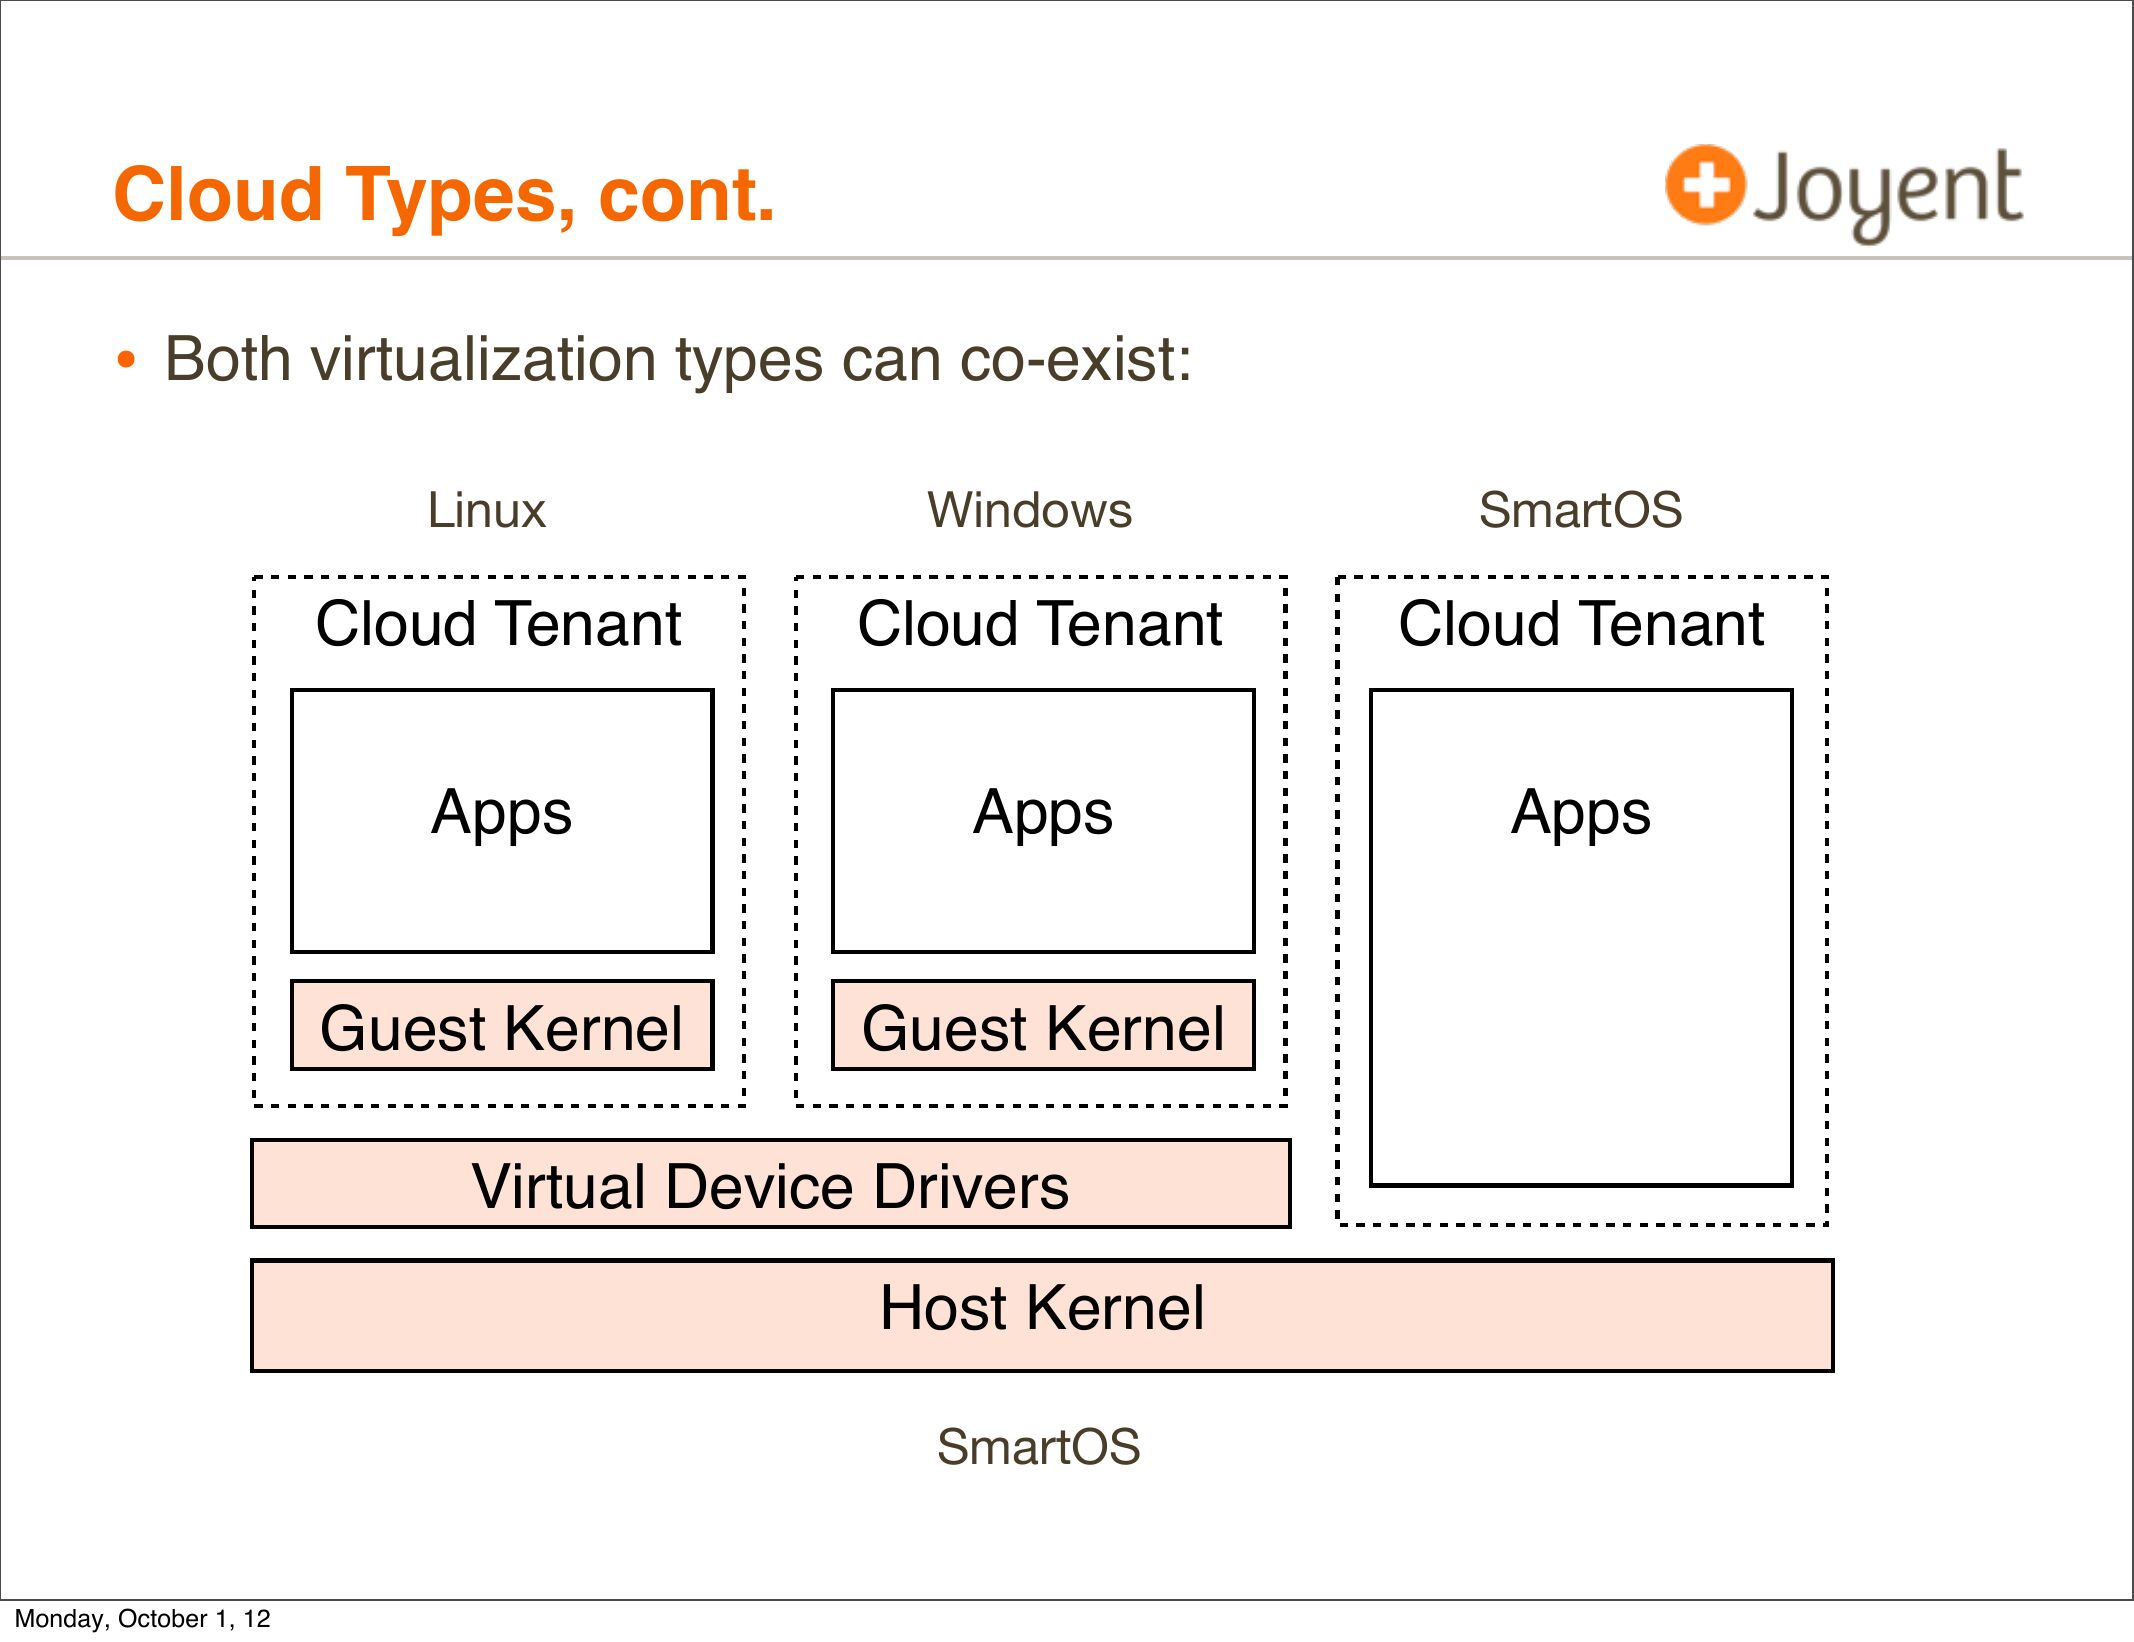
• Both virtualization types can co-exist:
Linux
Windows
SmartOS
Cloud Tenant
Cloud Tenant
Cloud Tenant
Apps
Apps
Apps
Guest Kernel
Guest Kernel
Virtual Device Drivers
Host Kernel
SmartOS
Monday, October 1, 12
slide 11:
Cloud Types, cont.
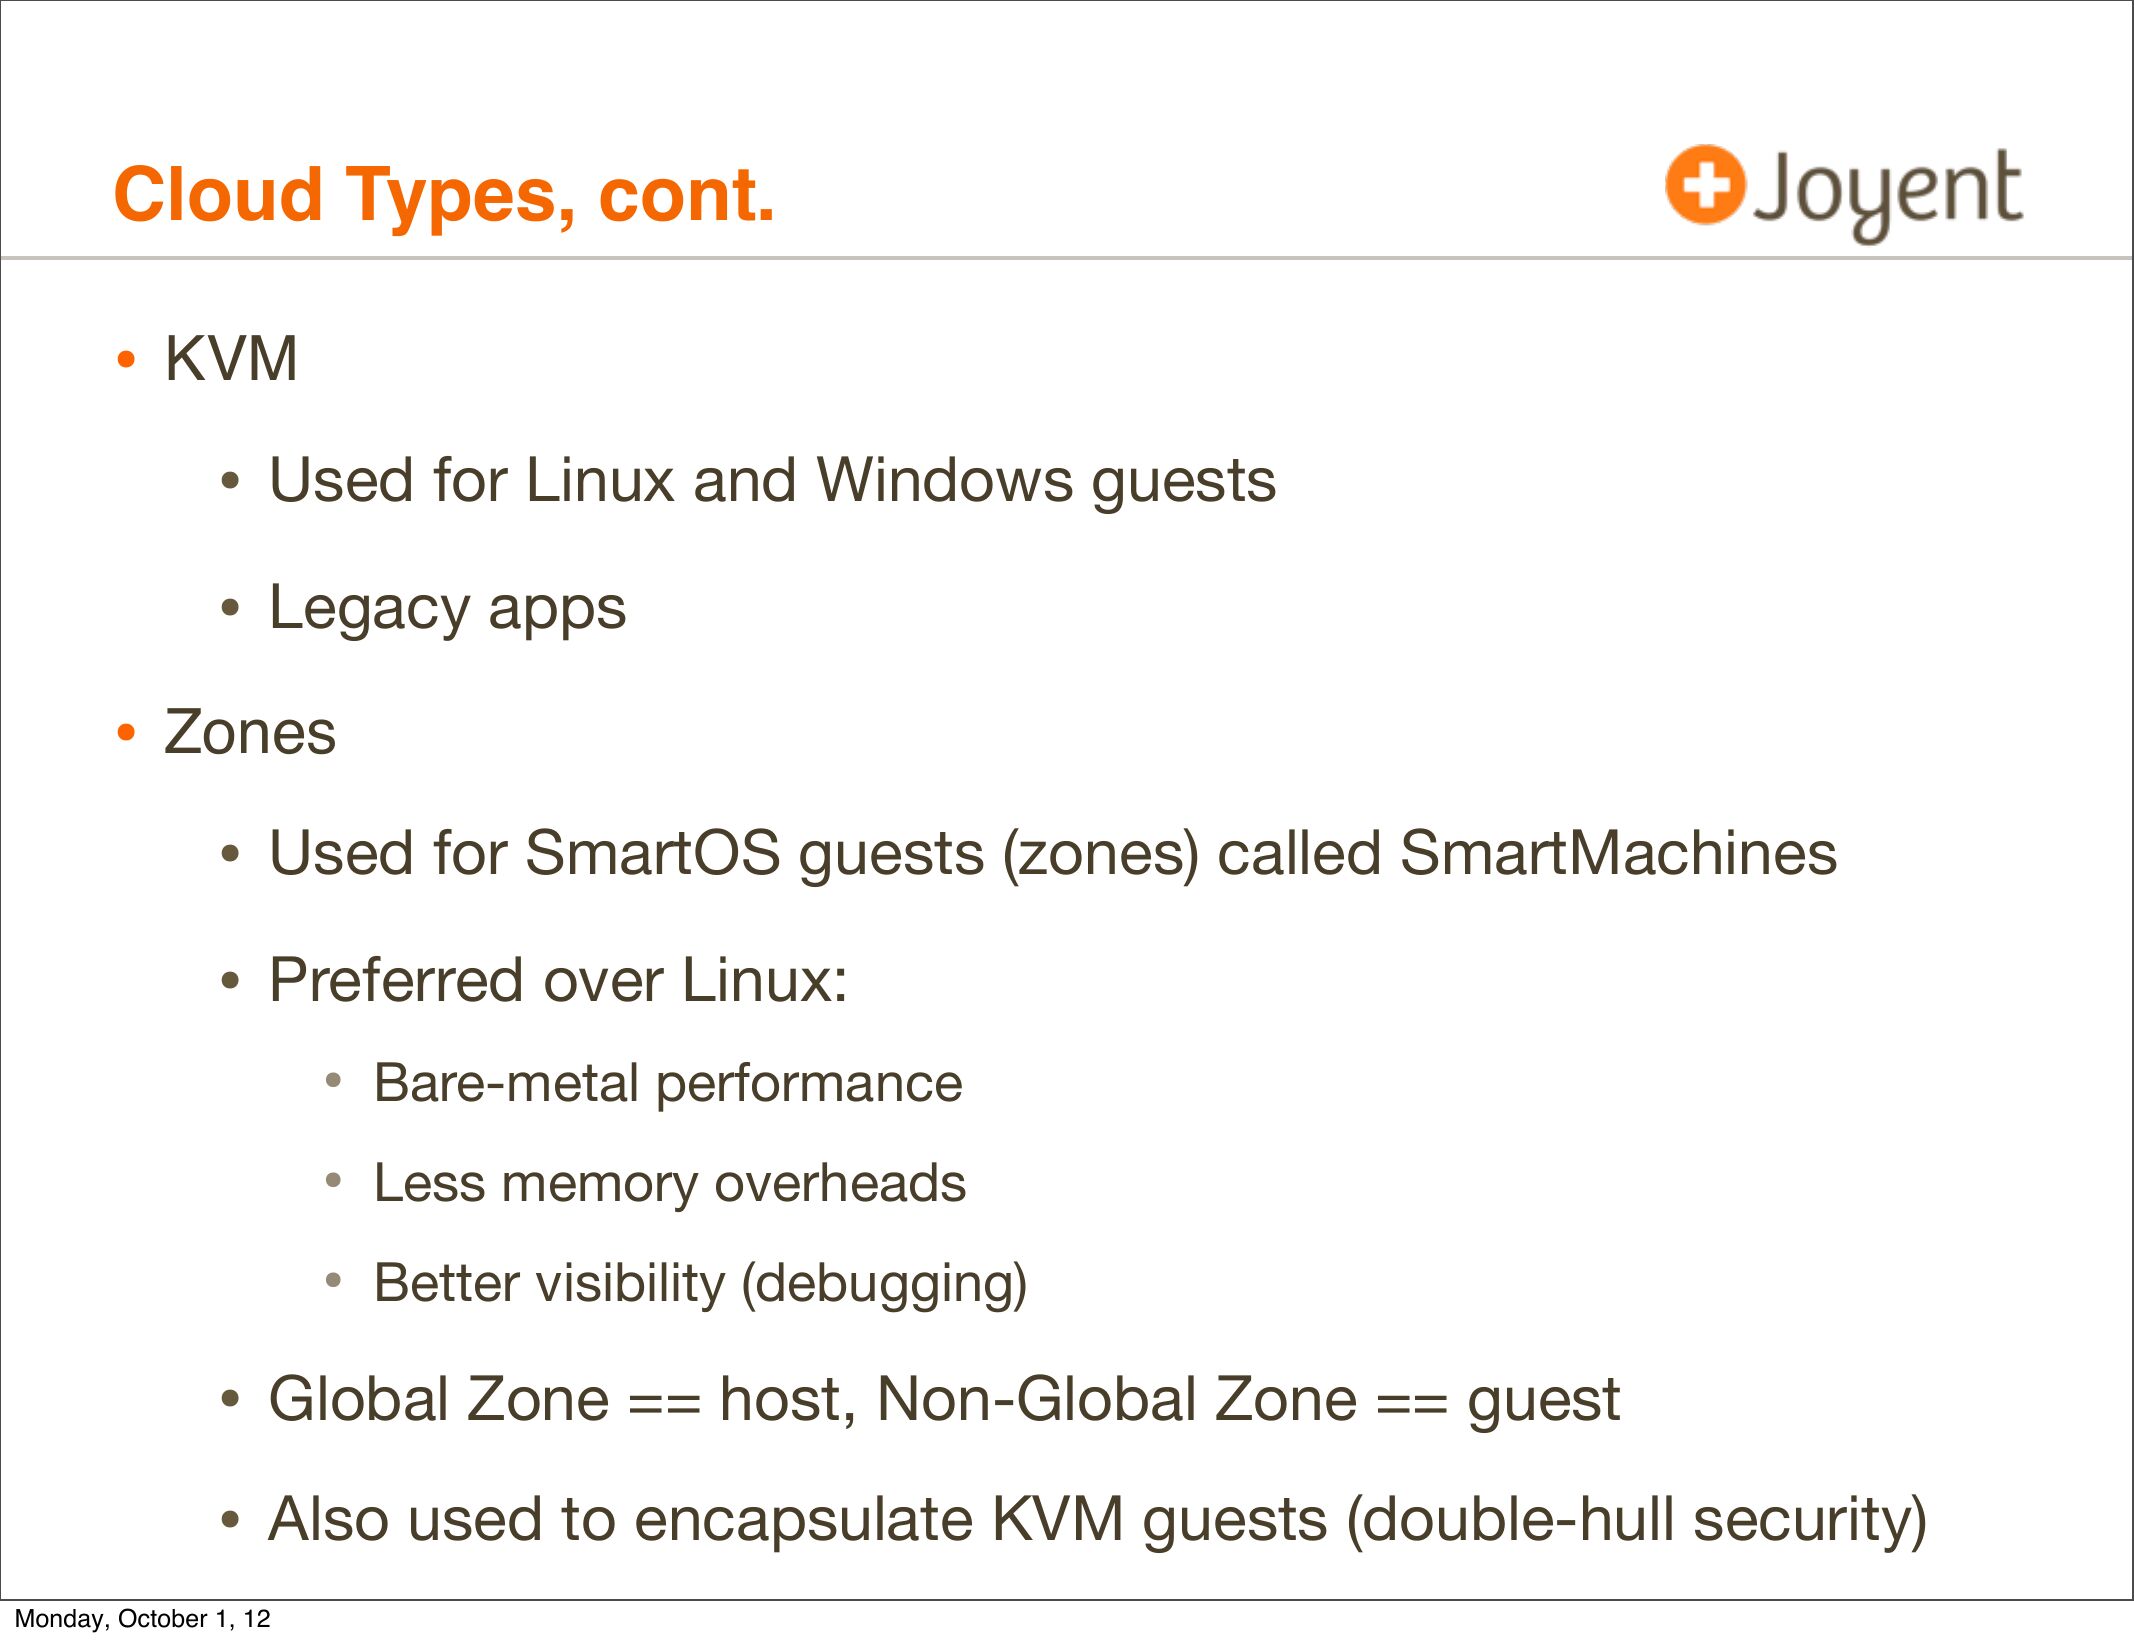
• KVM
• Used for Linux and Windows guests
• Legacy apps
• Zones
• Used for SmartOS guests (zones) called SmartMachines
• Preferred over Linux:
• Bare-metal performance
• Less memory overheads
• Better visibility (debugging)
• Global Zone == host, Non-Global Zone == guest
• Also used to encapsulate KVM guests (double-hull security)
Monday, October 1, 12
slide 12:
Cloud Types, cont.
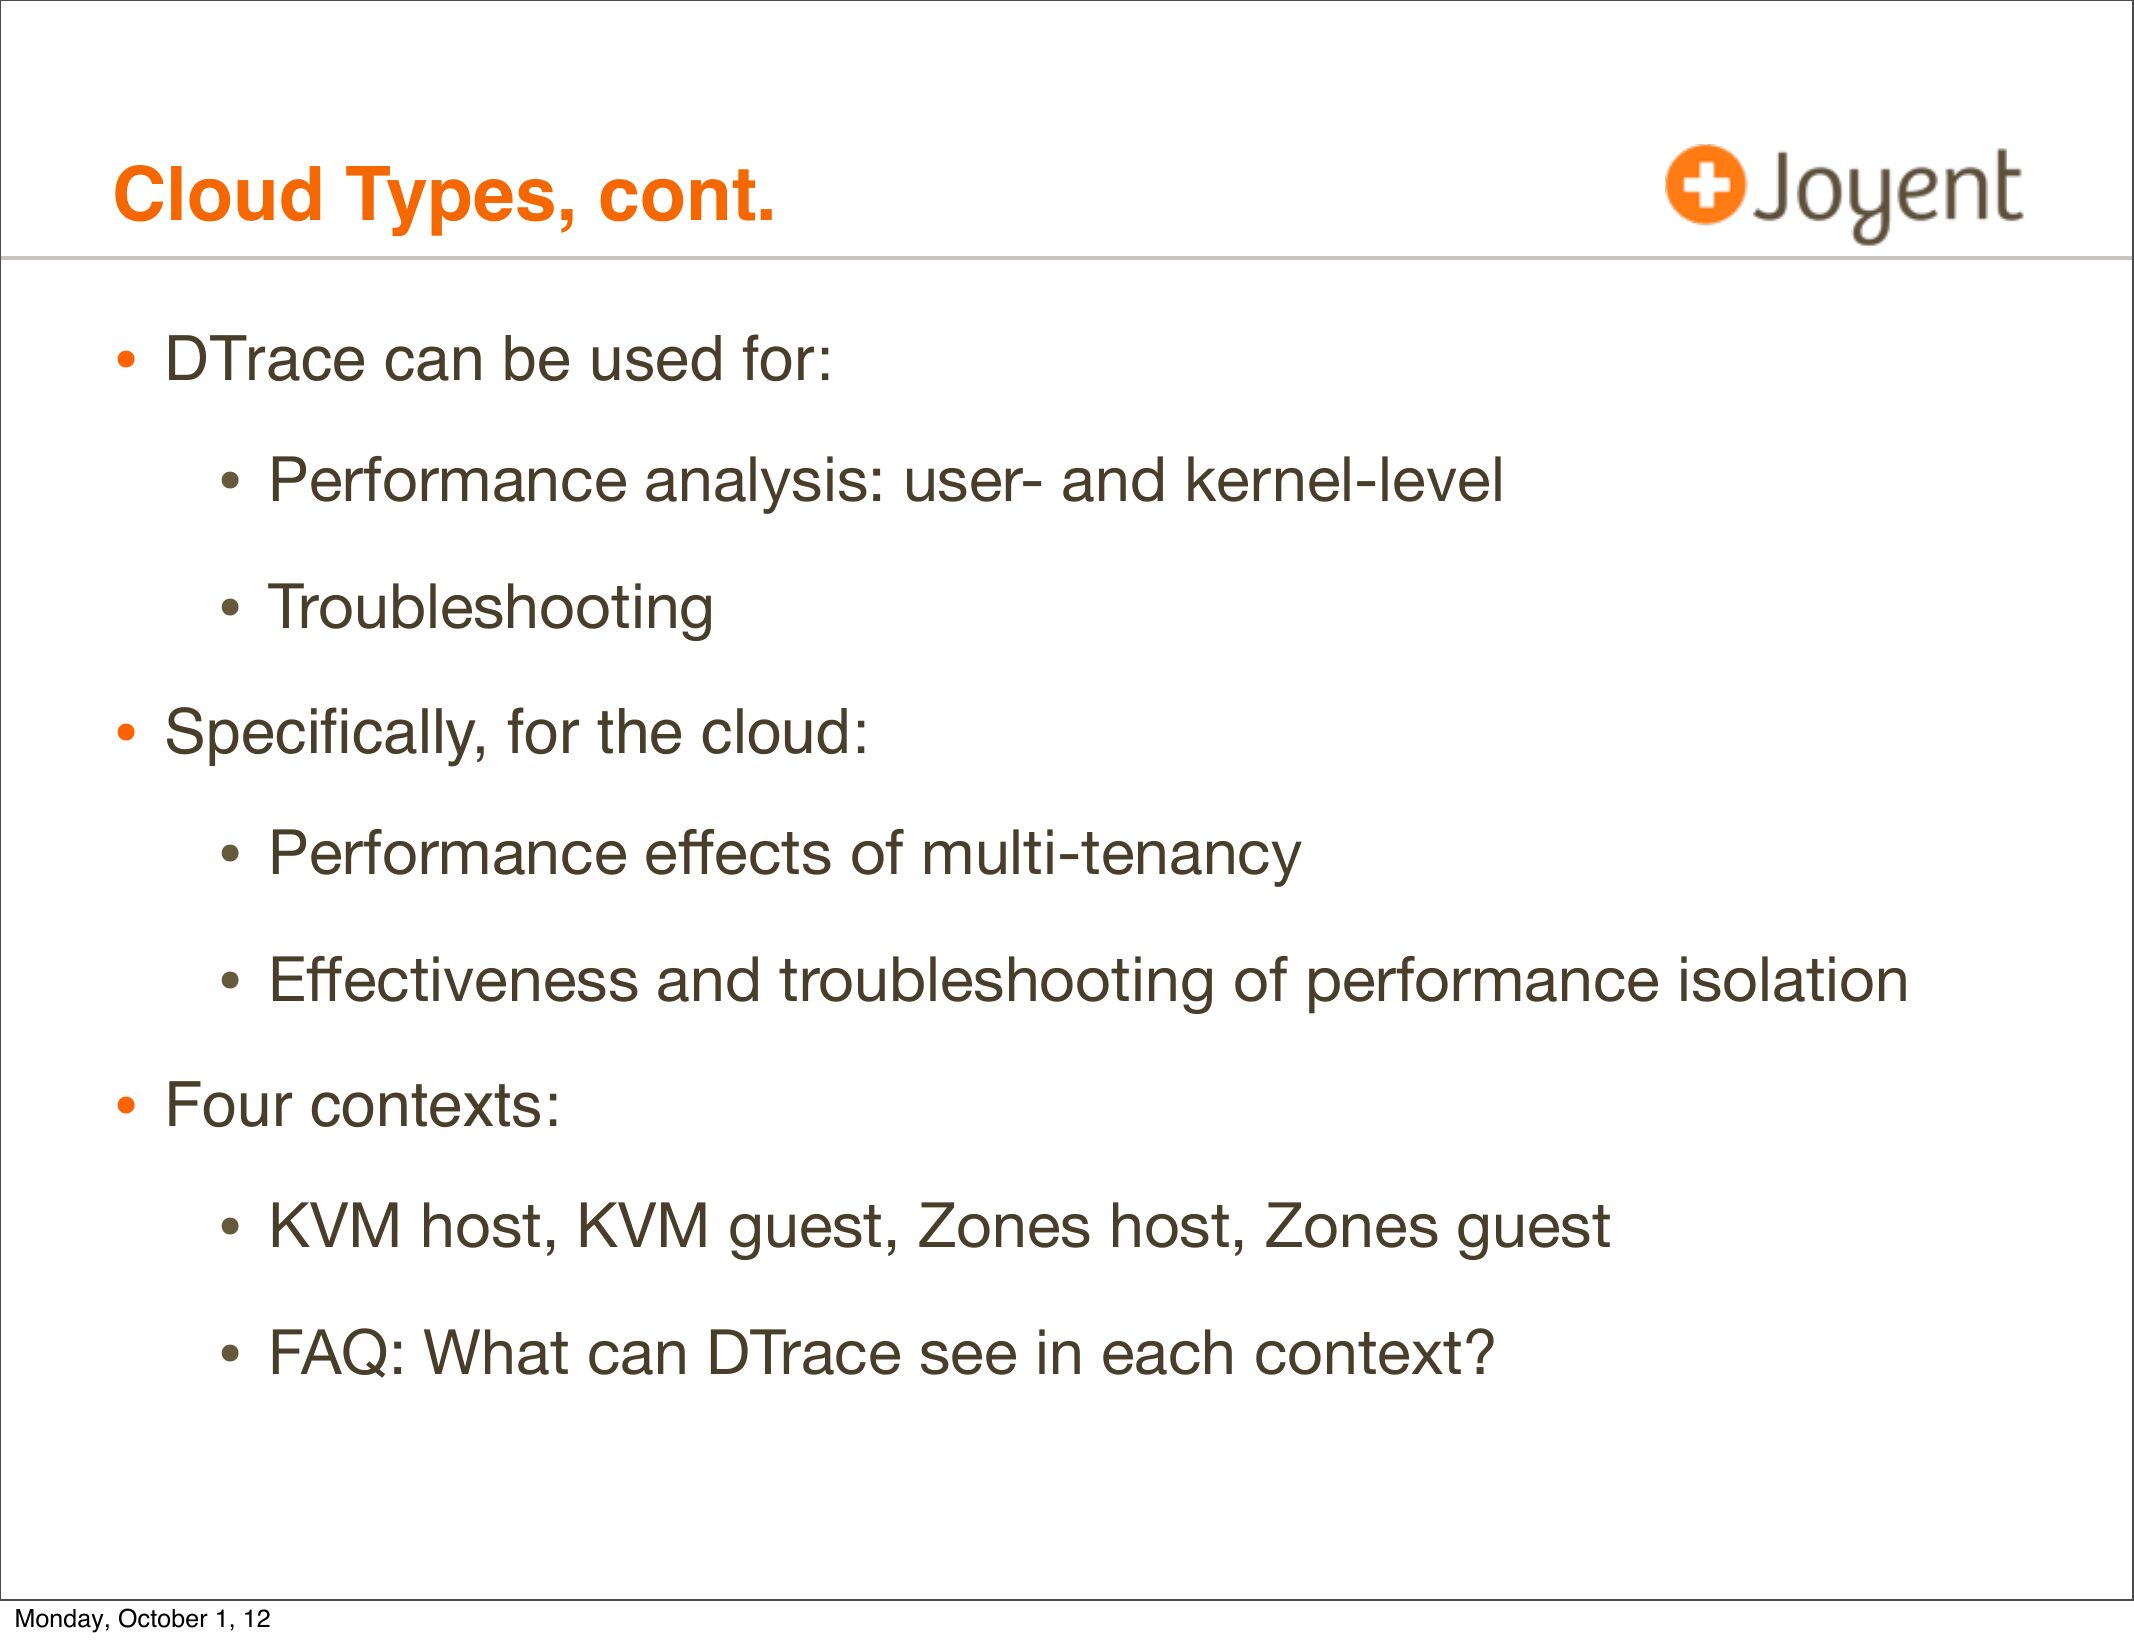
• DTrace can be used for:
• Performance analysis: user- and kernel-level
• Troubleshooting
• Specifically, for the cloud:
• Performance effects of multi-tenancy
• Effectiveness and troubleshooting of performance isolation
• Four contexts:
• KVM host, KVM guest, Zones host, Zones guest
• FAQ: What can DTrace see in each context?
Monday, October 1, 12
slide 13:
Hardware Virtualization: DTrace Visibility
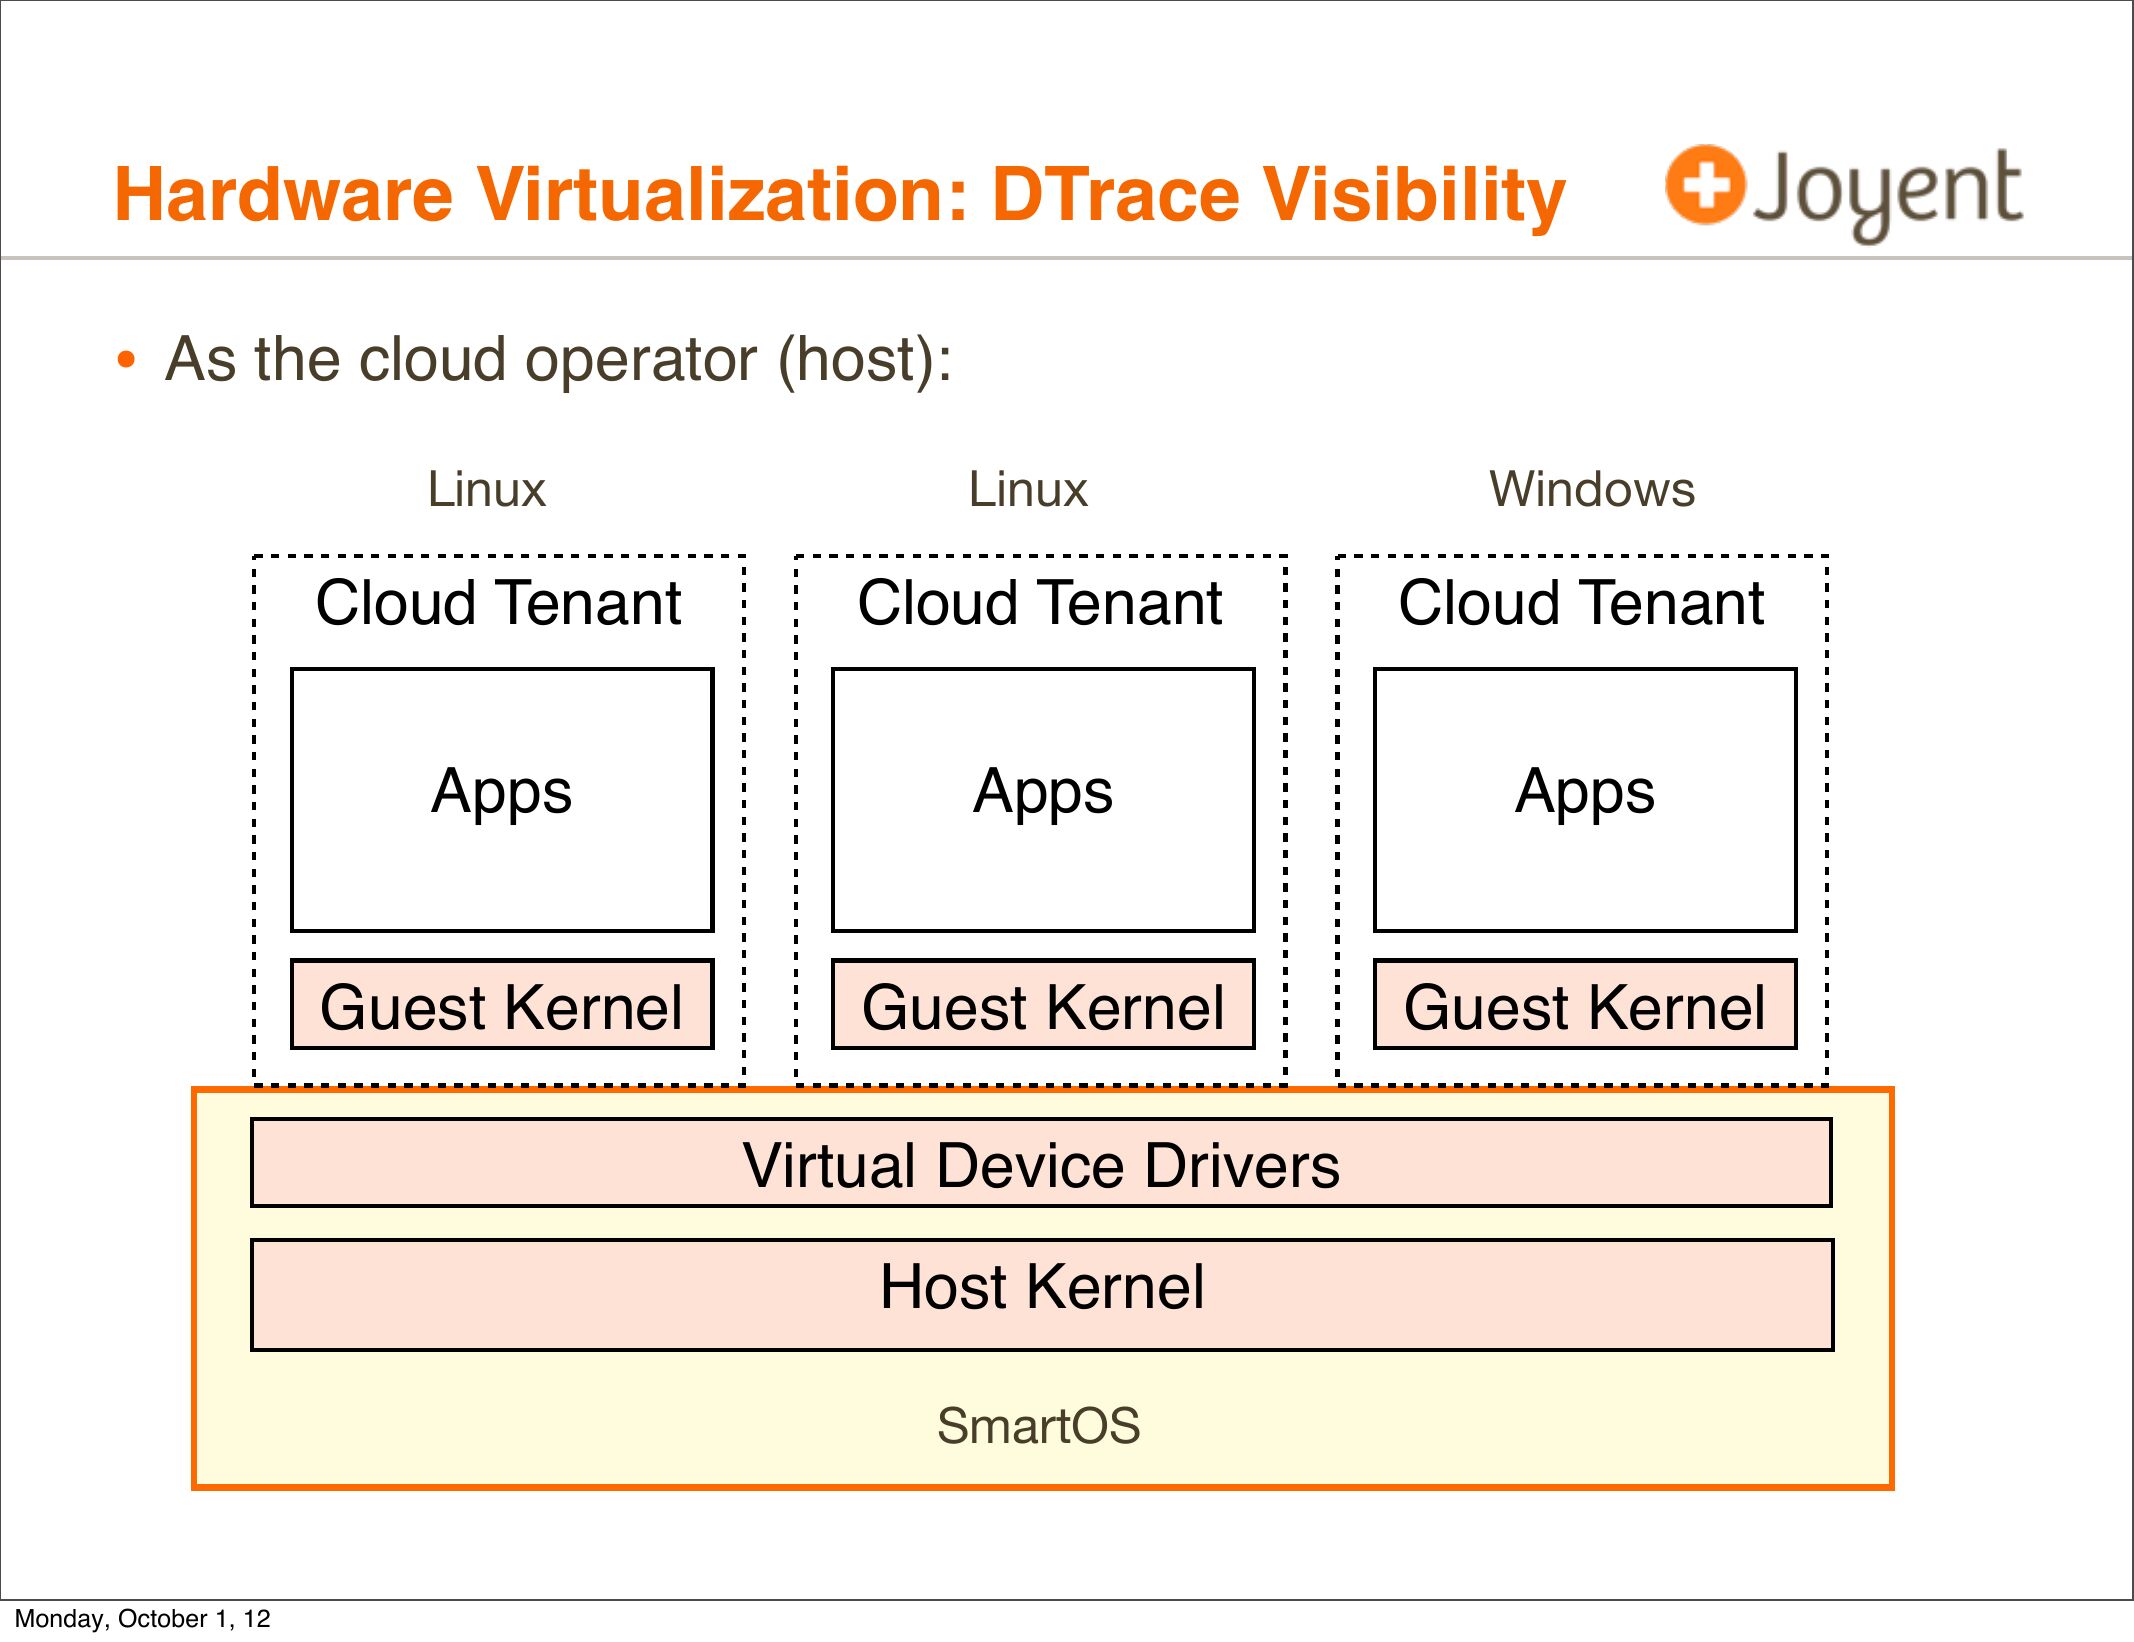
• As the cloud operator (host):
Linux
Linux
Windows
Cloud Tenant
Cloud Tenant
Cloud Tenant
Apps
Apps
Apps
Guest Kernel
Guest Kernel
Guest Kernel
Virtual Device Drivers
Host Kernel
SmartOS
Monday, October 1, 12
slide 14:
Hardware Virtualization: DTrace Visibility
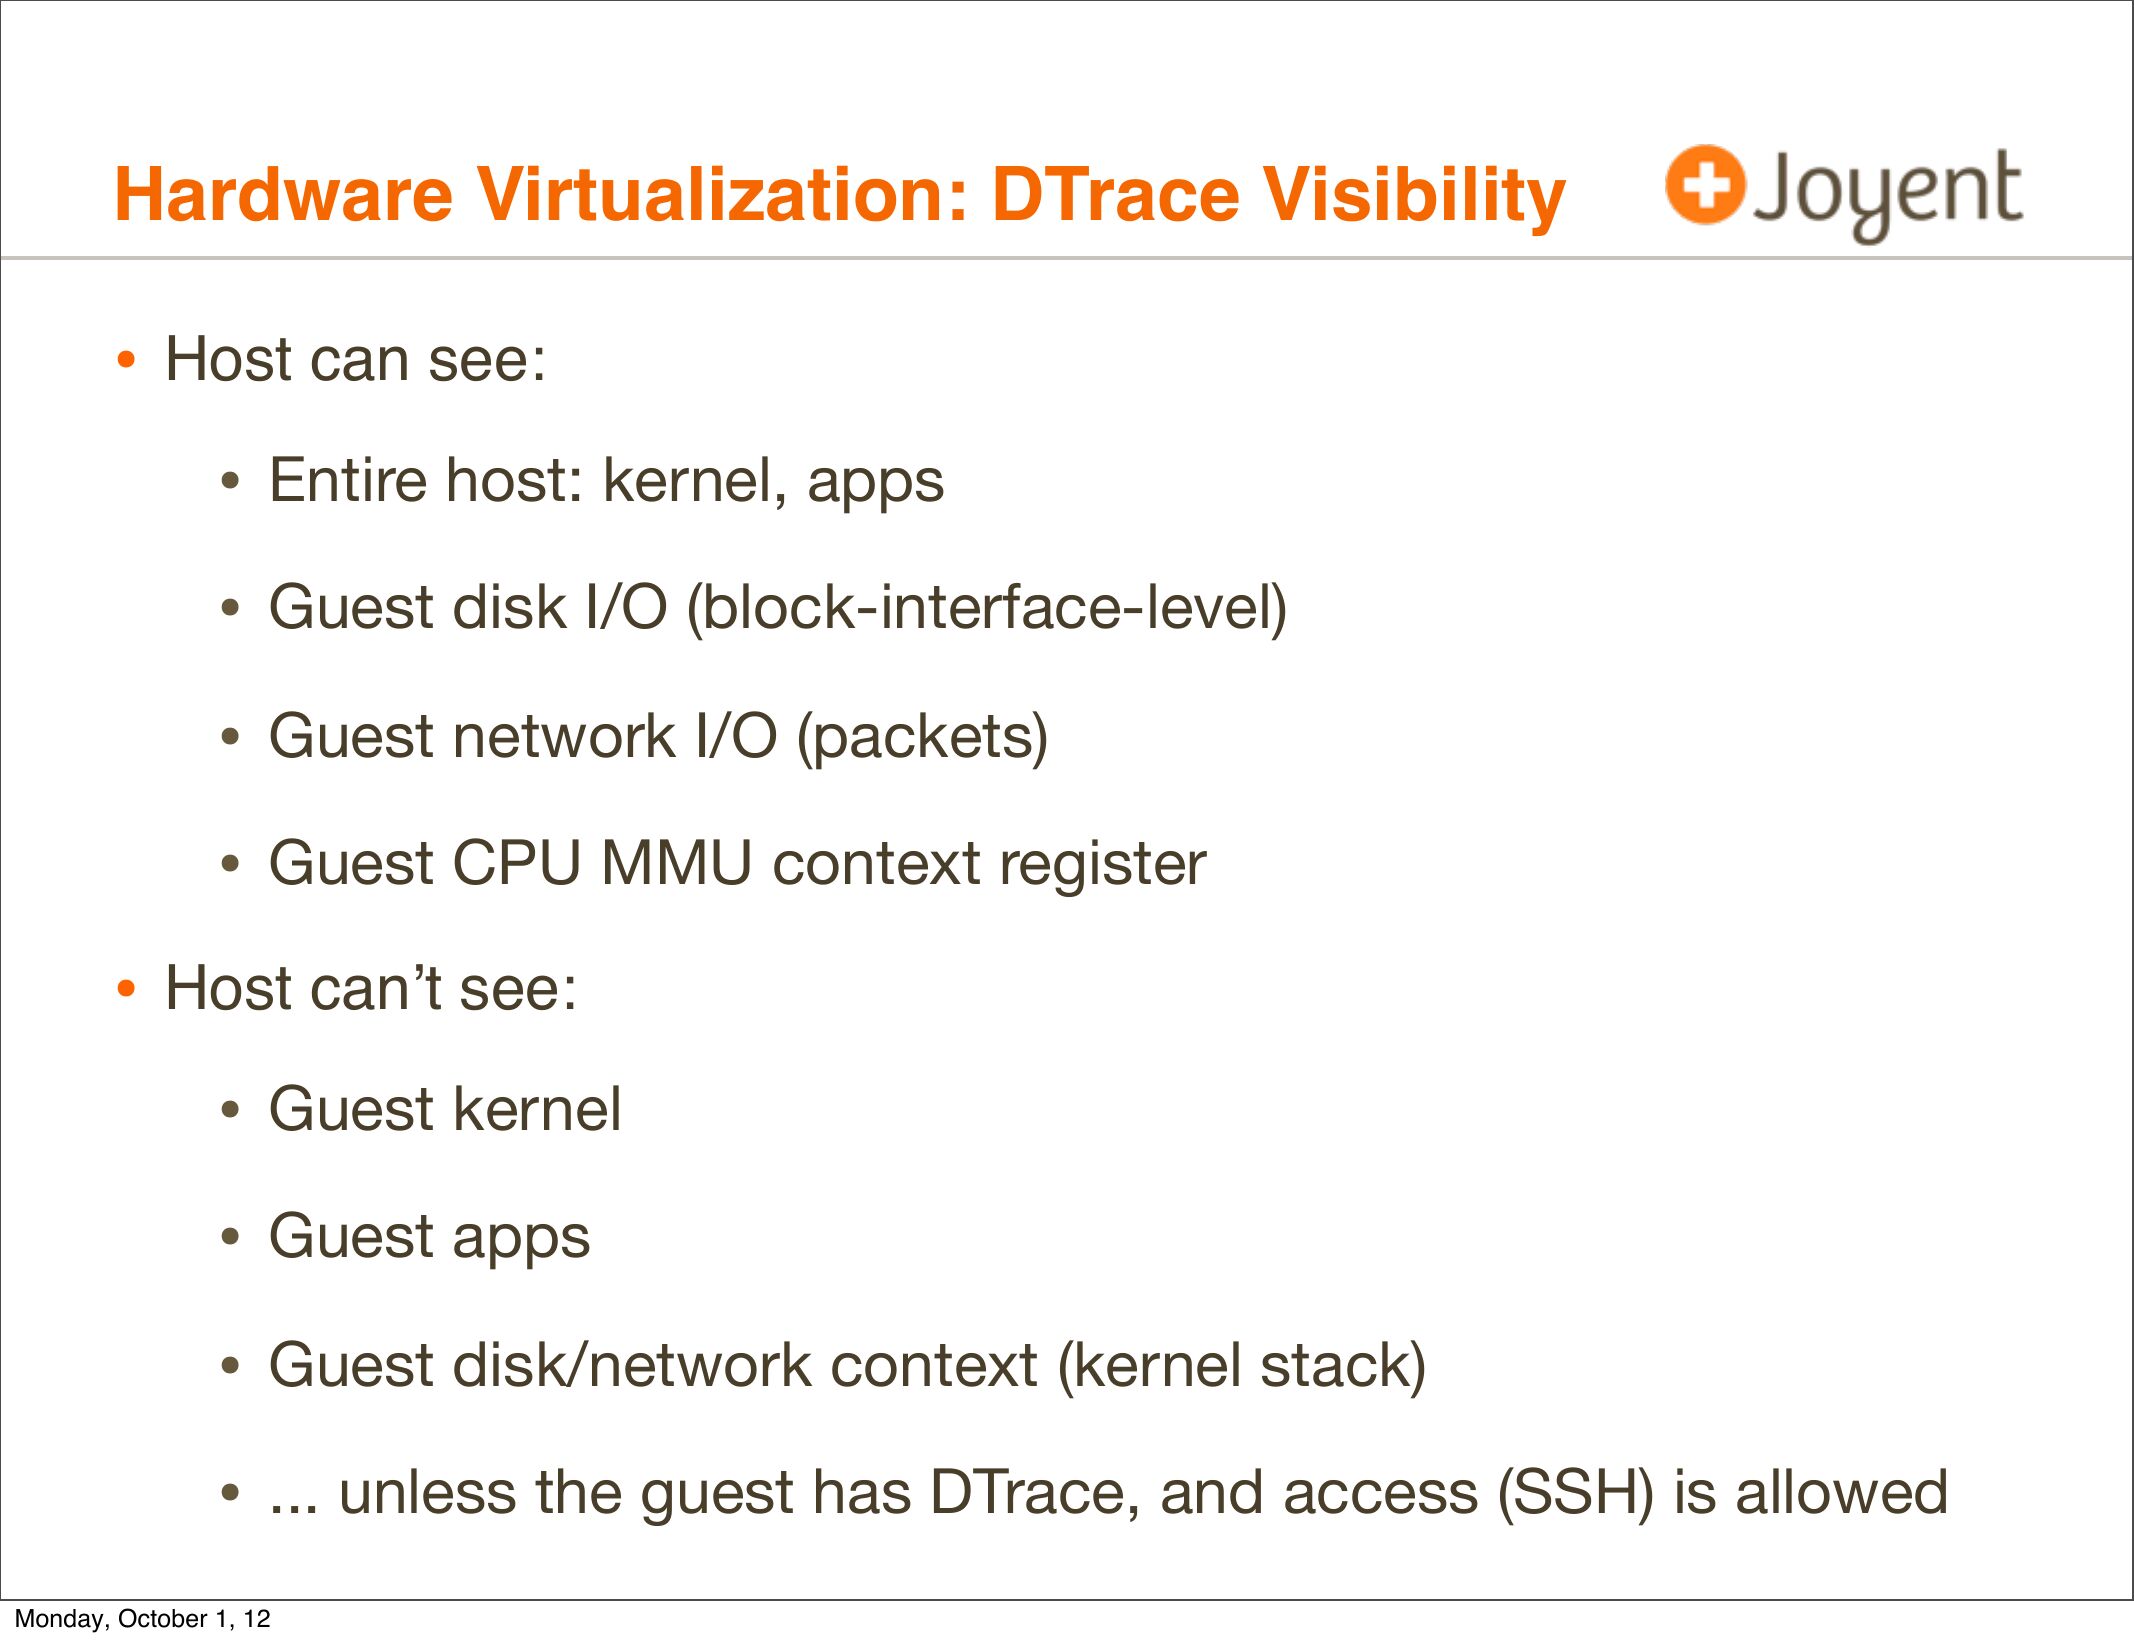
• Host can see:
• Entire host: kernel, apps
• Guest disk I/O (block-interface-level)
• Guest network I/O (packets)
• Guest CPU MMU context register
• Host can’t see:
• Guest kernel
• Guest apps
• Guest disk/network context (kernel stack)
• ... unless the guest has DTrace, and access (SSH) is allowed
Monday, October 1, 12
slide 15:
Hardware Virtualization: DTrace Visibility
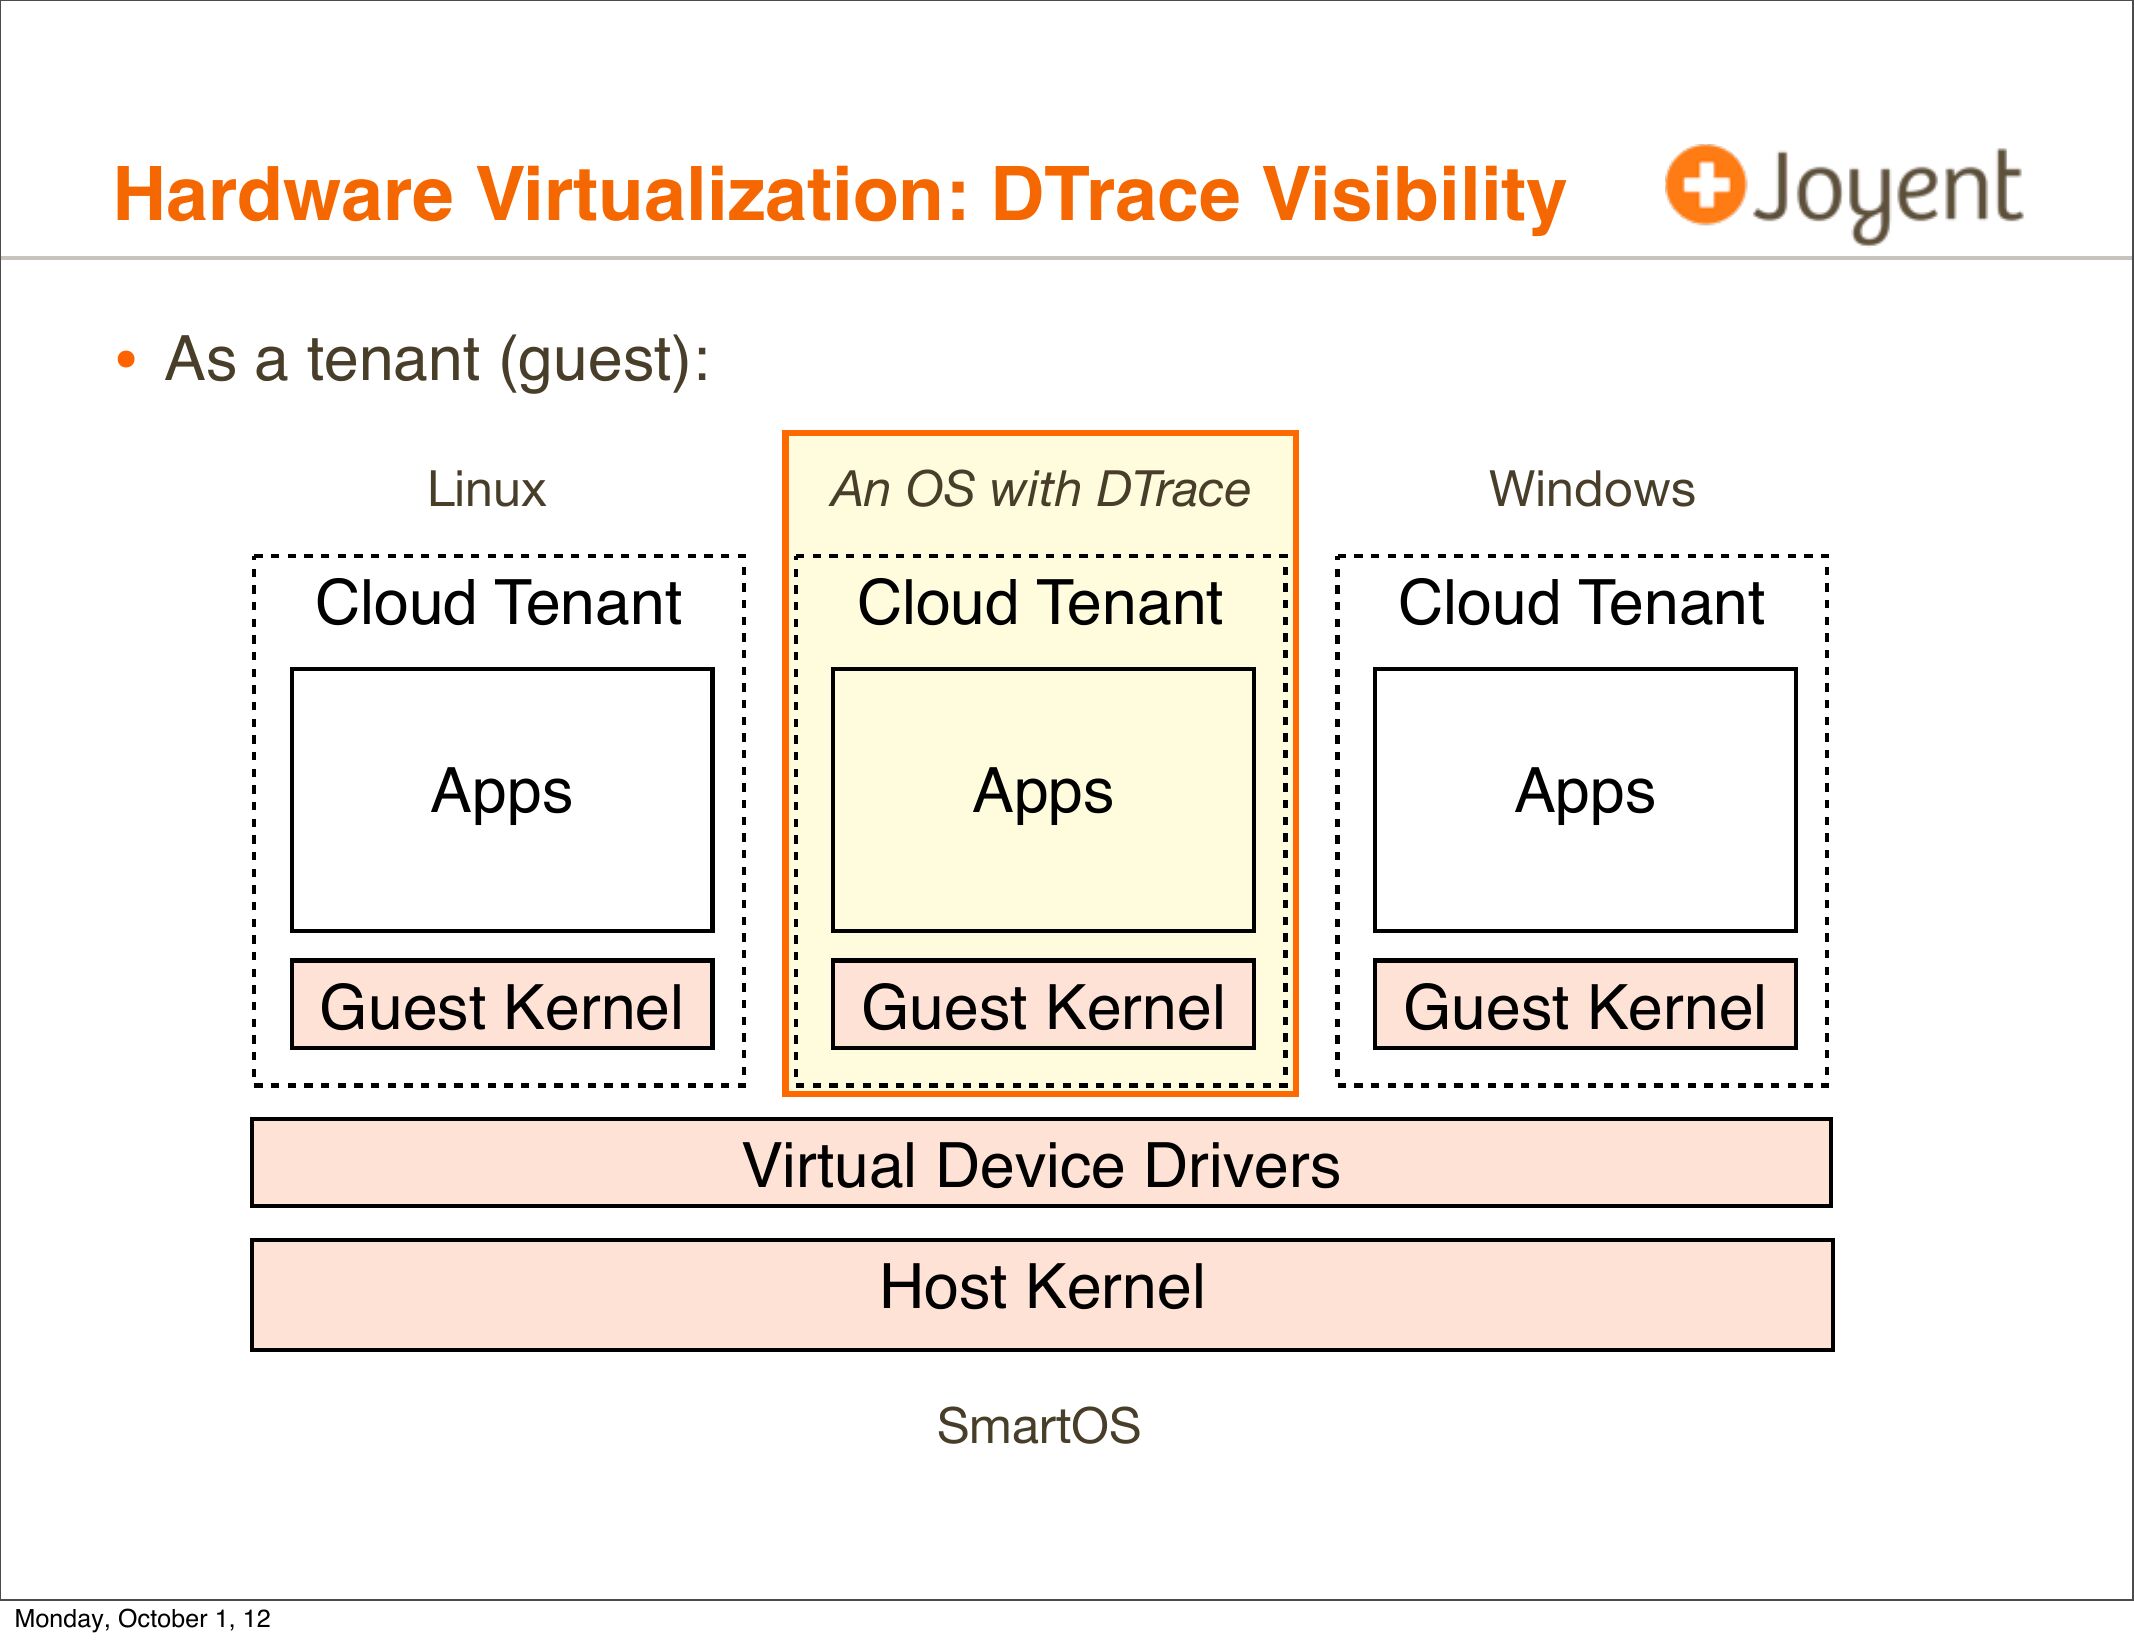
• As a tenant (guest):
Linux
An OS with DTrace
Windows
Cloud Tenant
Cloud Tenant
Cloud Tenant
Apps
Apps
Apps
Guest Kernel
Guest Kernel
Guest Kernel
Virtual Device Drivers
Host Kernel
SmartOS
Monday, October 1, 12
slide 16:
Hardware Virtualization: DTrace Visibility
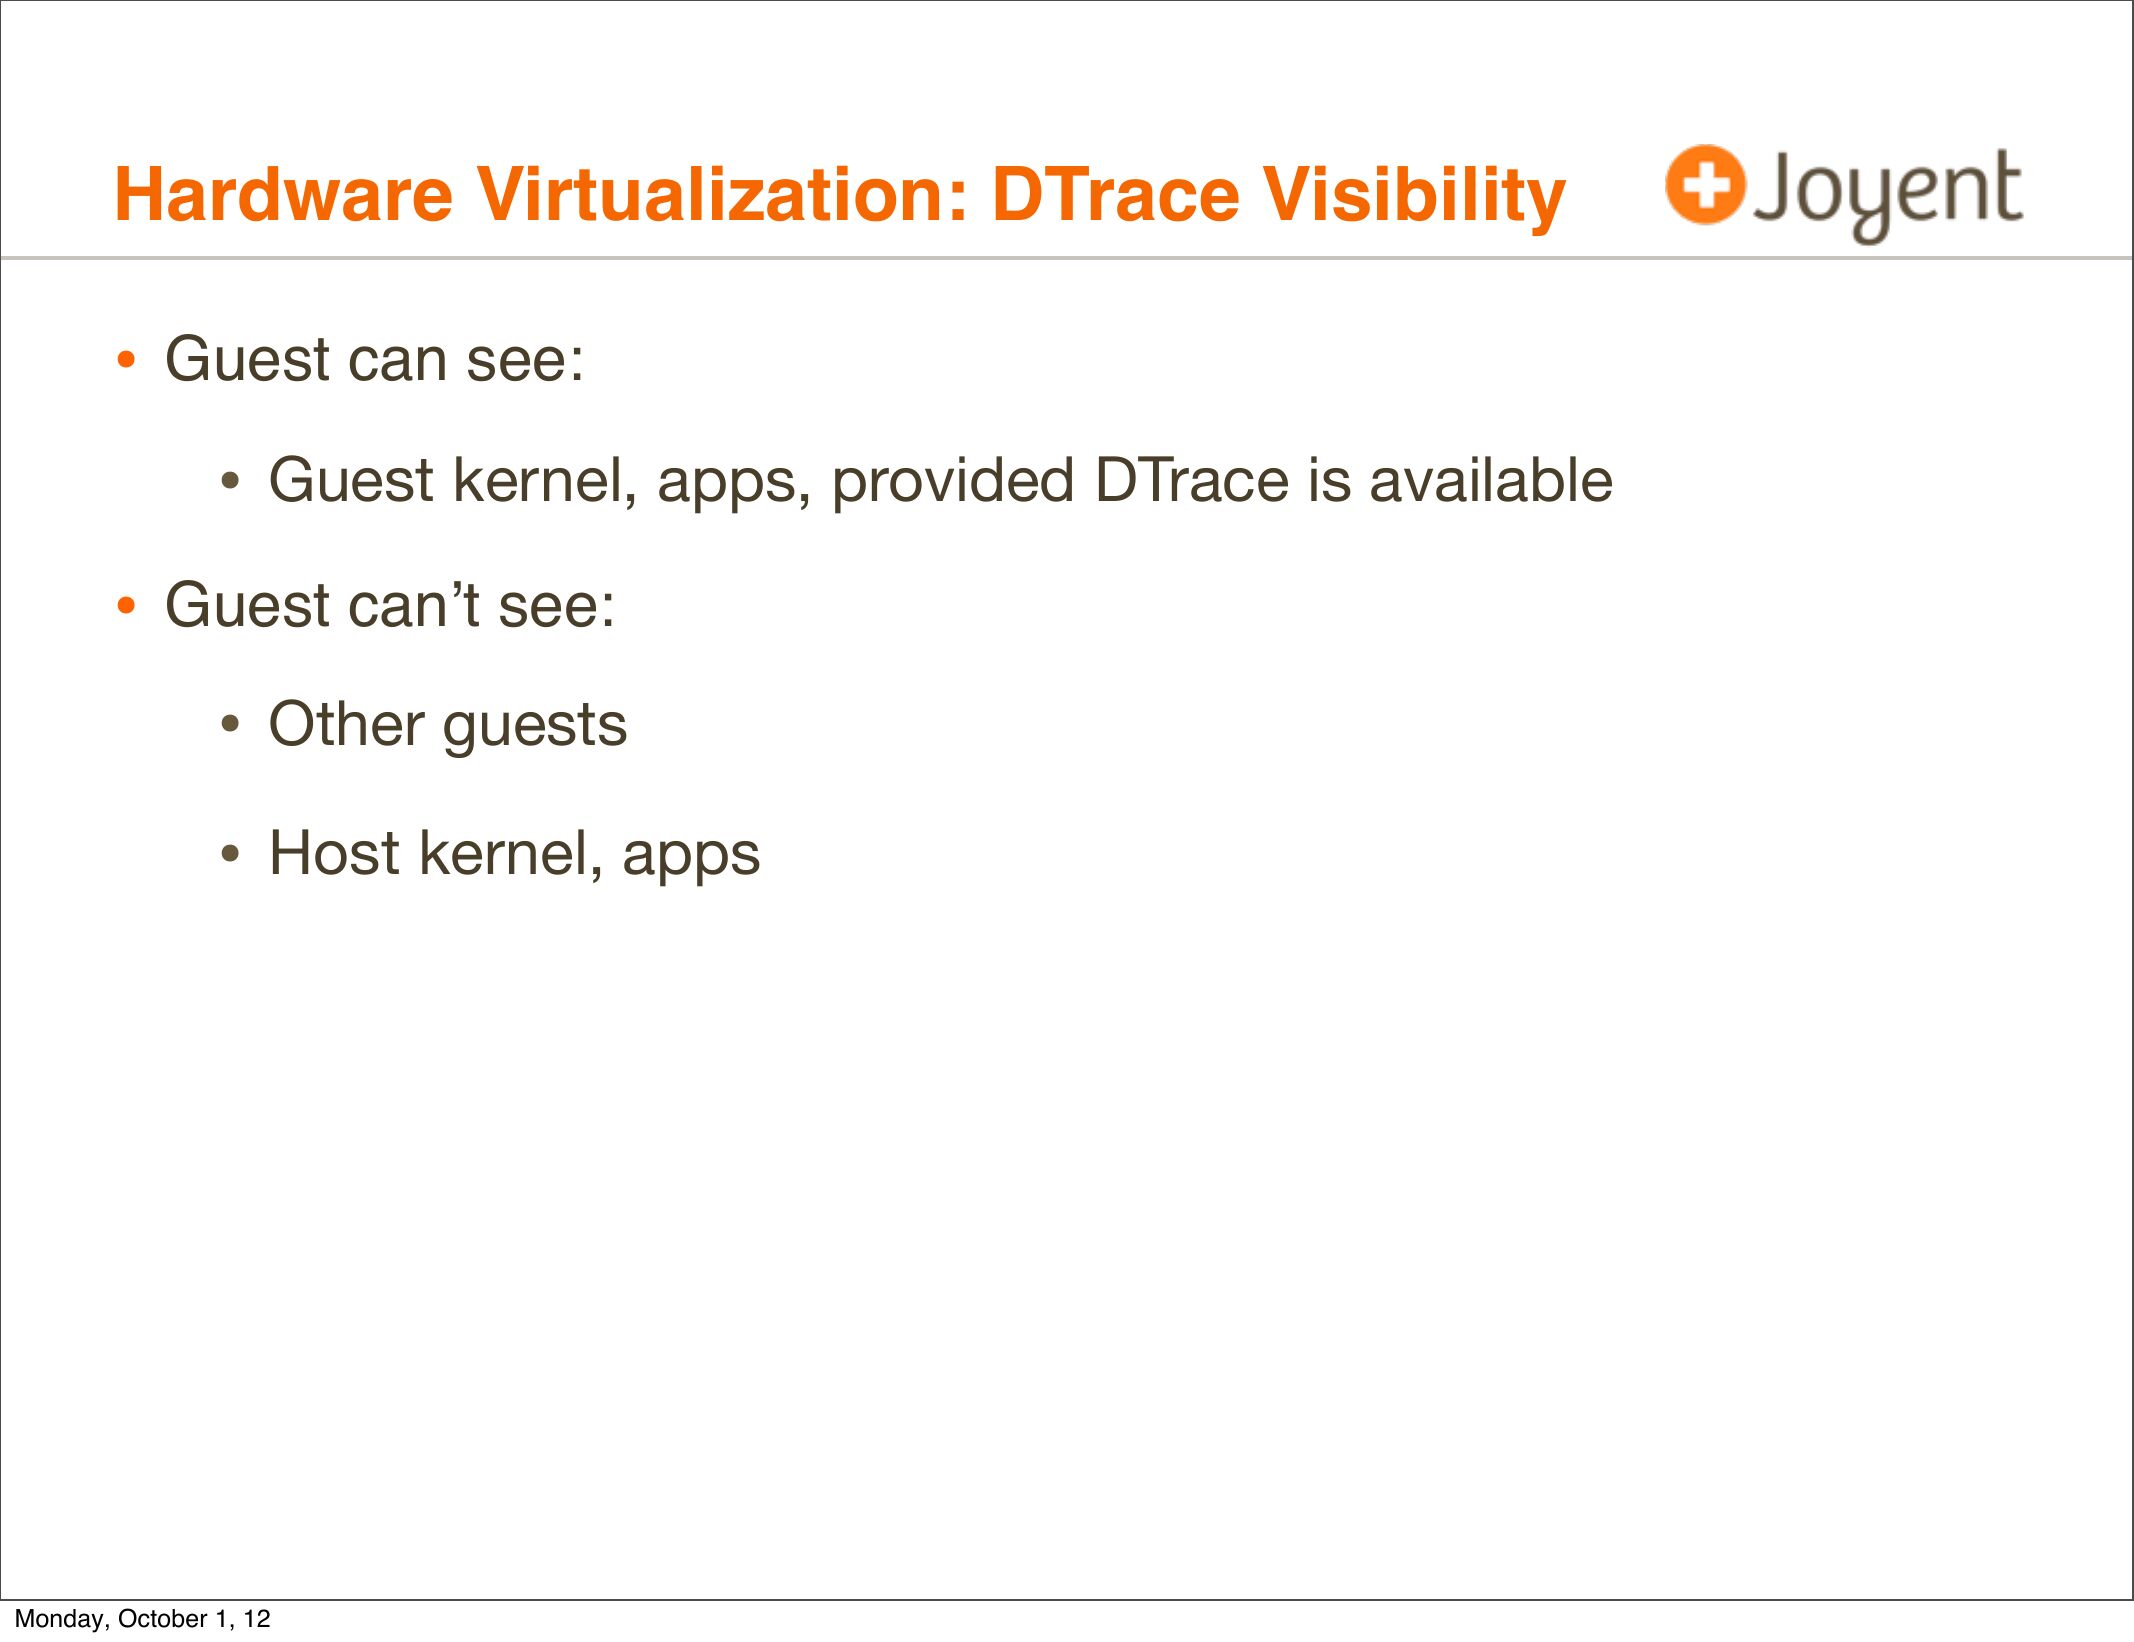
• Guest can see:
• Guest kernel, apps, provided DTrace is available
• Guest can’t see:
• Other guests
• Host kernel, apps
Monday, October 1, 12
slide 17:
OS Virtualization: DTrace Visibility
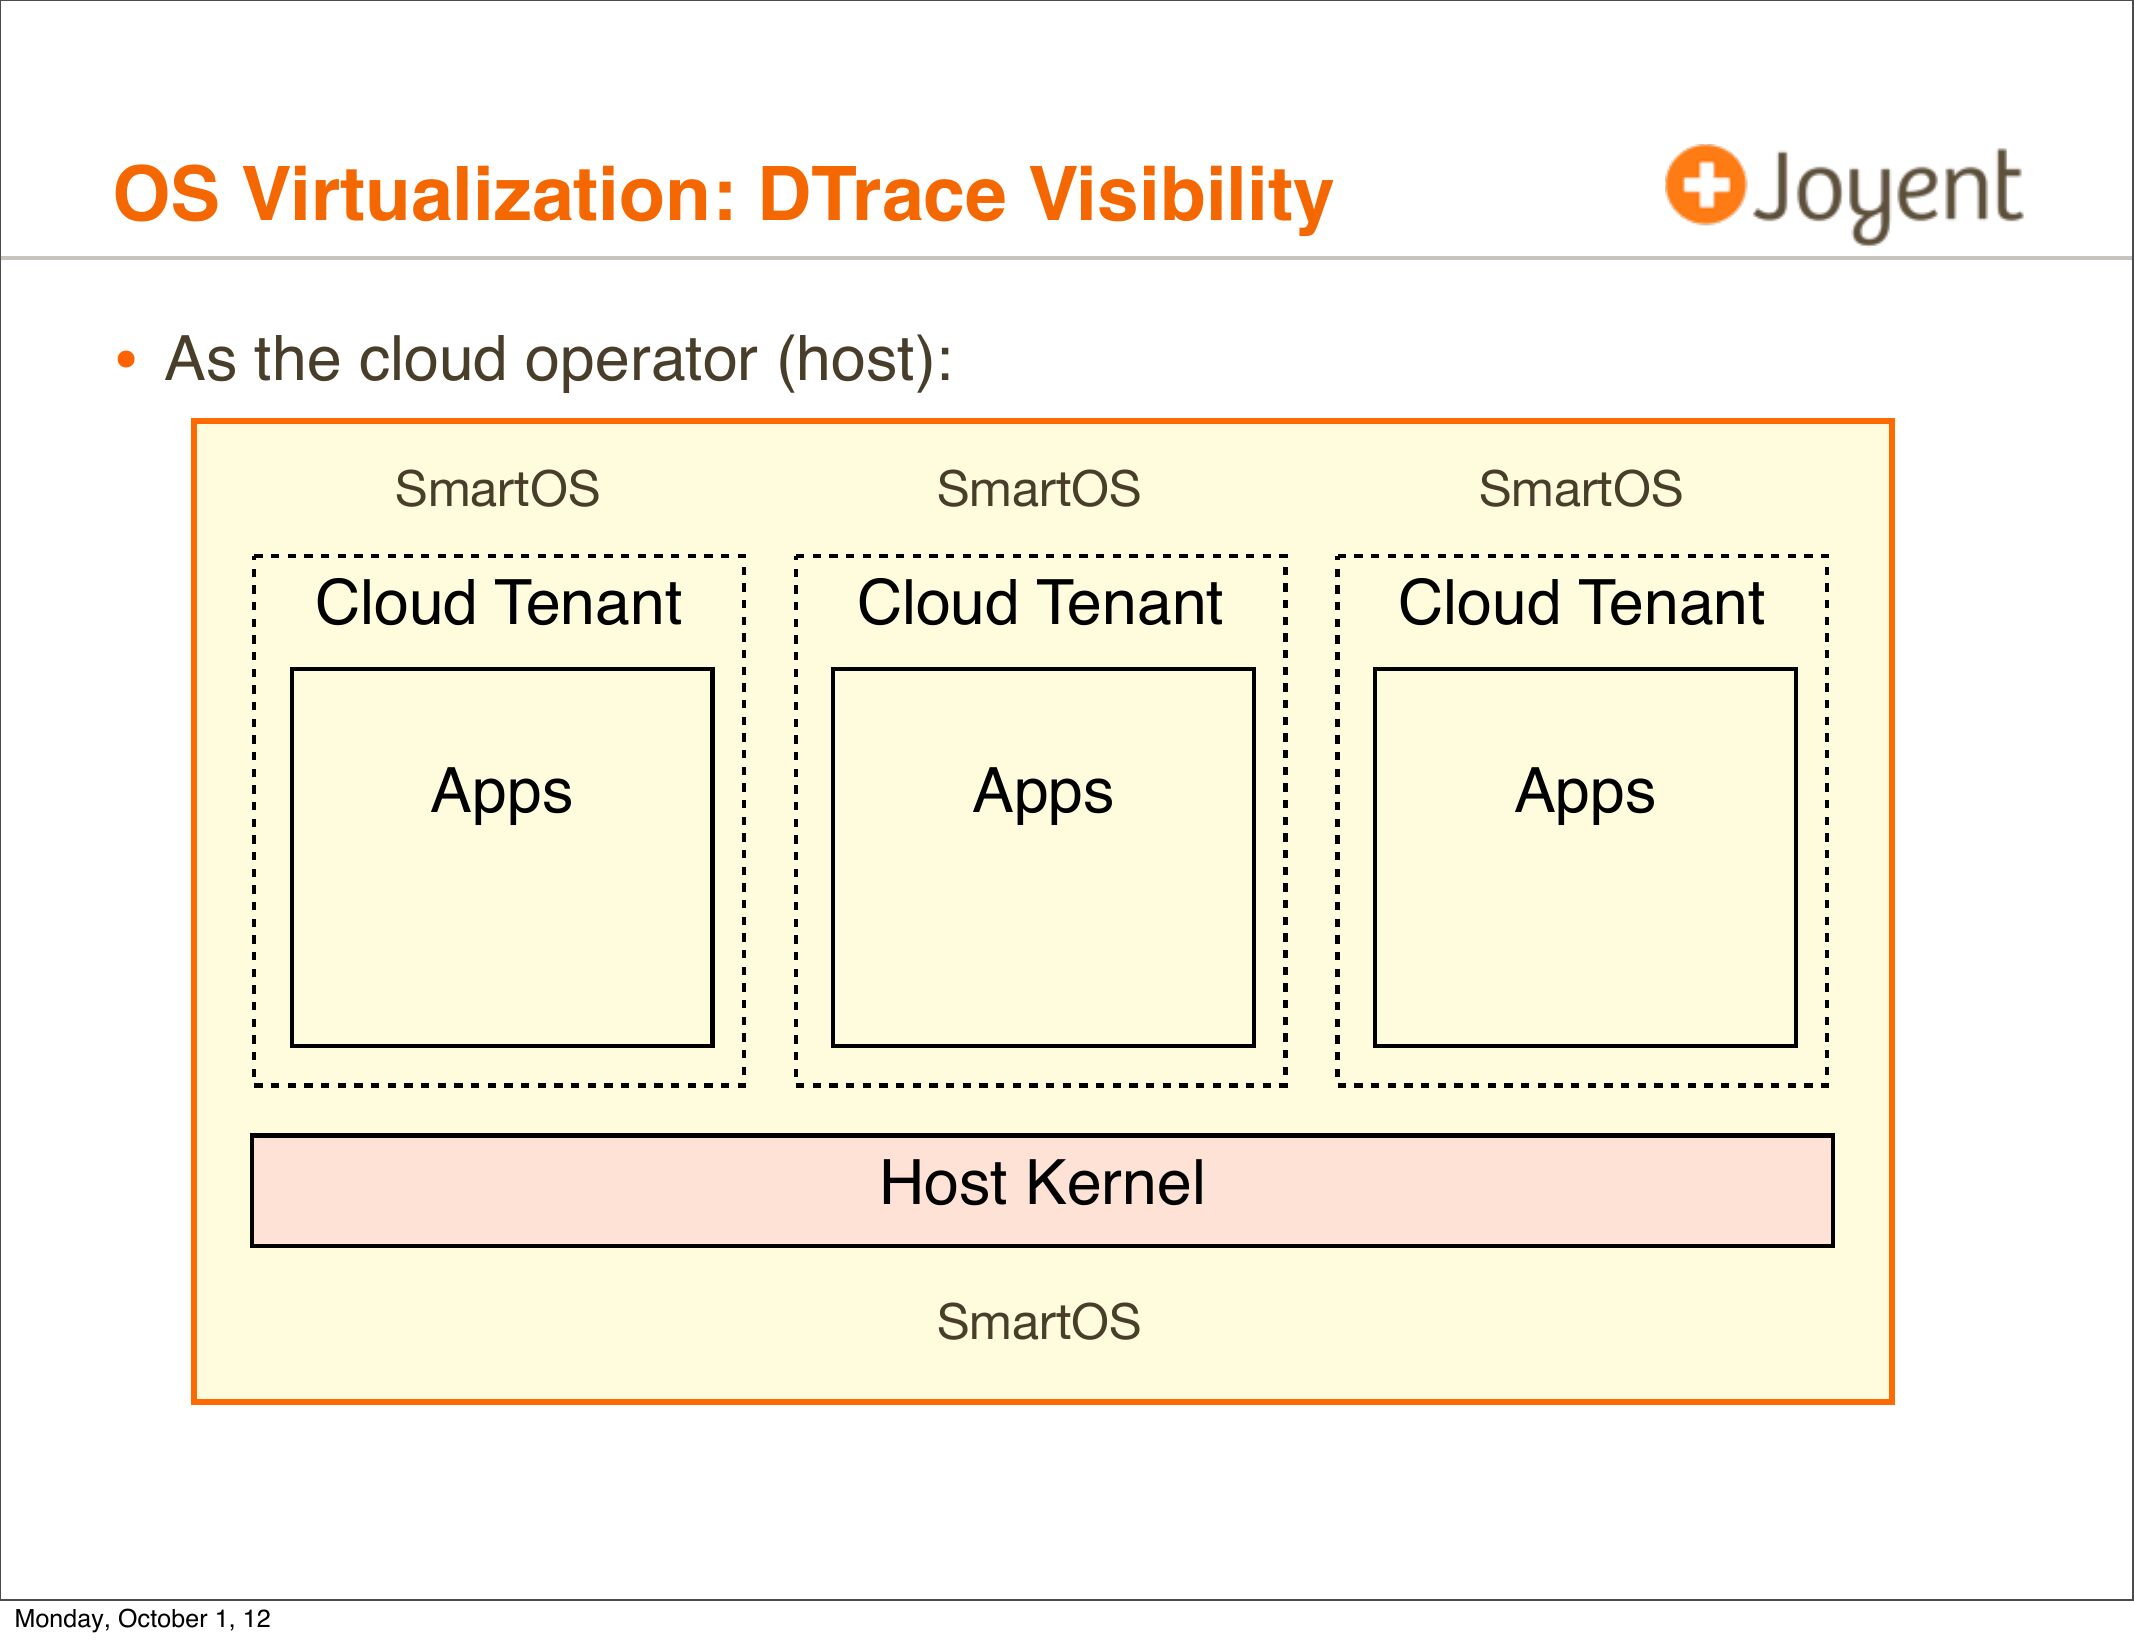
• As the cloud operator (host):
SmartOS
SmartOS
SmartOS
Cloud Tenant
Cloud Tenant
Cloud Tenant
Apps
Apps
Apps
Host Kernel
SmartOS
Monday, October 1, 12
slide 18:
OS Virtualization: DTrace Visibility
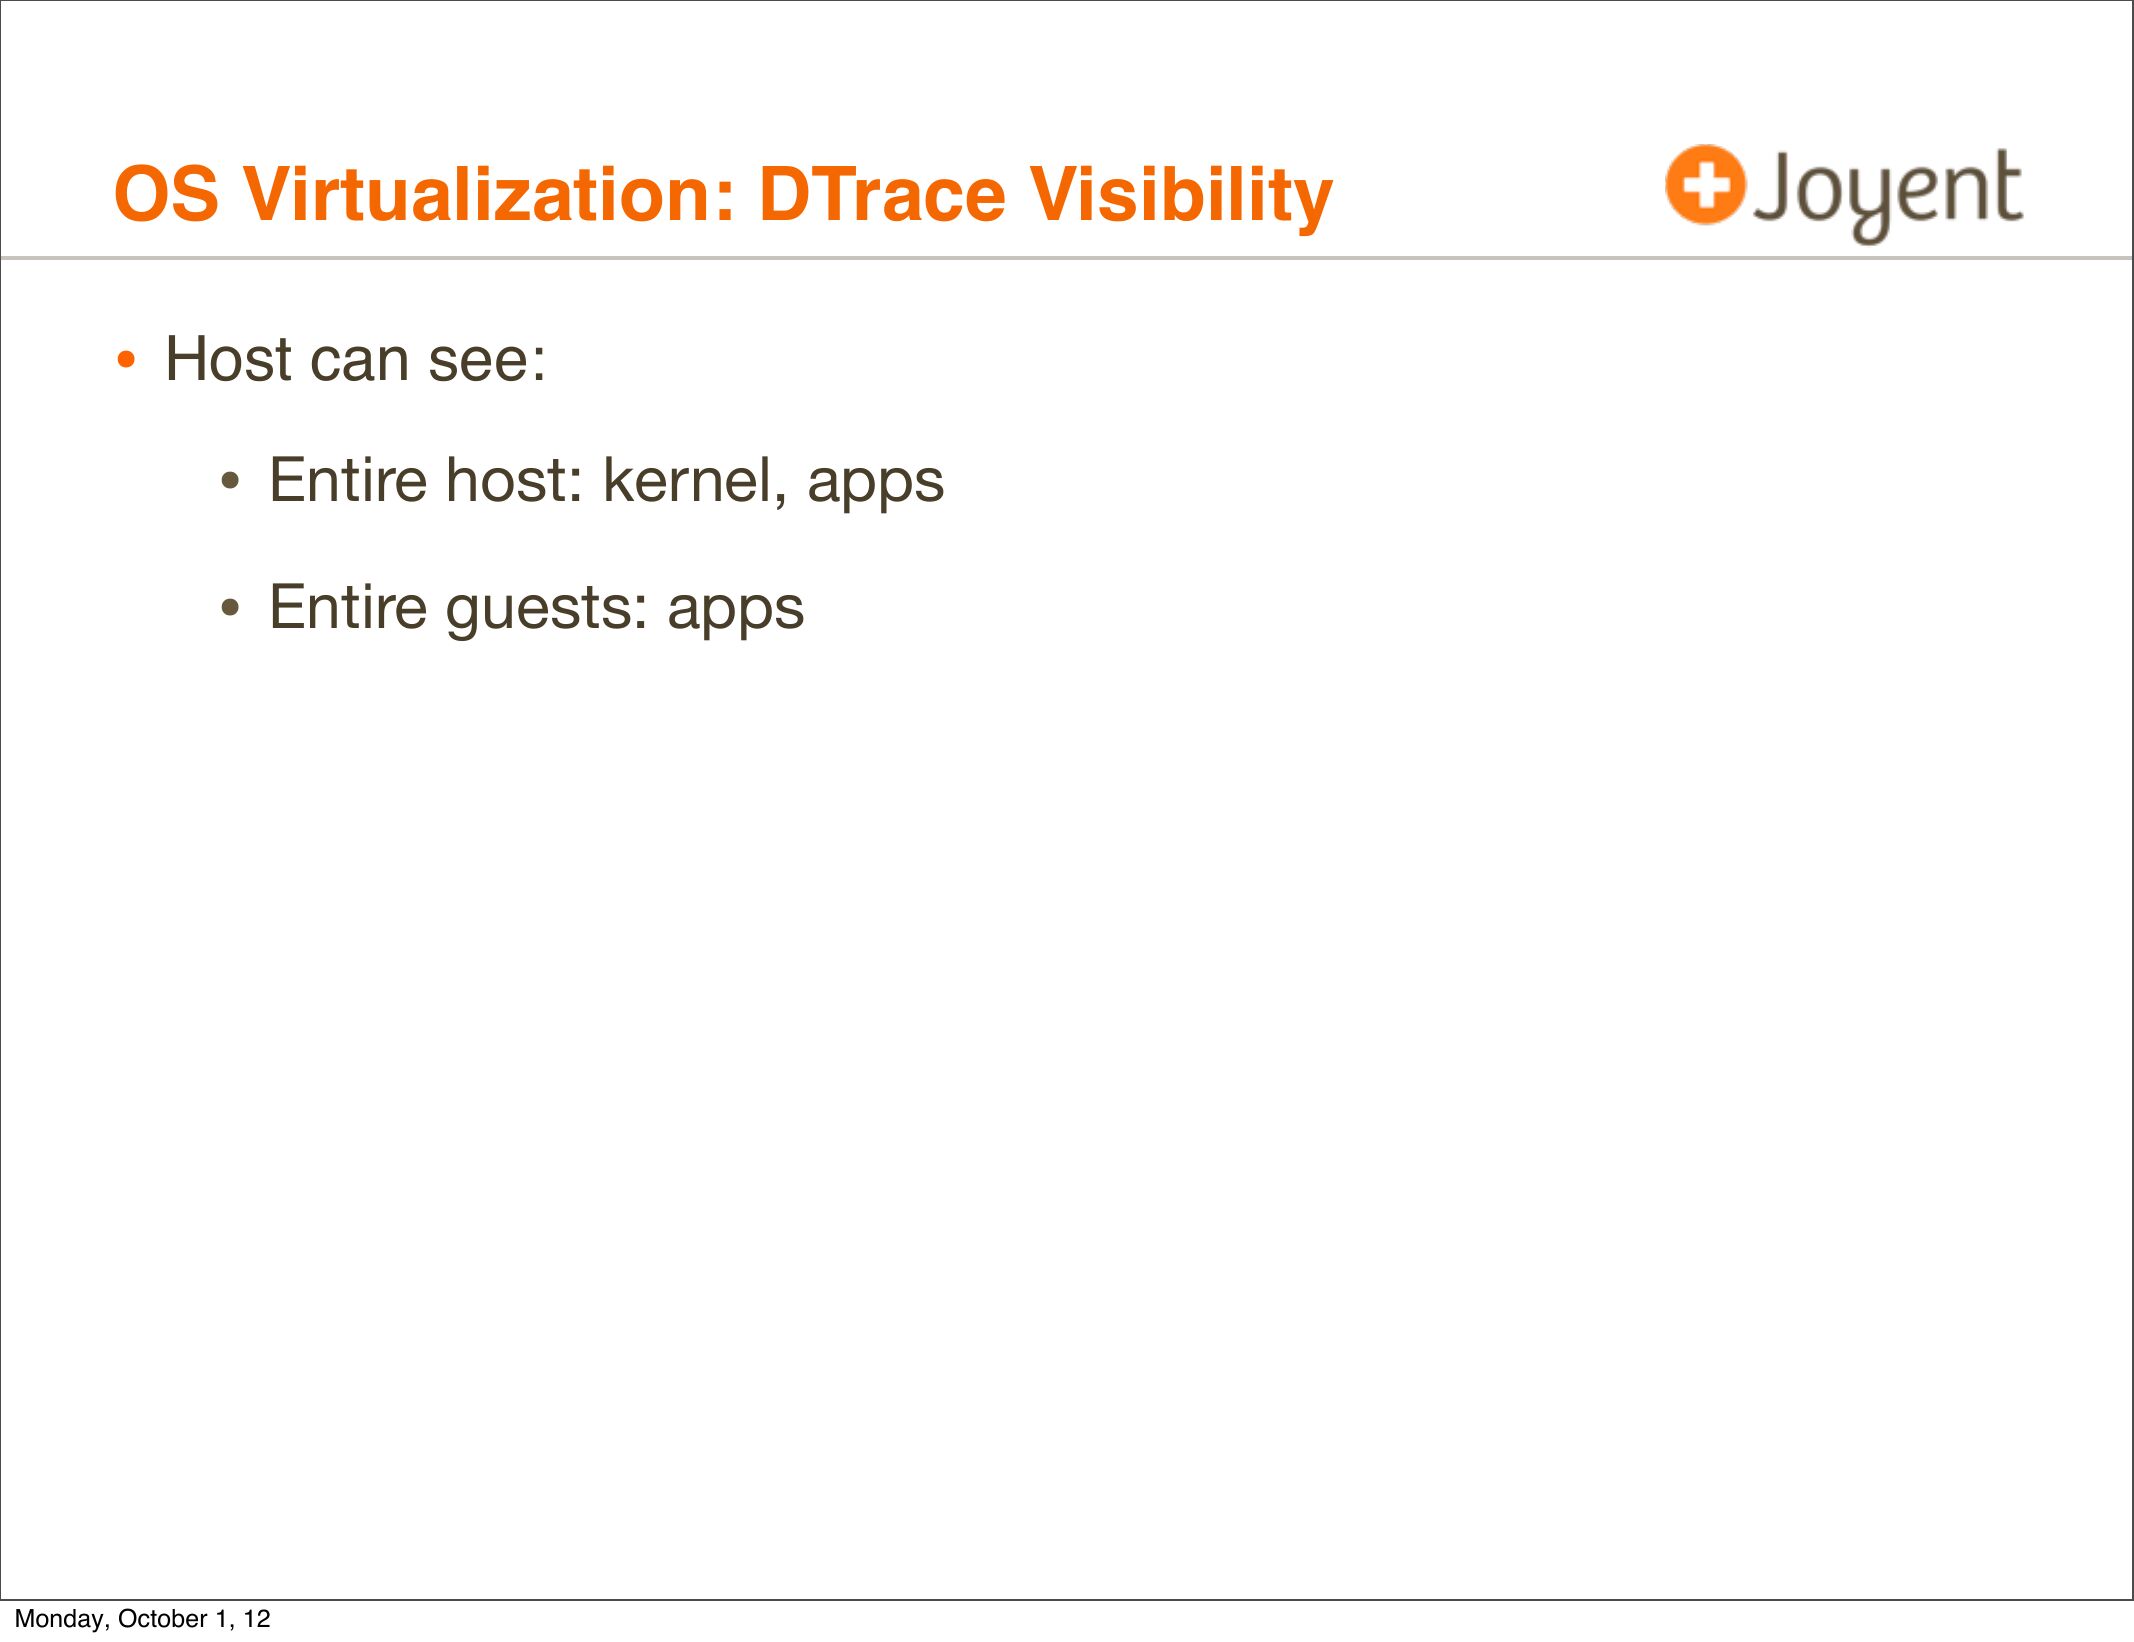
• Host can see:
• Entire host: kernel, apps
• Entire guests: apps
Monday, October 1, 12
slide 19:
OS Virtualization: DTrace Visibility
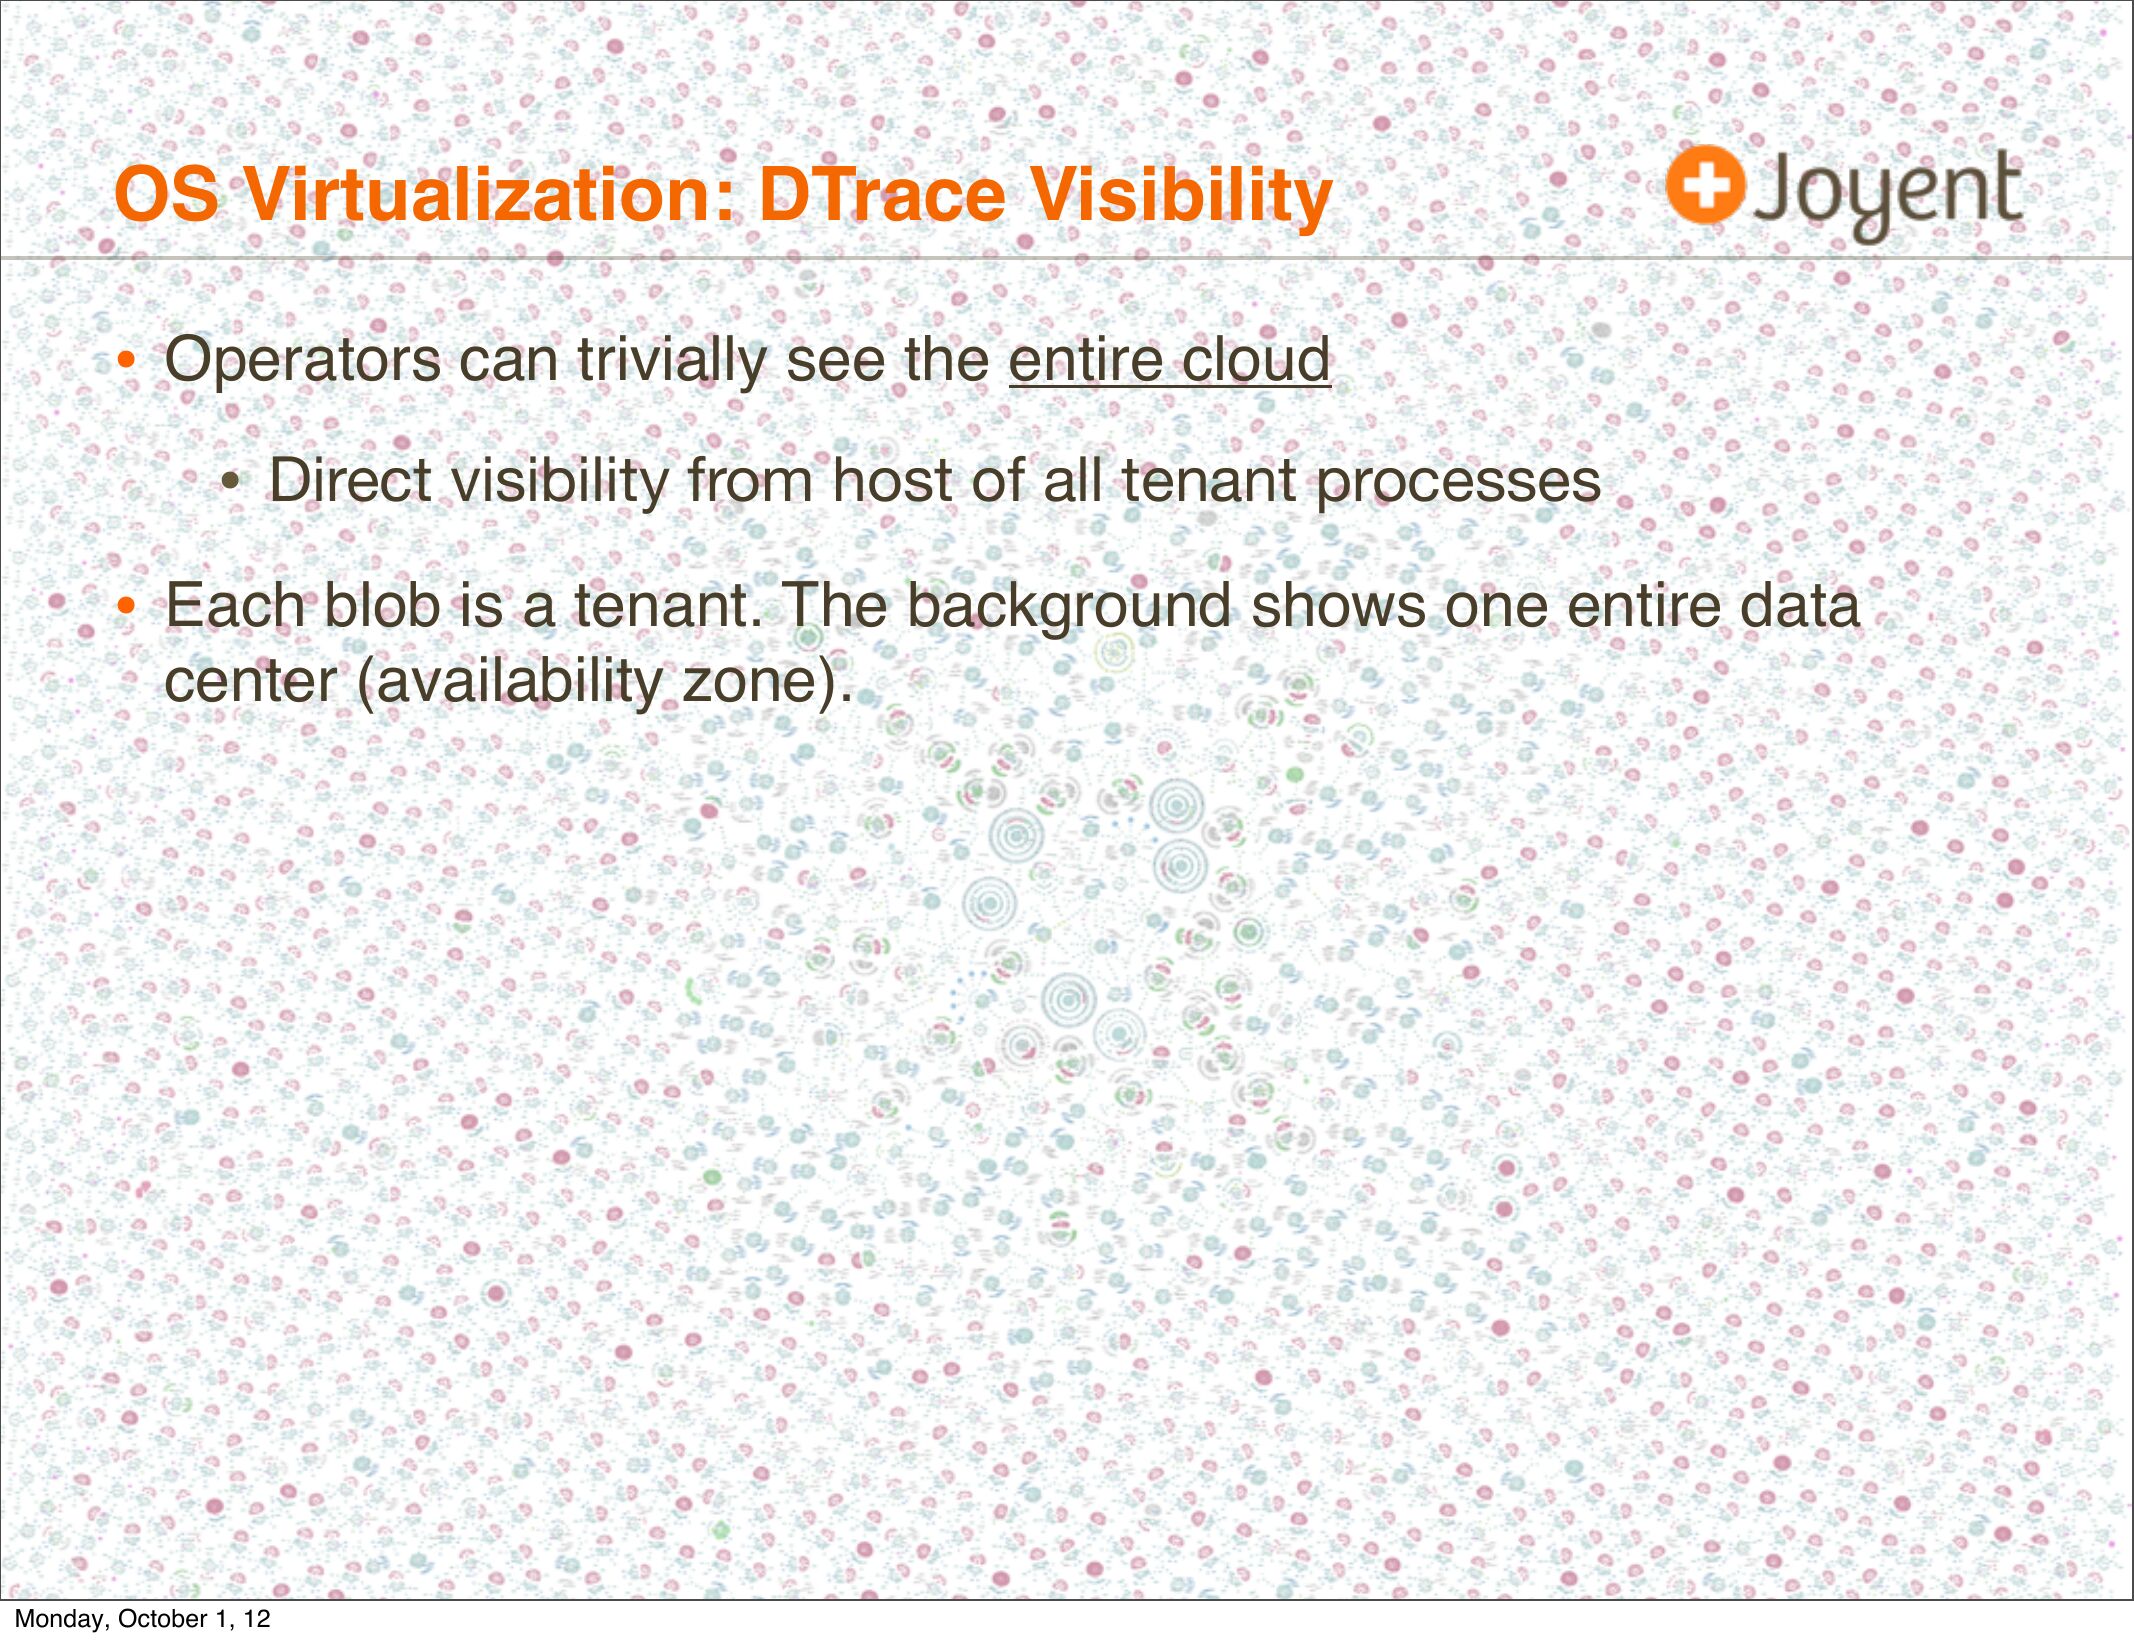
• Operators can trivially see the entire cloud
• Direct visibility from host of all tenant processes
• Each blob is a tenant. The background shows one entire data
center (availability zone).
Monday, October 1, 12
slide 20:
OS Virtualization: DTrace Visibility
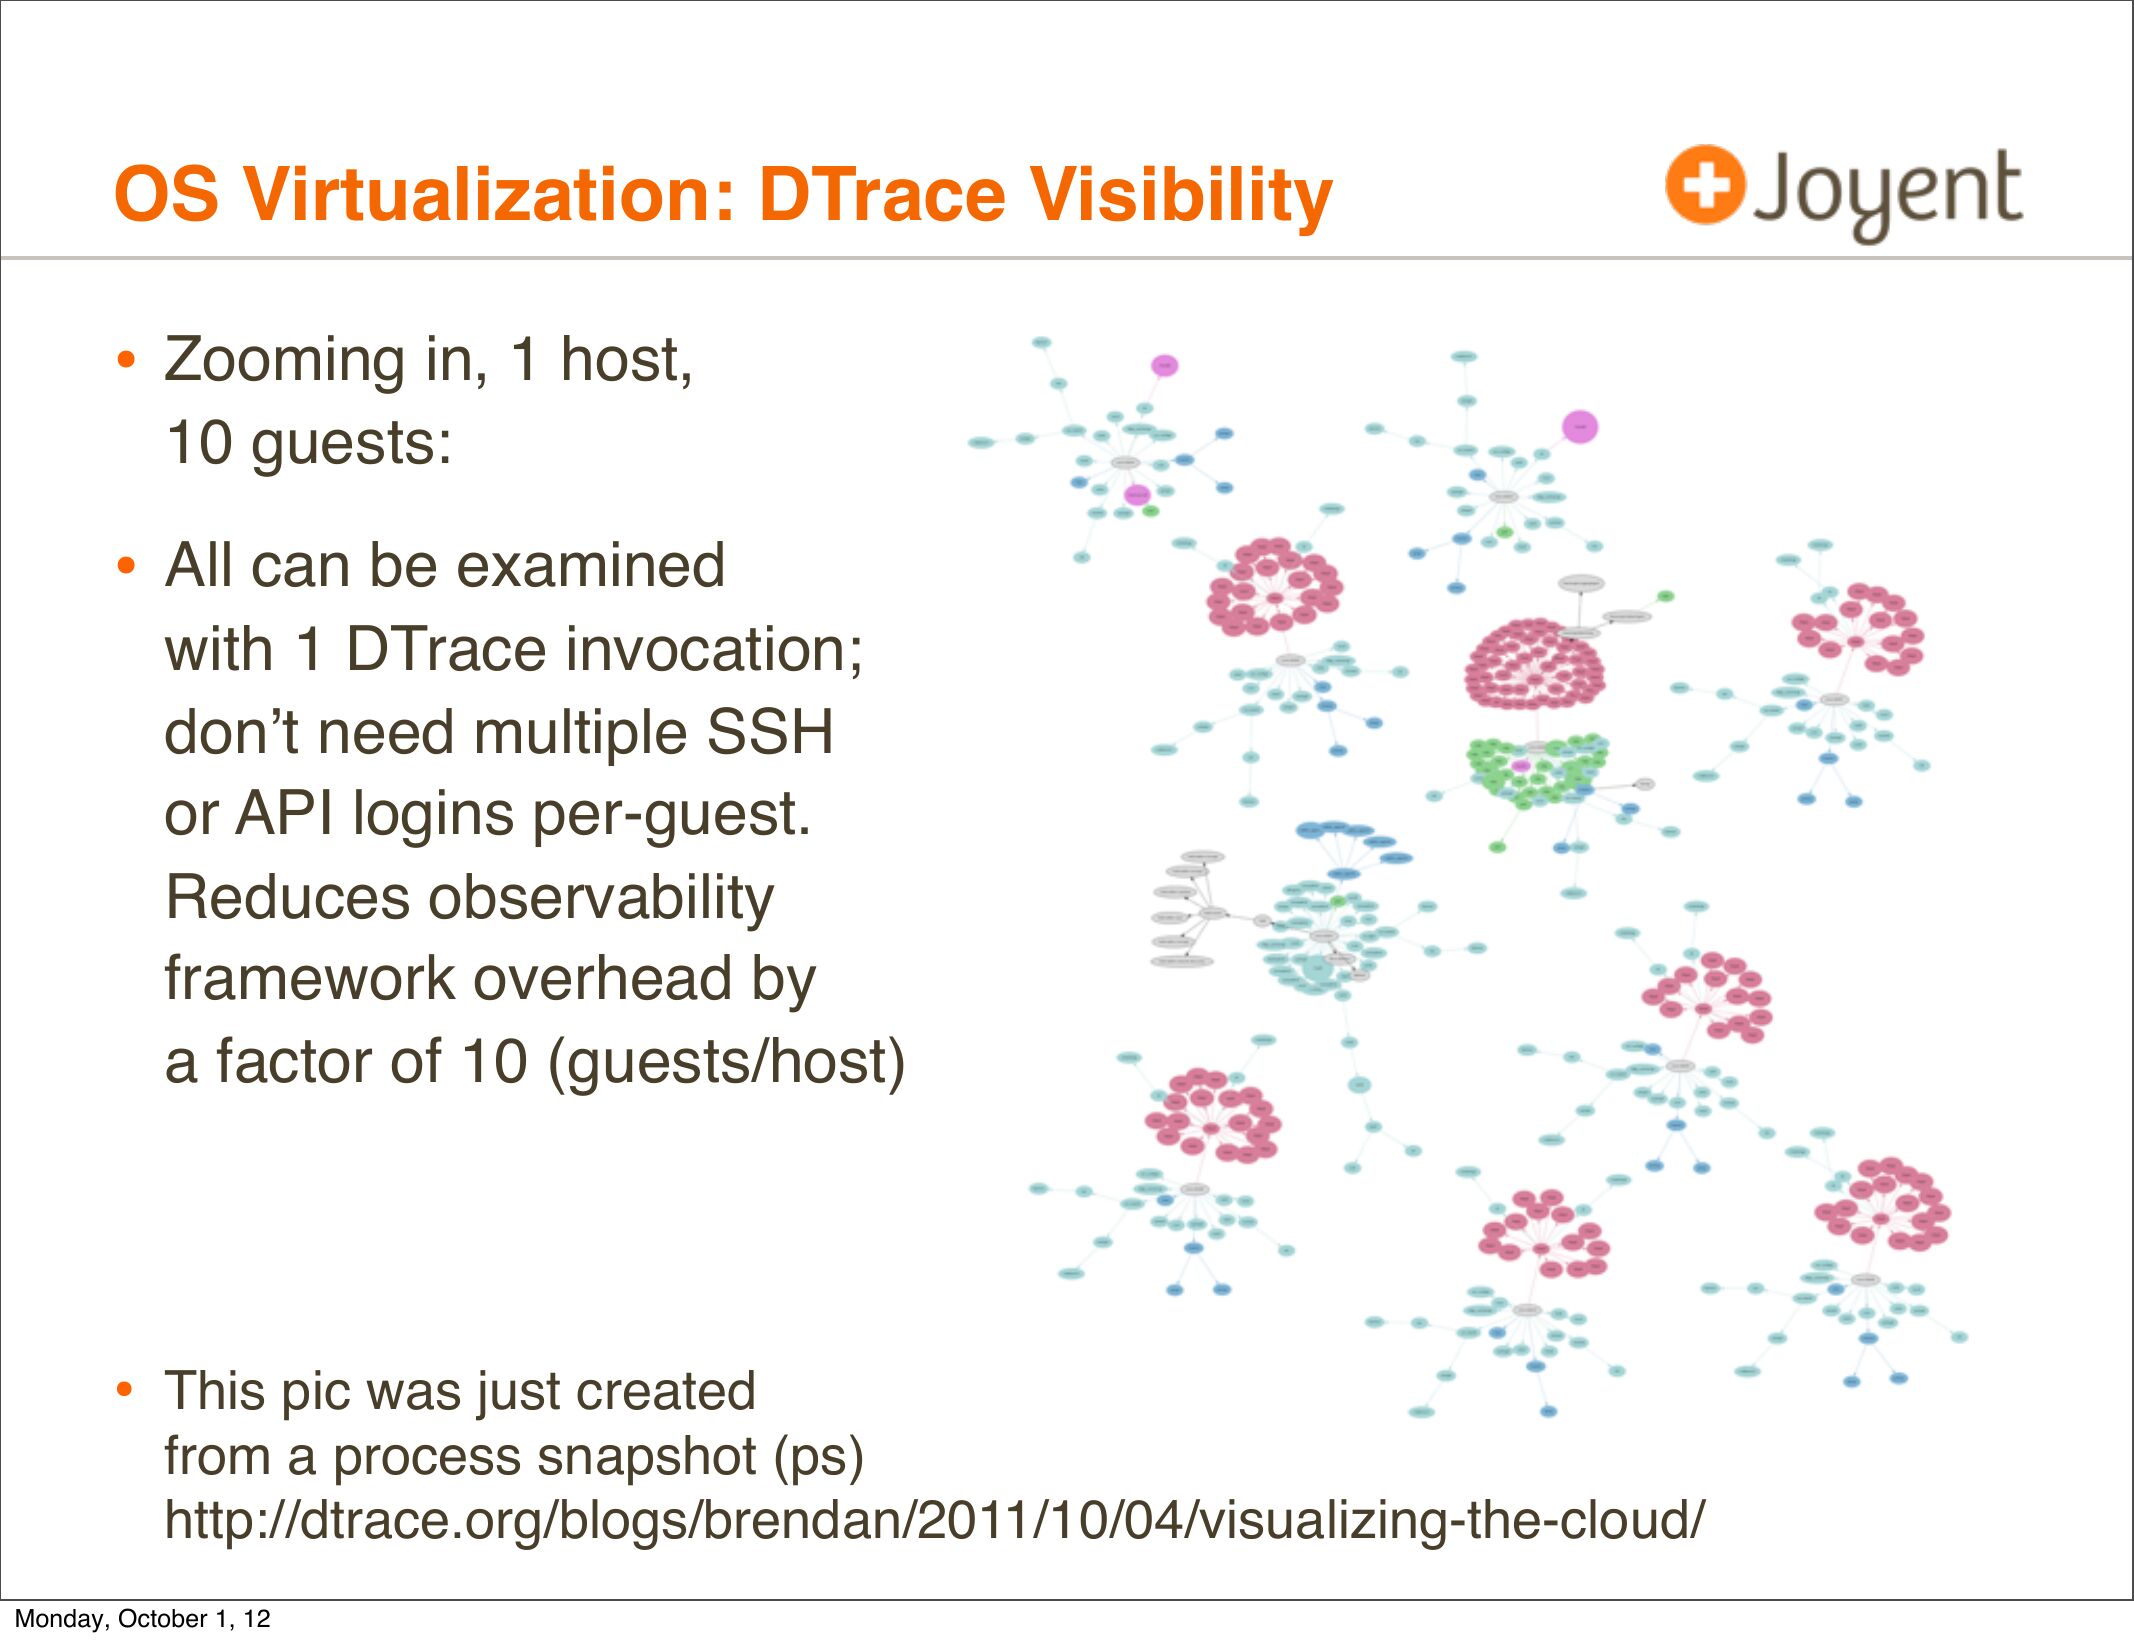
• Zooming in, 1 host,
10 guests:
• All can be examined
with 1 DTrace invocation;
don’t need multiple SSH
or API logins per-guest.
Reduces observability
framework overhead by
a factor of 10 (guests/host)
• This pic was just created
from a process snapshot (ps)
http://dtrace.org/blogs/brendan/2011/10/04/visualizing-the-cloud/
Monday, October 1, 12
slide 21:
OS Virtualization: DTrace Visibility
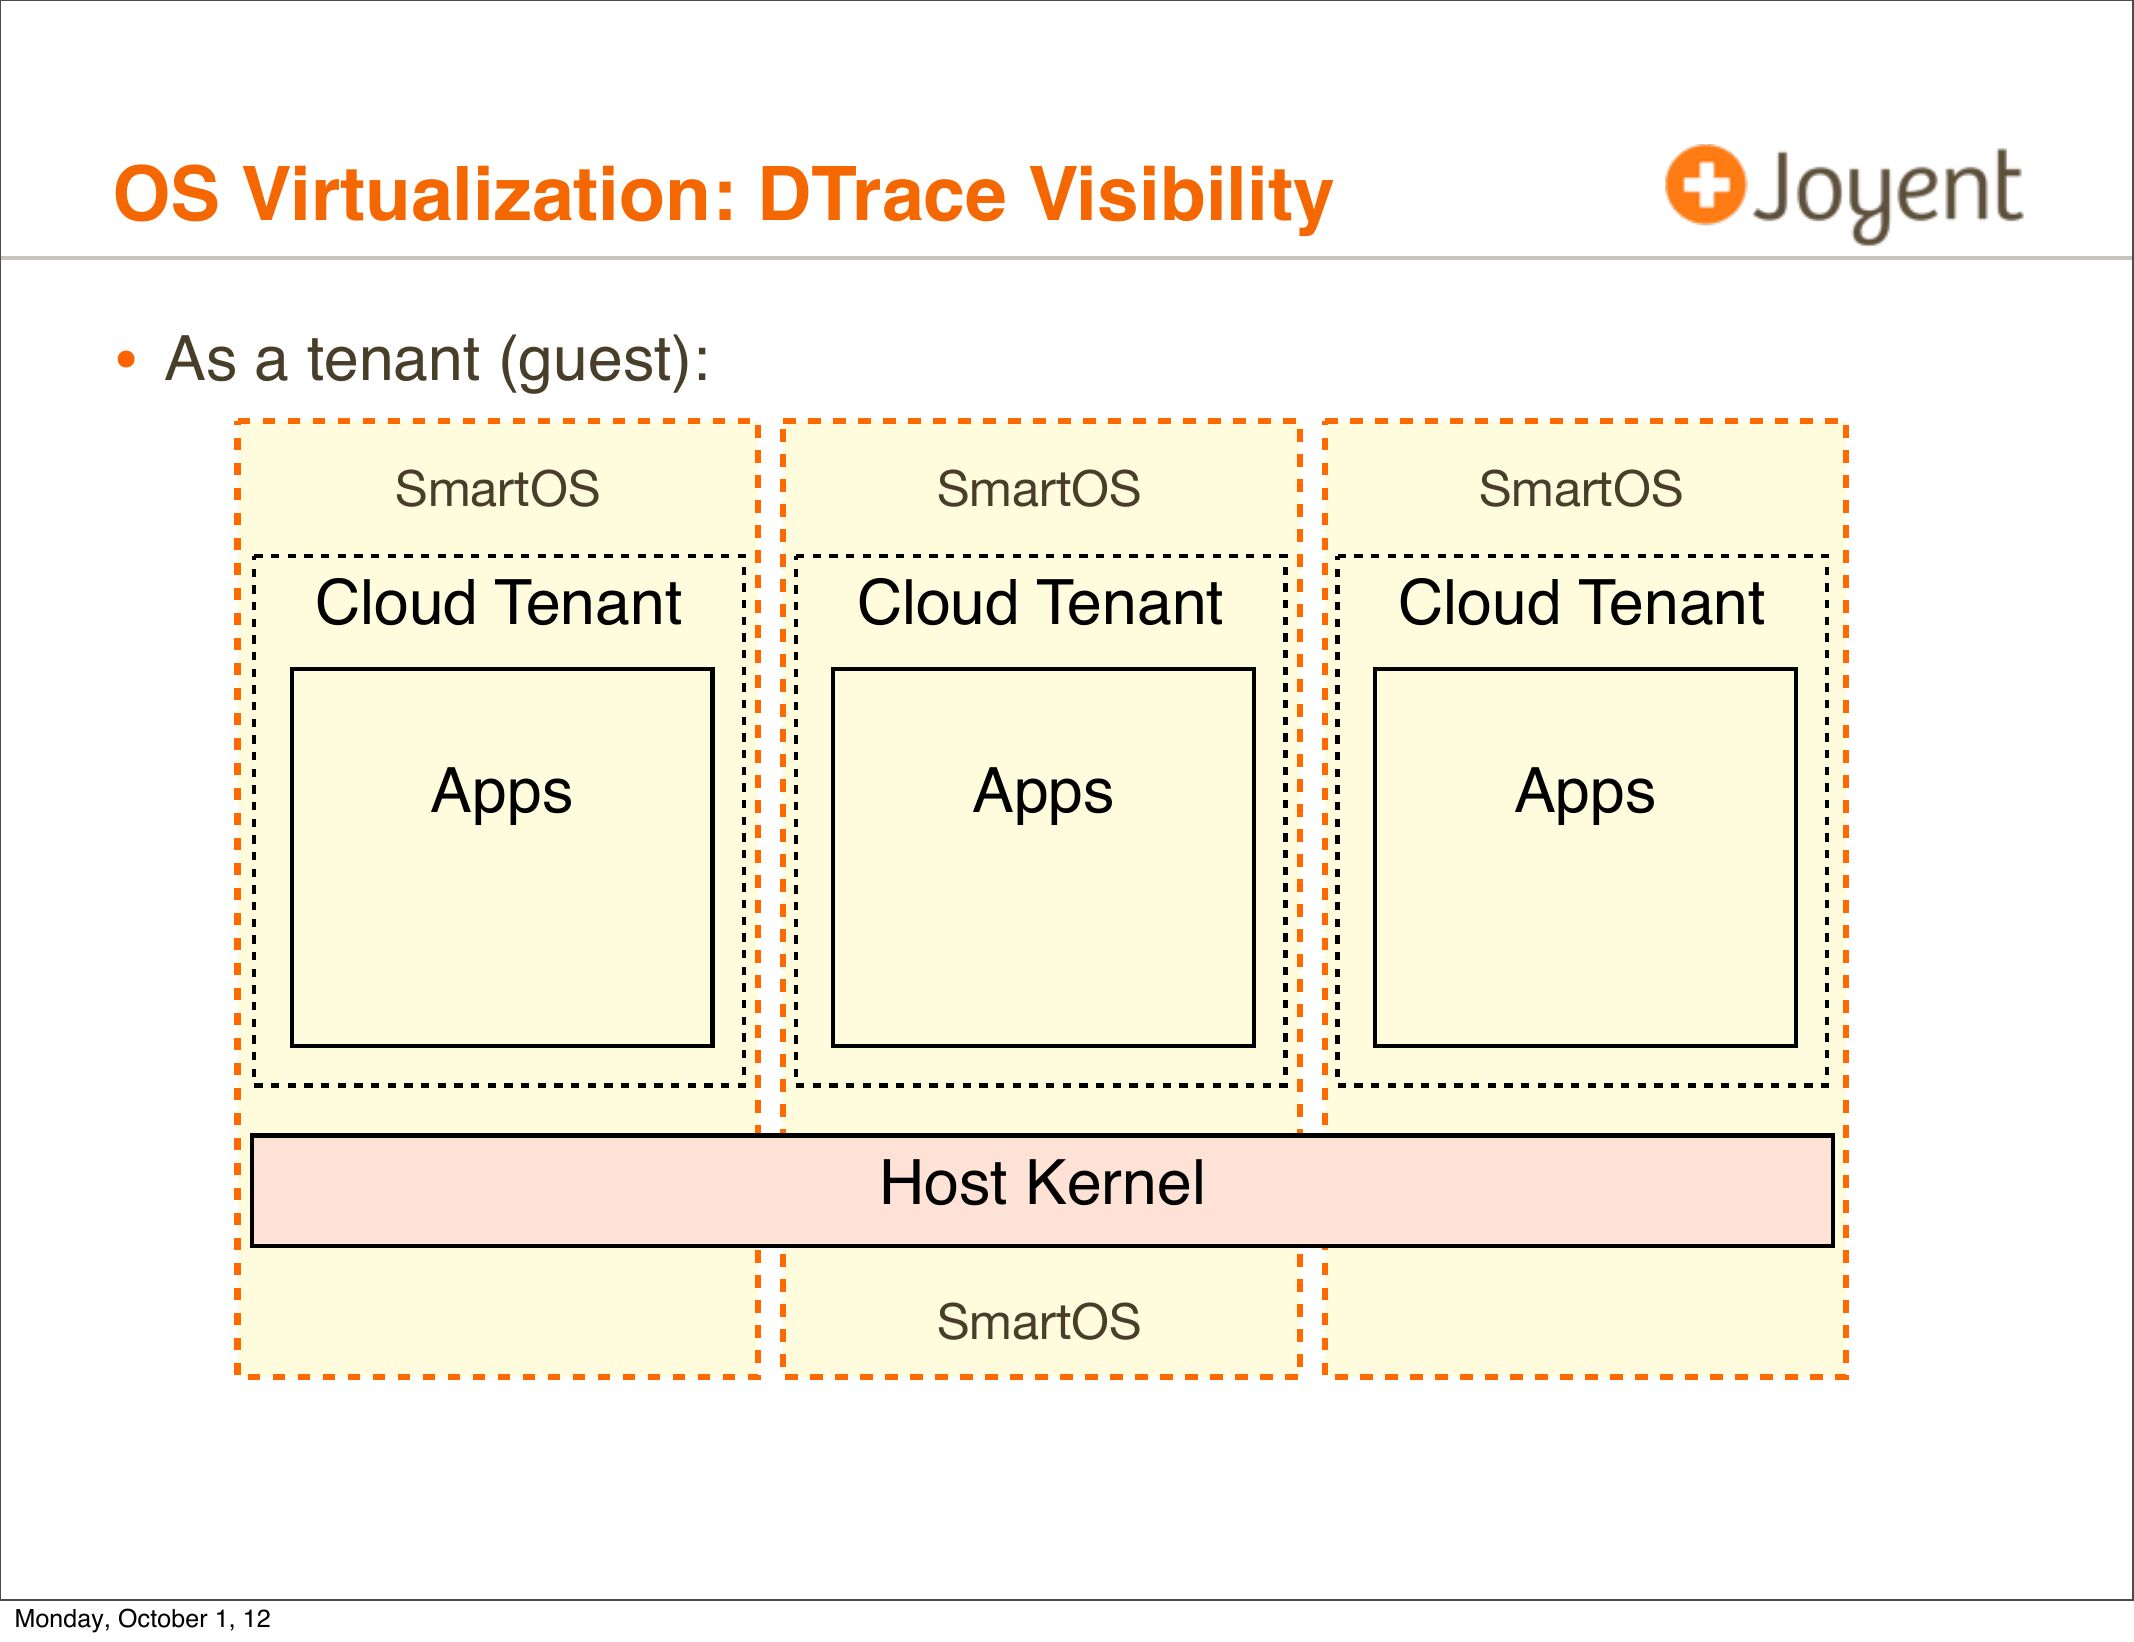
• As a tenant (guest):
SmartOS
SmartOS
SmartOS
Cloud Tenant
Cloud Tenant
Cloud Tenant
Apps
Apps
Apps
Host Kernel
SmartOS
Monday, October 1, 12
slide 22:
OS Virtualization: DTrace Visibility
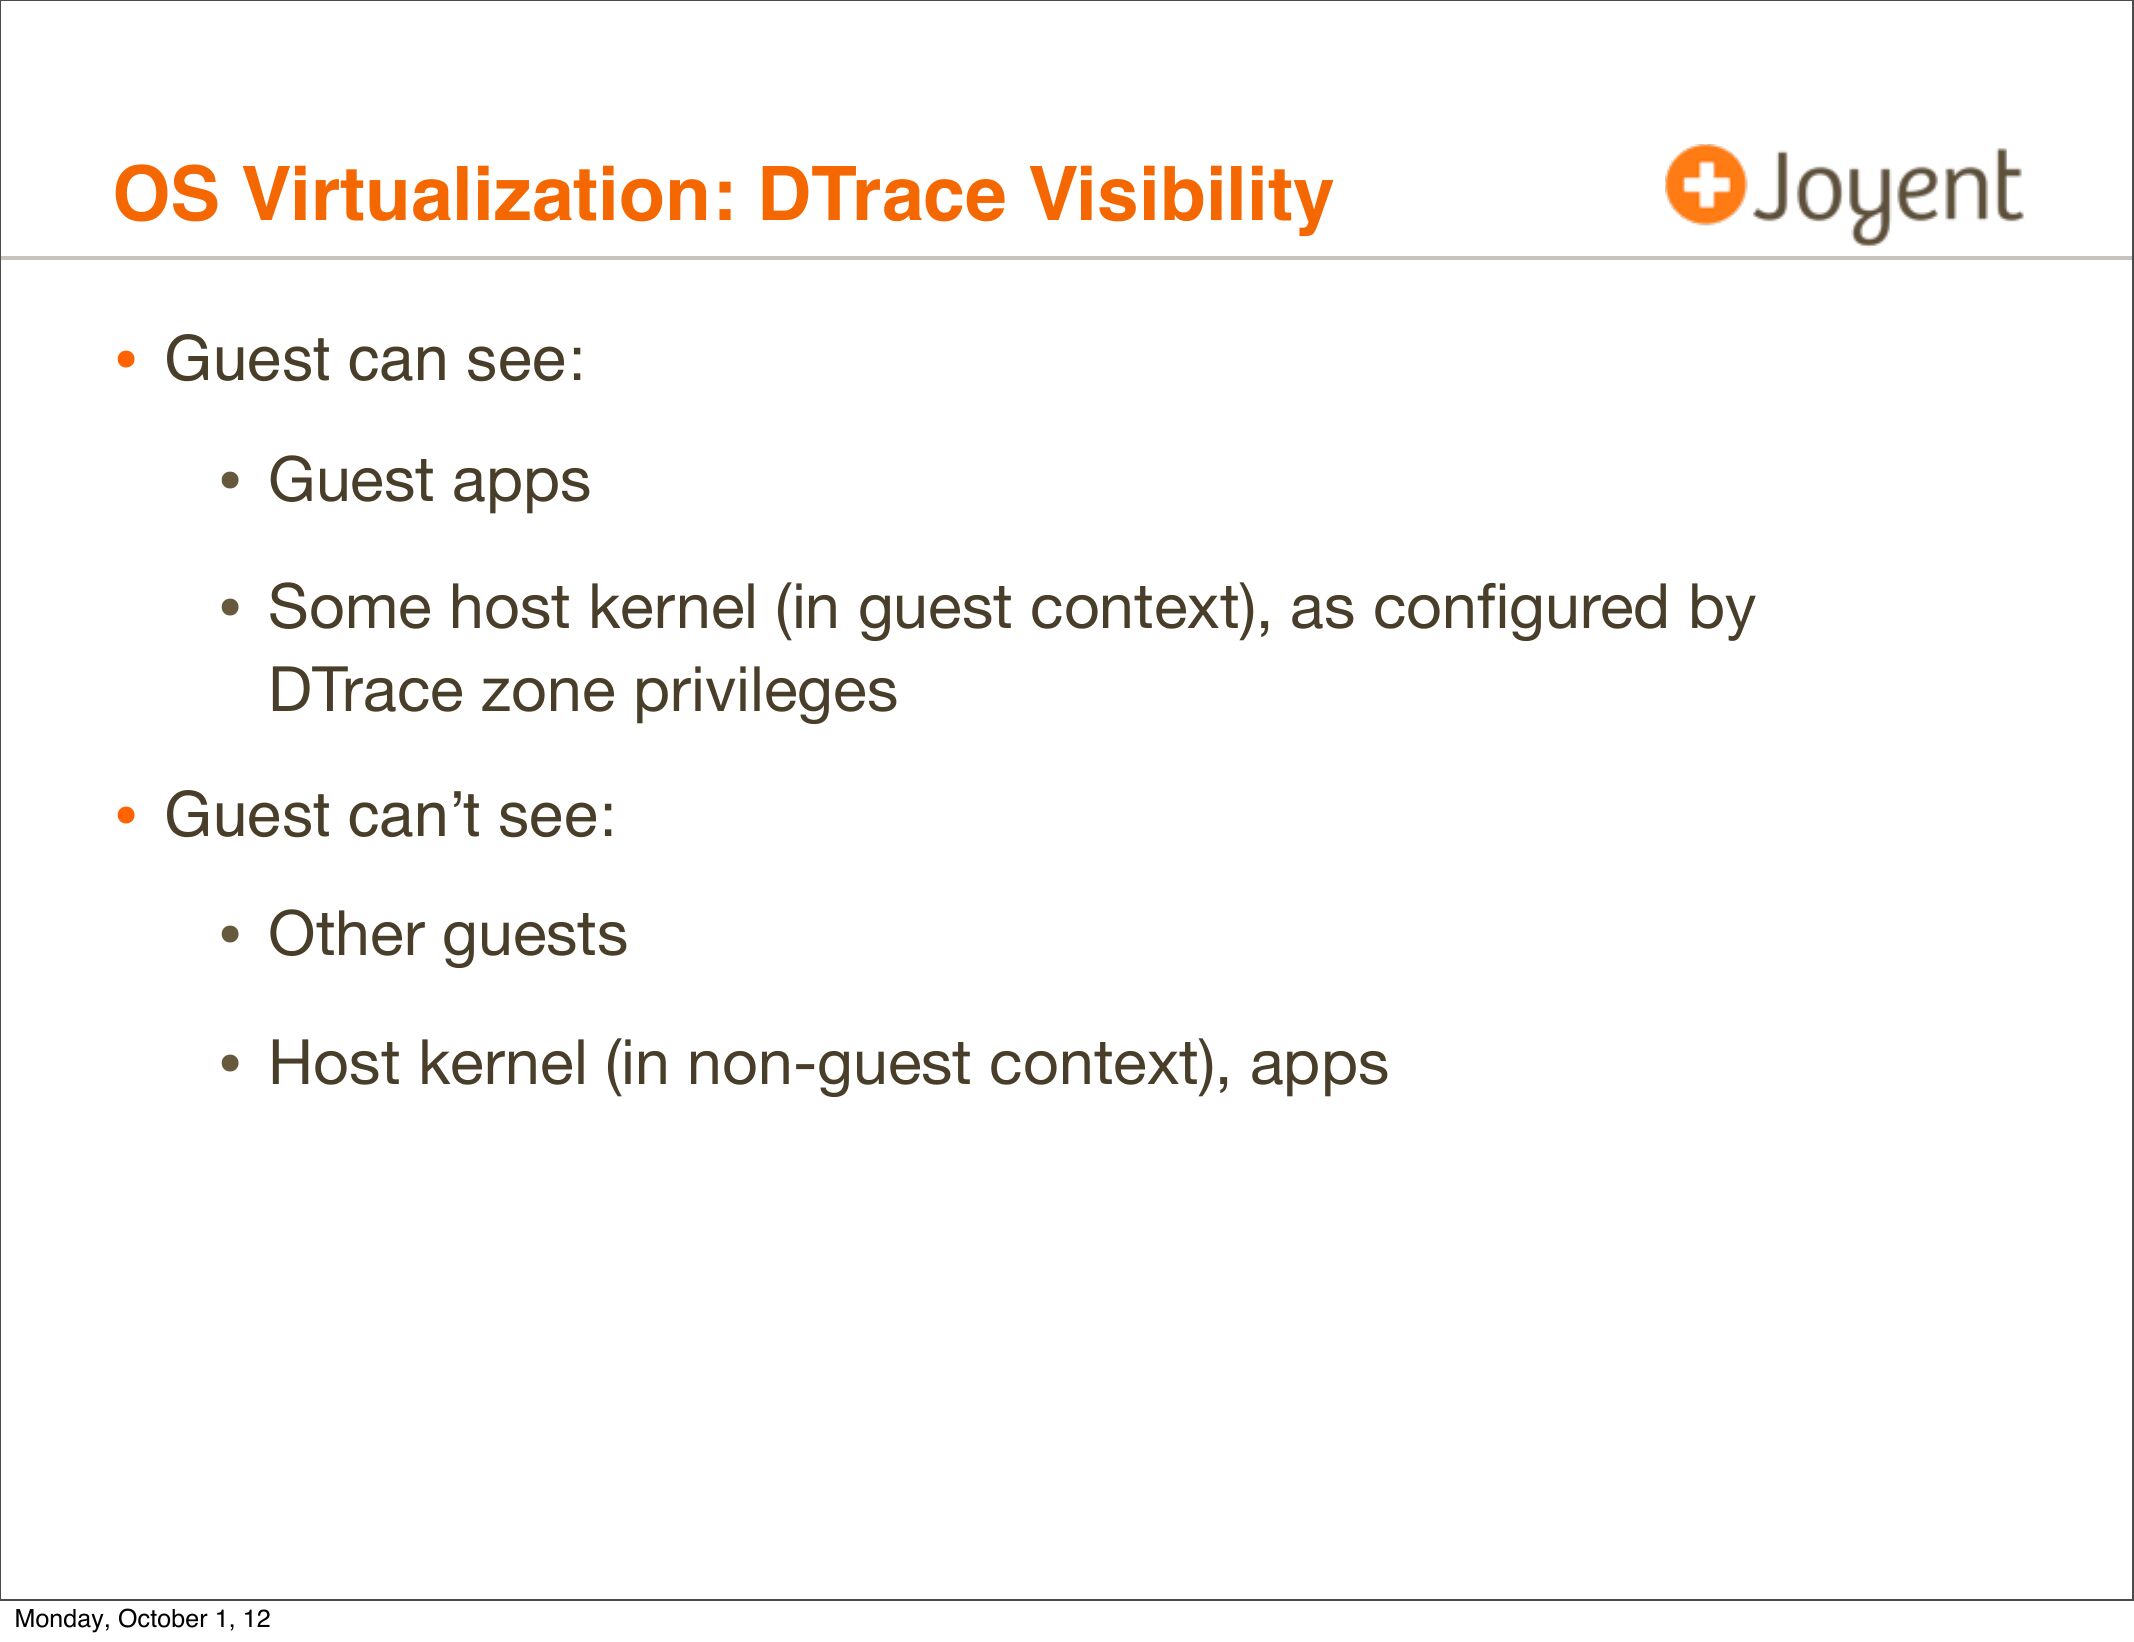
• Guest can see:
• Guest apps
• Some host kernel (in guest context), as configured by
DTrace zone privileges
• Guest can’t see:
• Other guests
• Host kernel (in non-guest context), apps
Monday, October 1, 12
slide 23:
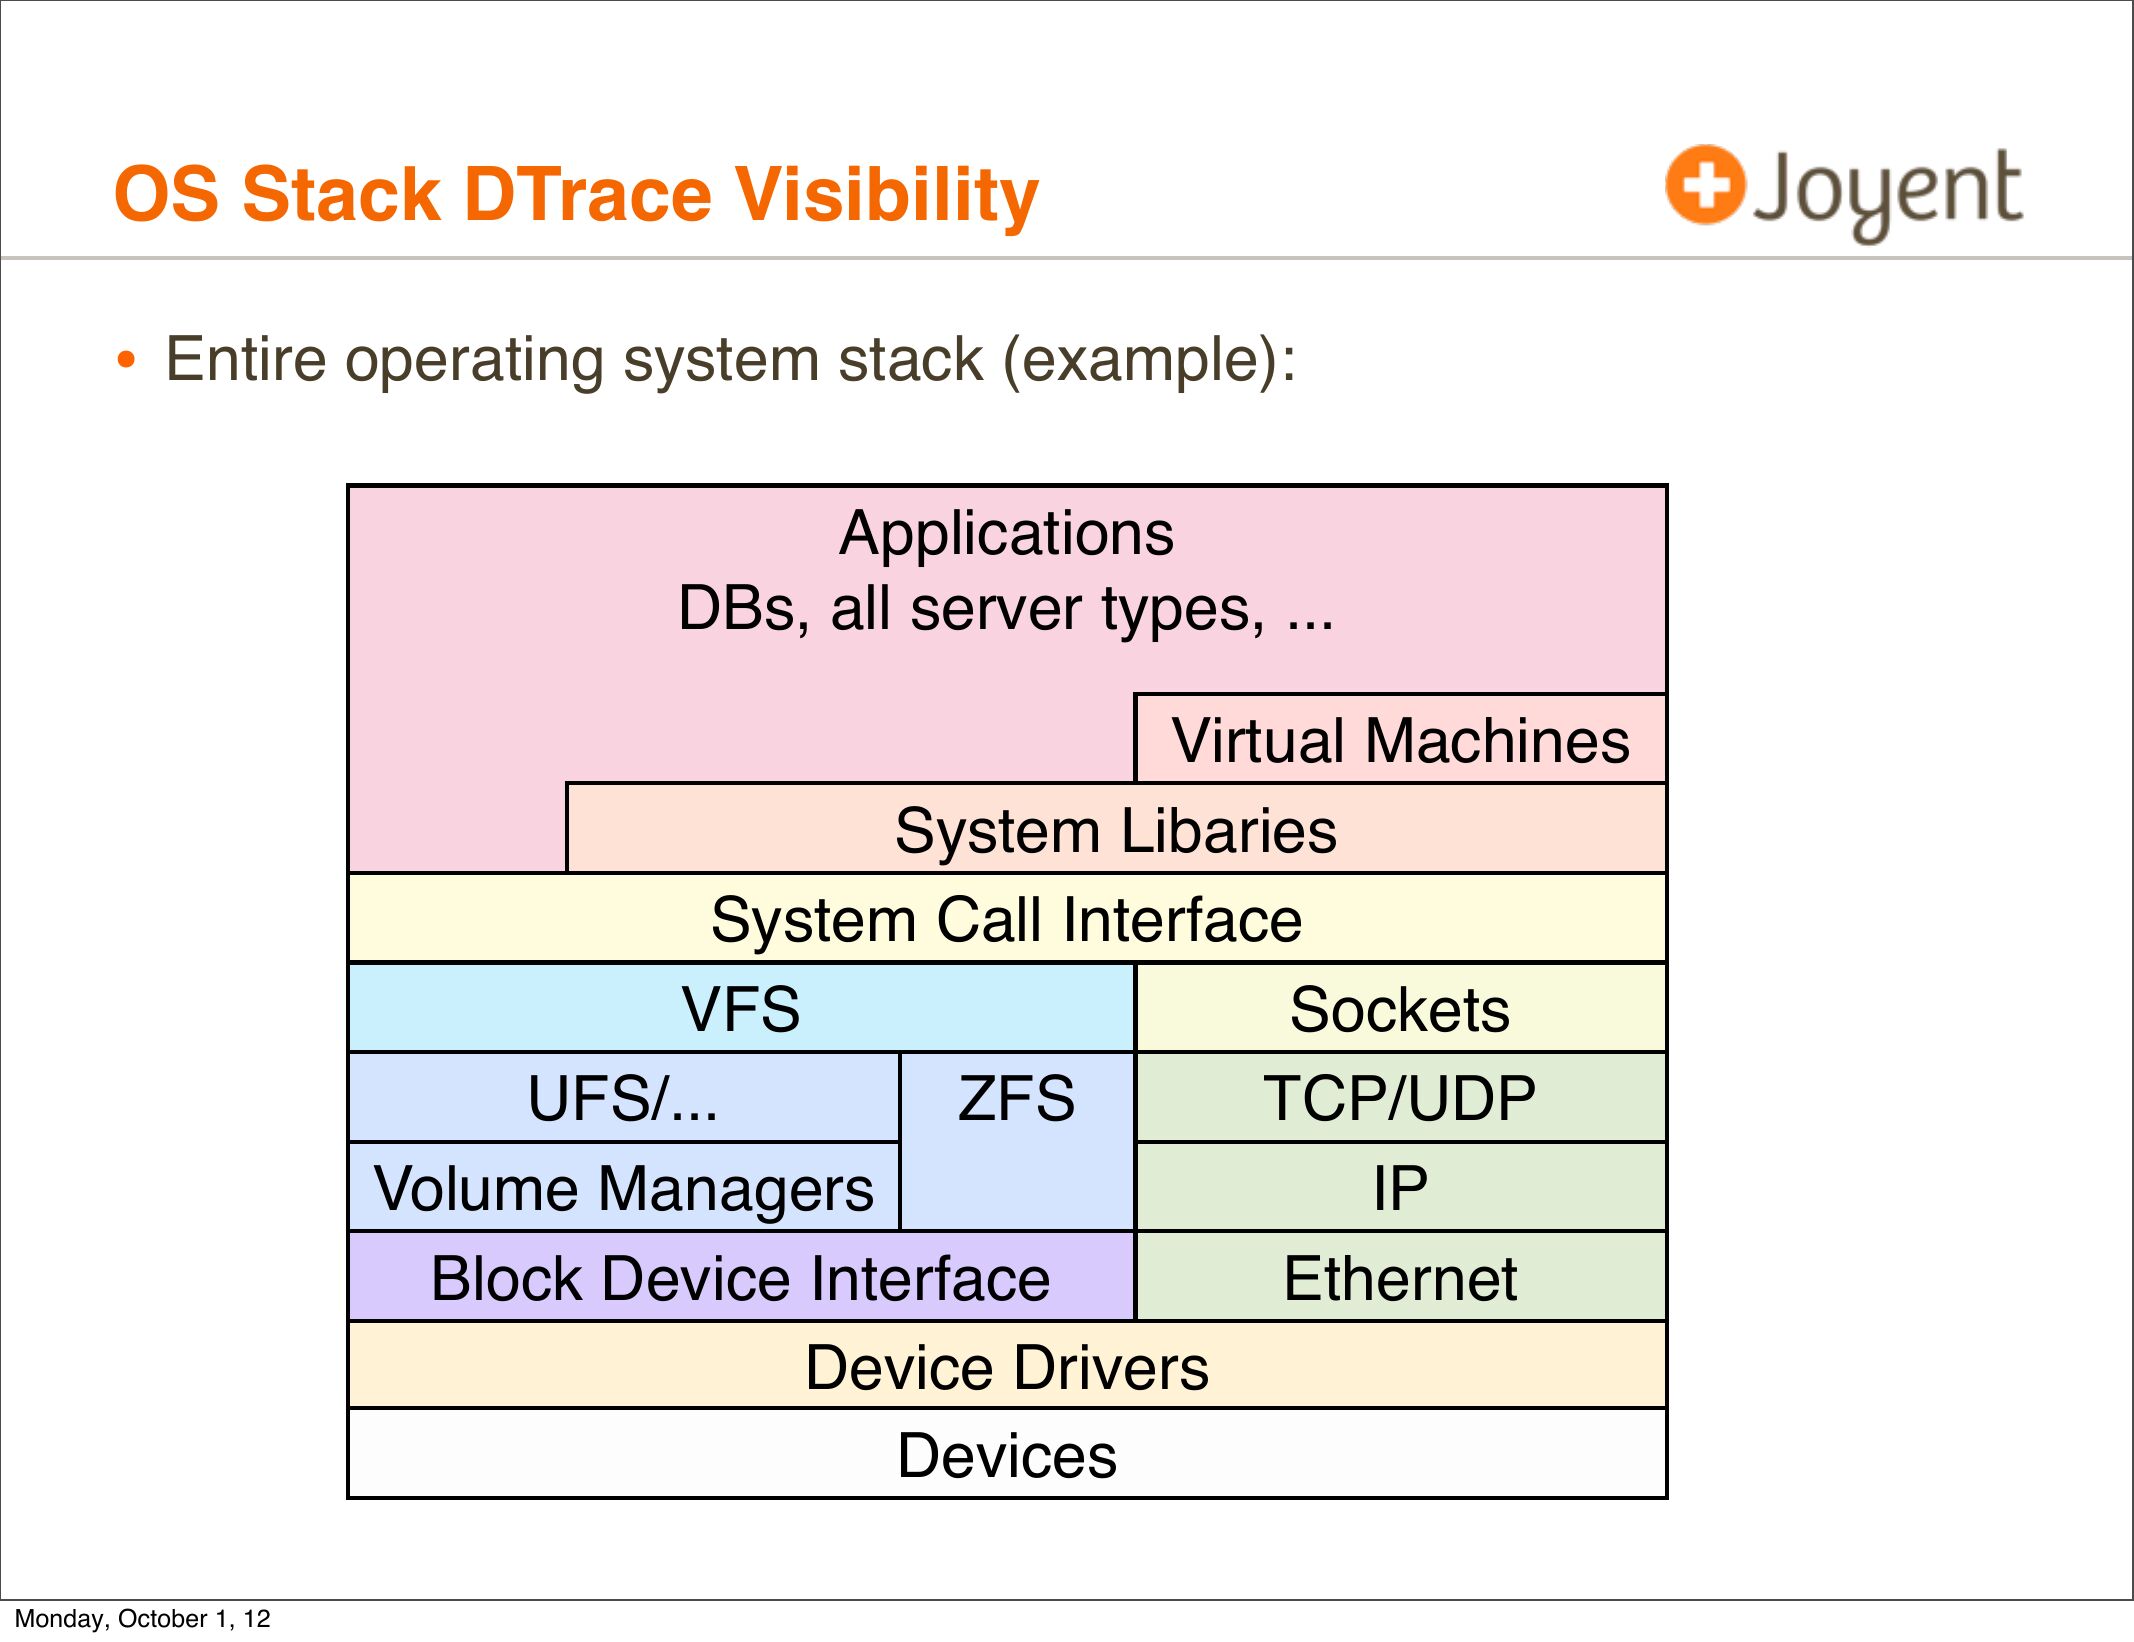
OS Stack DTrace Visibility
• Entire operating system stack (example):
Applications
DBs, all server types, ...
Virtual Machines
System Libaries
System Call Interface
VFS
Sockets
UFS/...
ZFS
TCP/UDP
Volume Managers
Block Device Interface
Ethernet
Device Drivers
Devices
Monday, October 1, 12
slide 24:
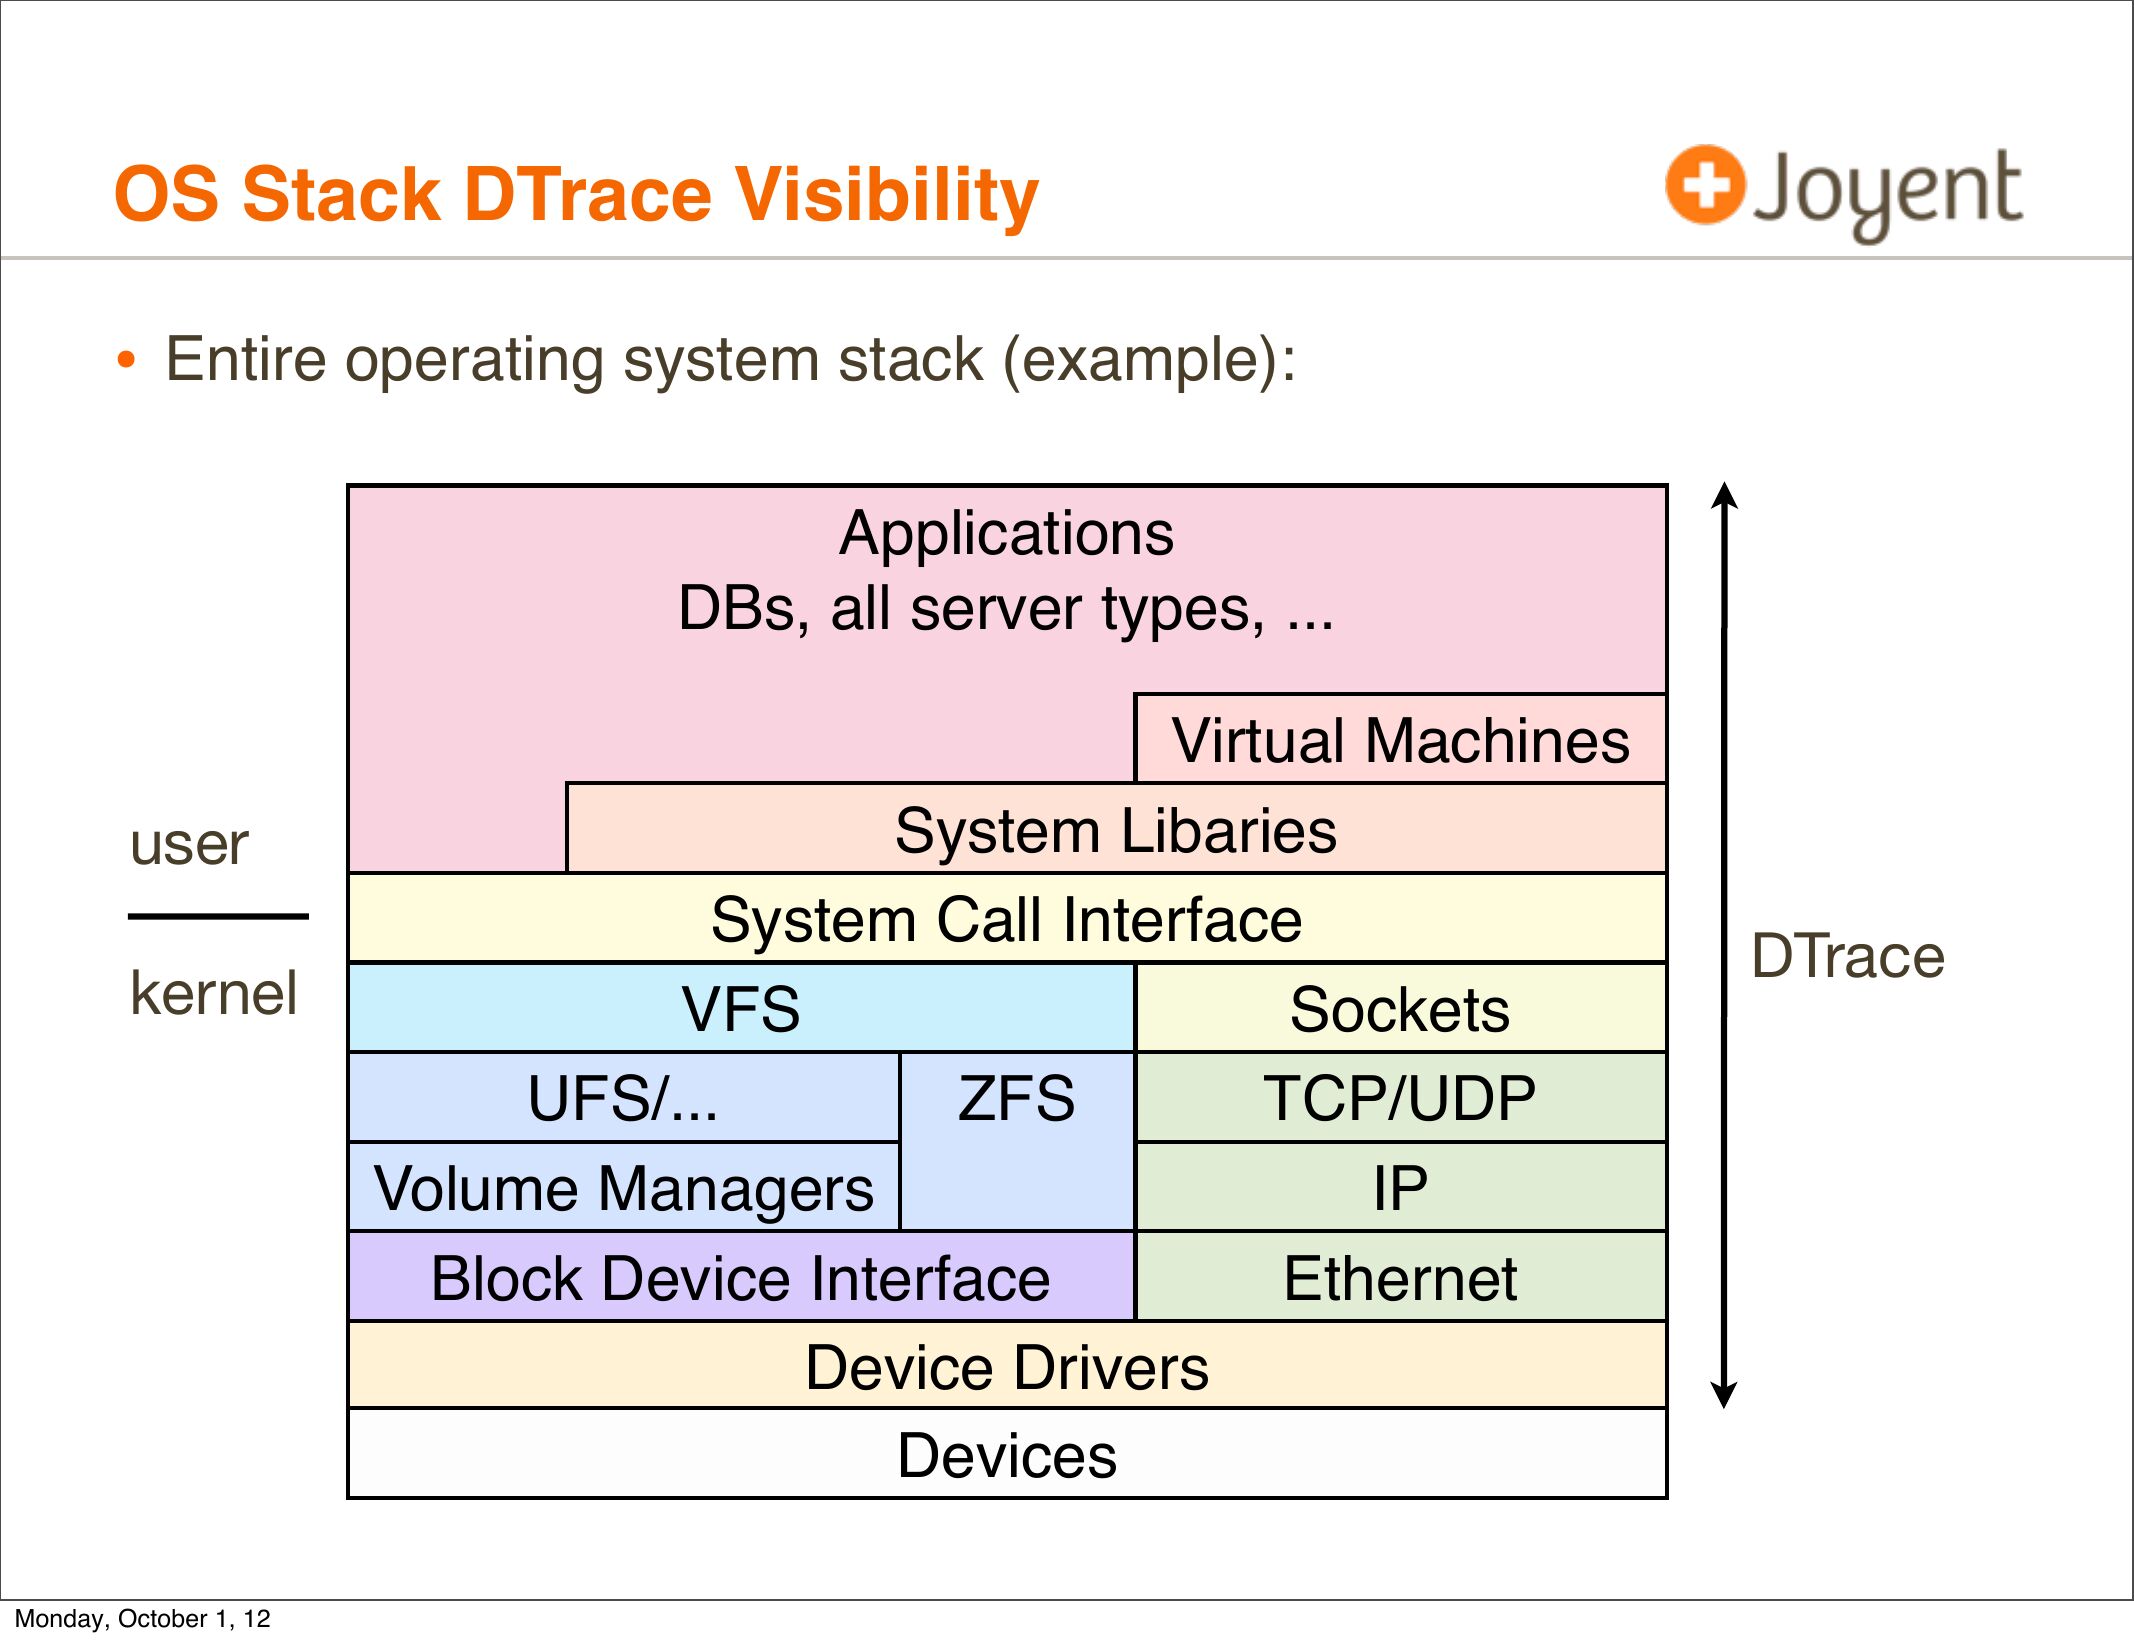
OS Stack DTrace Visibility
• Entire operating system stack (example):
Applications
DBs, all server types, ...
user
kernel
Monday, October 1, 12
Virtual Machines
System Libaries
System Call Interface
VFS
Sockets
UFS/...
ZFS
TCP/UDP
Volume Managers
Block Device Interface
Ethernet
Device Drivers
Devices
DTrace
slide 25:
Reality
Monday, October 1, 12
slide 26:
DTrace and Zones
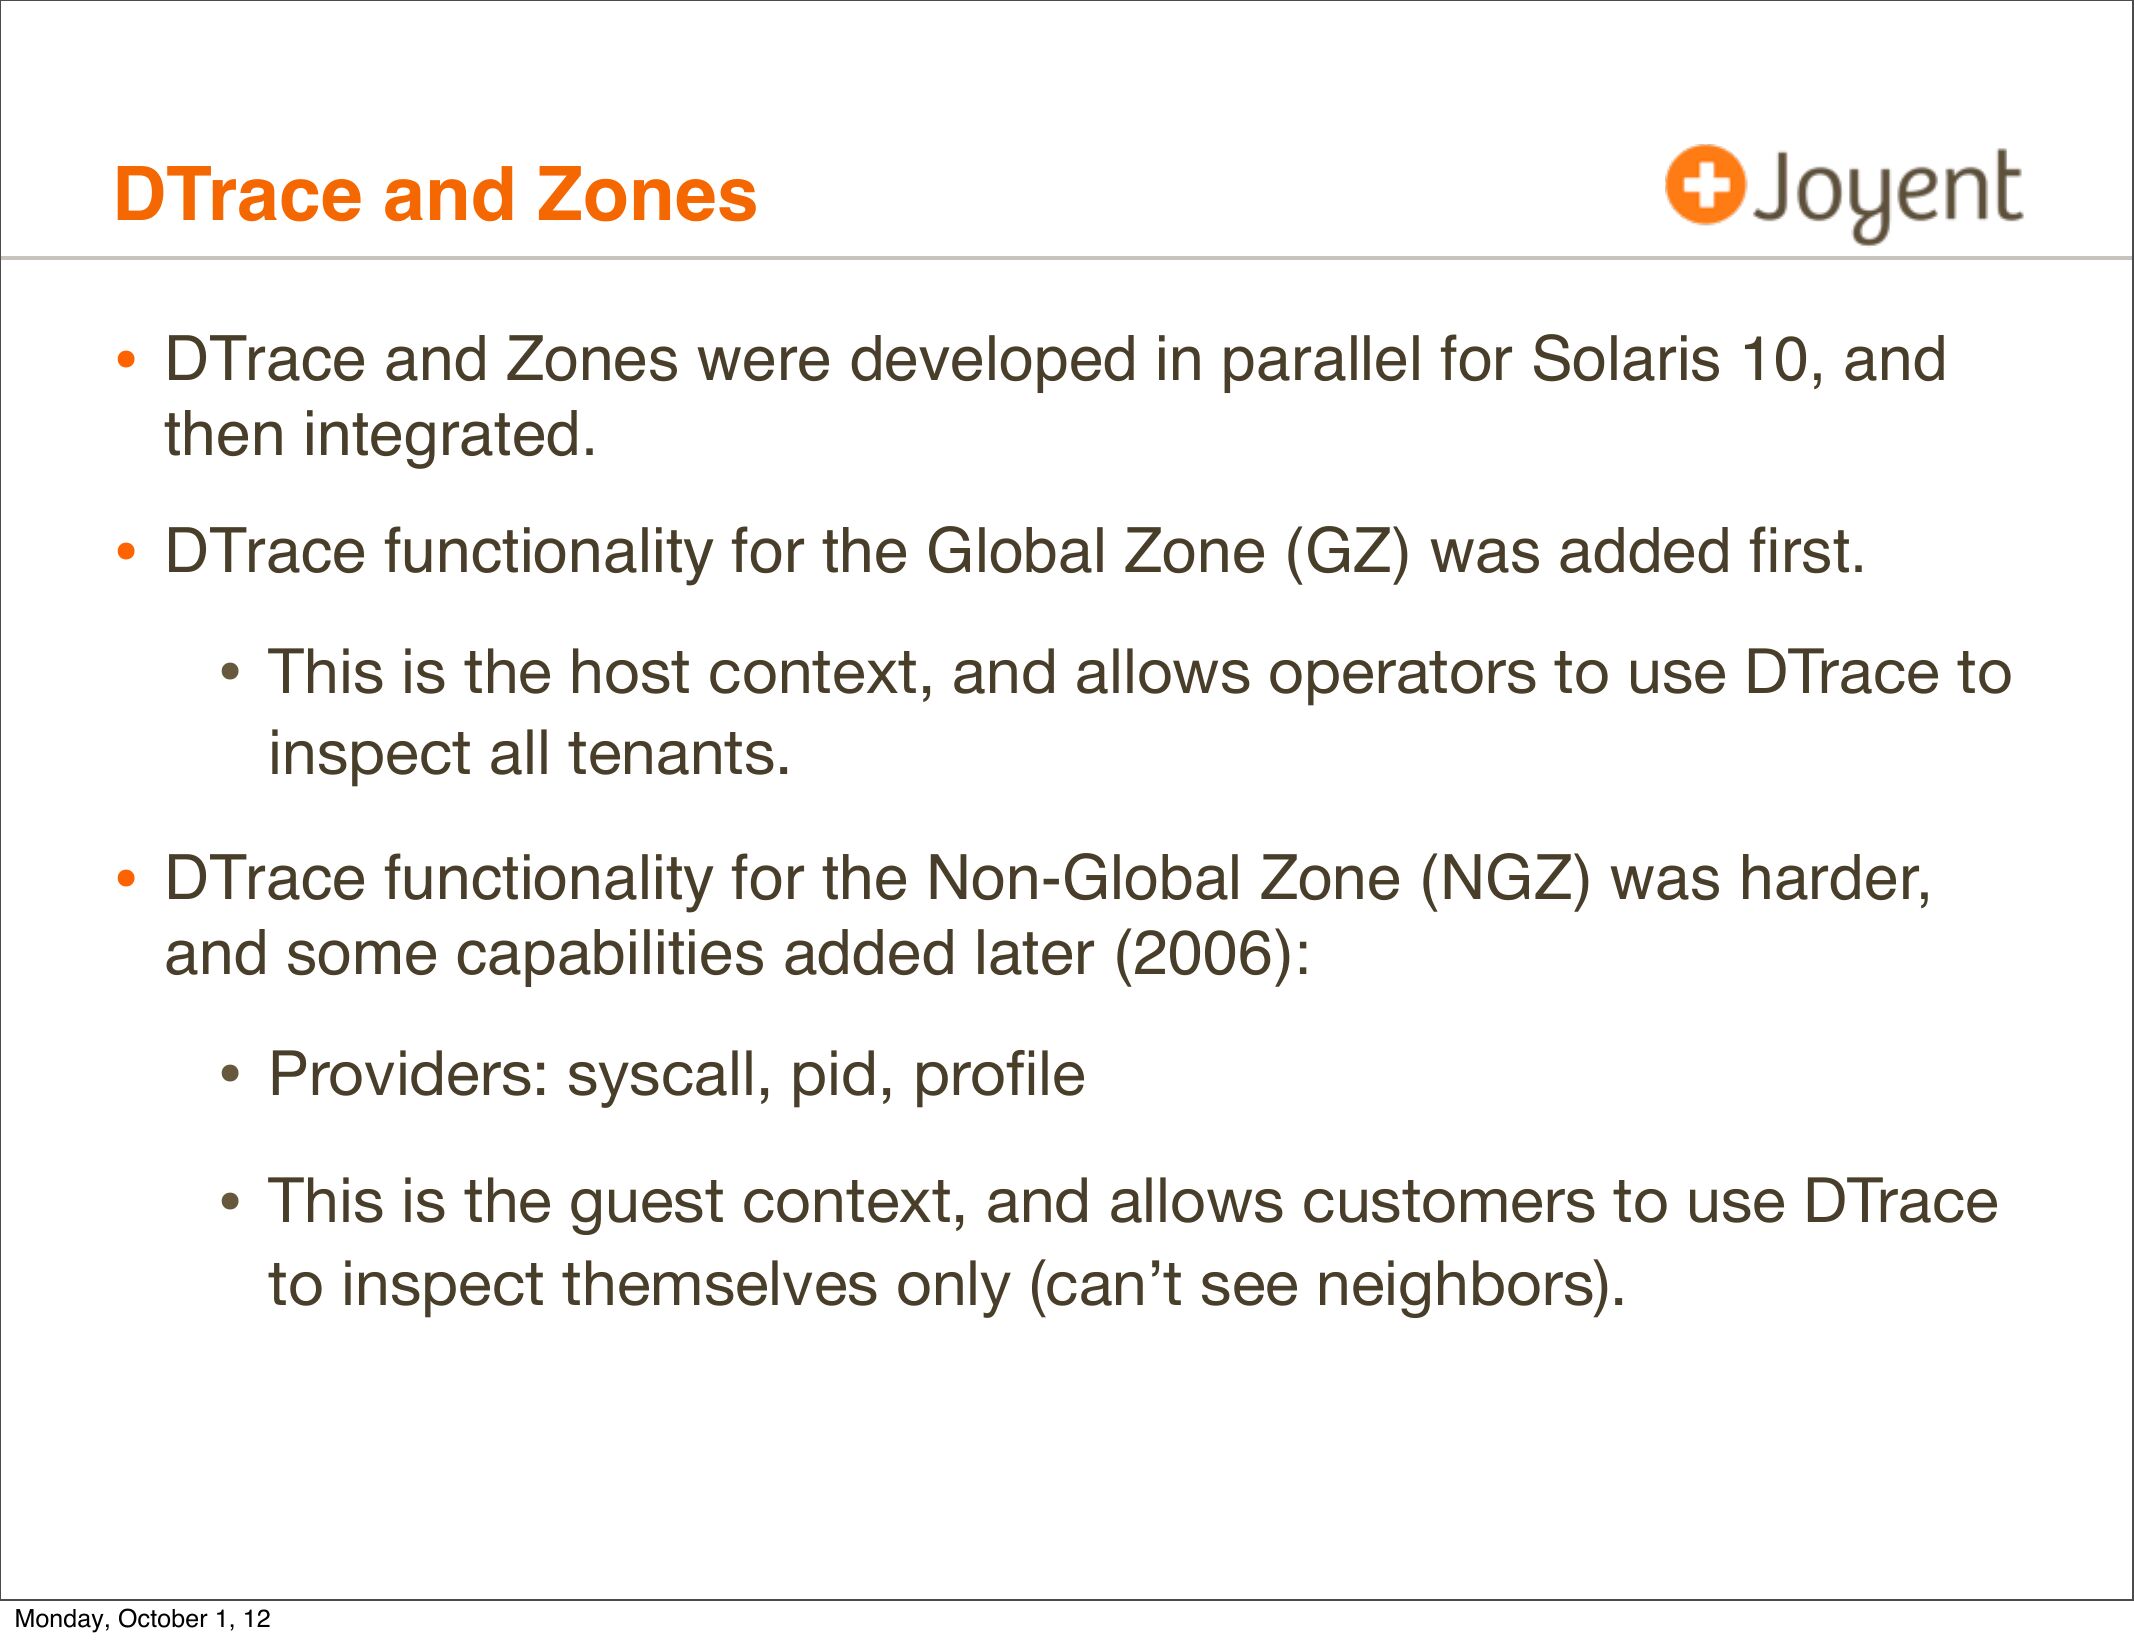
• DTrace and Zones were developed in parallel for Solaris 10, and
then integrated.
• DTrace functionality for the Global Zone (GZ) was added first.
• This is the host context, and allows operators to use DTrace to
inspect all tenants.
• DTrace functionality for the Non-Global Zone (NGZ) was harder,
and some capabilities added later (2006):
• Providers: syscall, pid, profile
• This is the guest context, and allows customers to use DTrace
to inspect themselves only (can’t see neighbors).
Monday, October 1, 12
slide 27:
DTrace and Zones, cont.
Monday, October 1, 12
slide 28:
DTrace and Zones, cont.
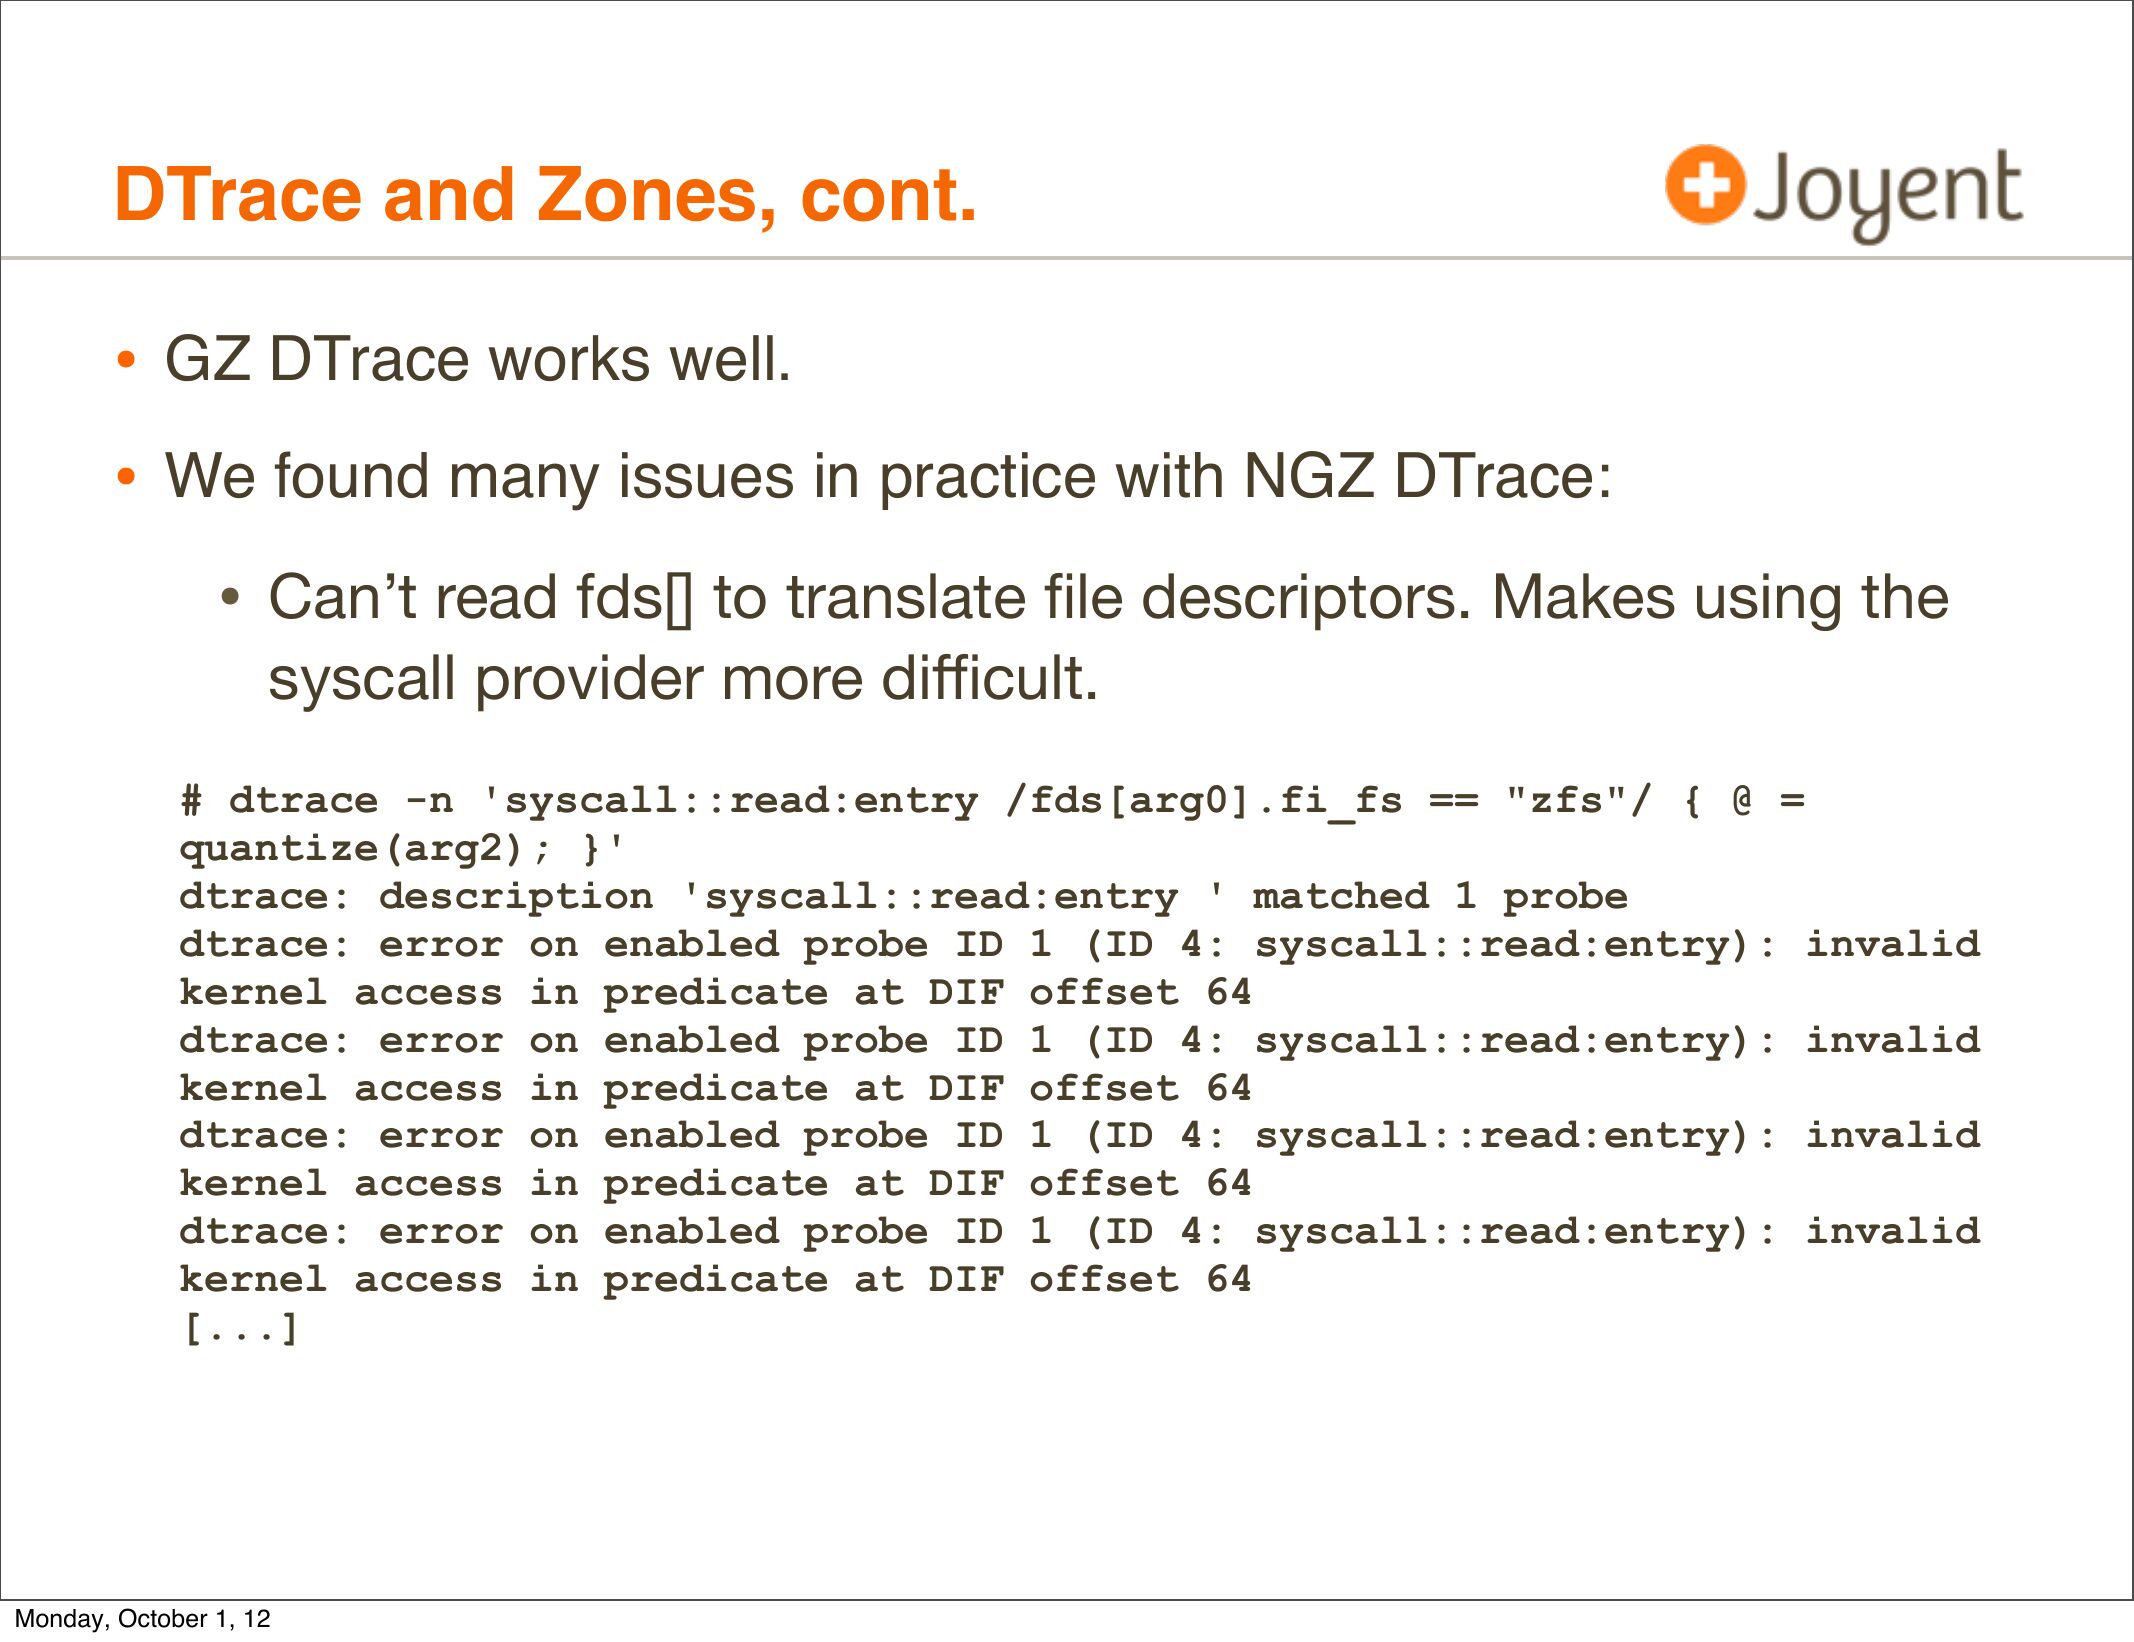
• GZ DTrace works well.
• We found many issues in practice with NGZ DTrace:
• Can’t read fds[] to translate file descriptors. Makes using the
syscall provider more difficult.
# dtrace -n 'syscall::read:entry /fds[arg0].fi_fs == "zfs"/ { @ =
quantize(arg2); }'
dtrace: description 'syscall::read:entry ' matched 1 probe
dtrace: error on enabled probe ID 1 (ID 4: syscall::read:entry): invalid
kernel access in predicate at DIF offset 64
dtrace: error on enabled probe ID 1 (ID 4: syscall::read:entry): invalid
kernel access in predicate at DIF offset 64
dtrace: error on enabled probe ID 1 (ID 4: syscall::read:entry): invalid
kernel access in predicate at DIF offset 64
dtrace: error on enabled probe ID 1 (ID 4: syscall::read:entry): invalid
kernel access in predicate at DIF offset 64
[...]
Monday, October 1, 12
slide 29:
DTrace and Zones, cont.
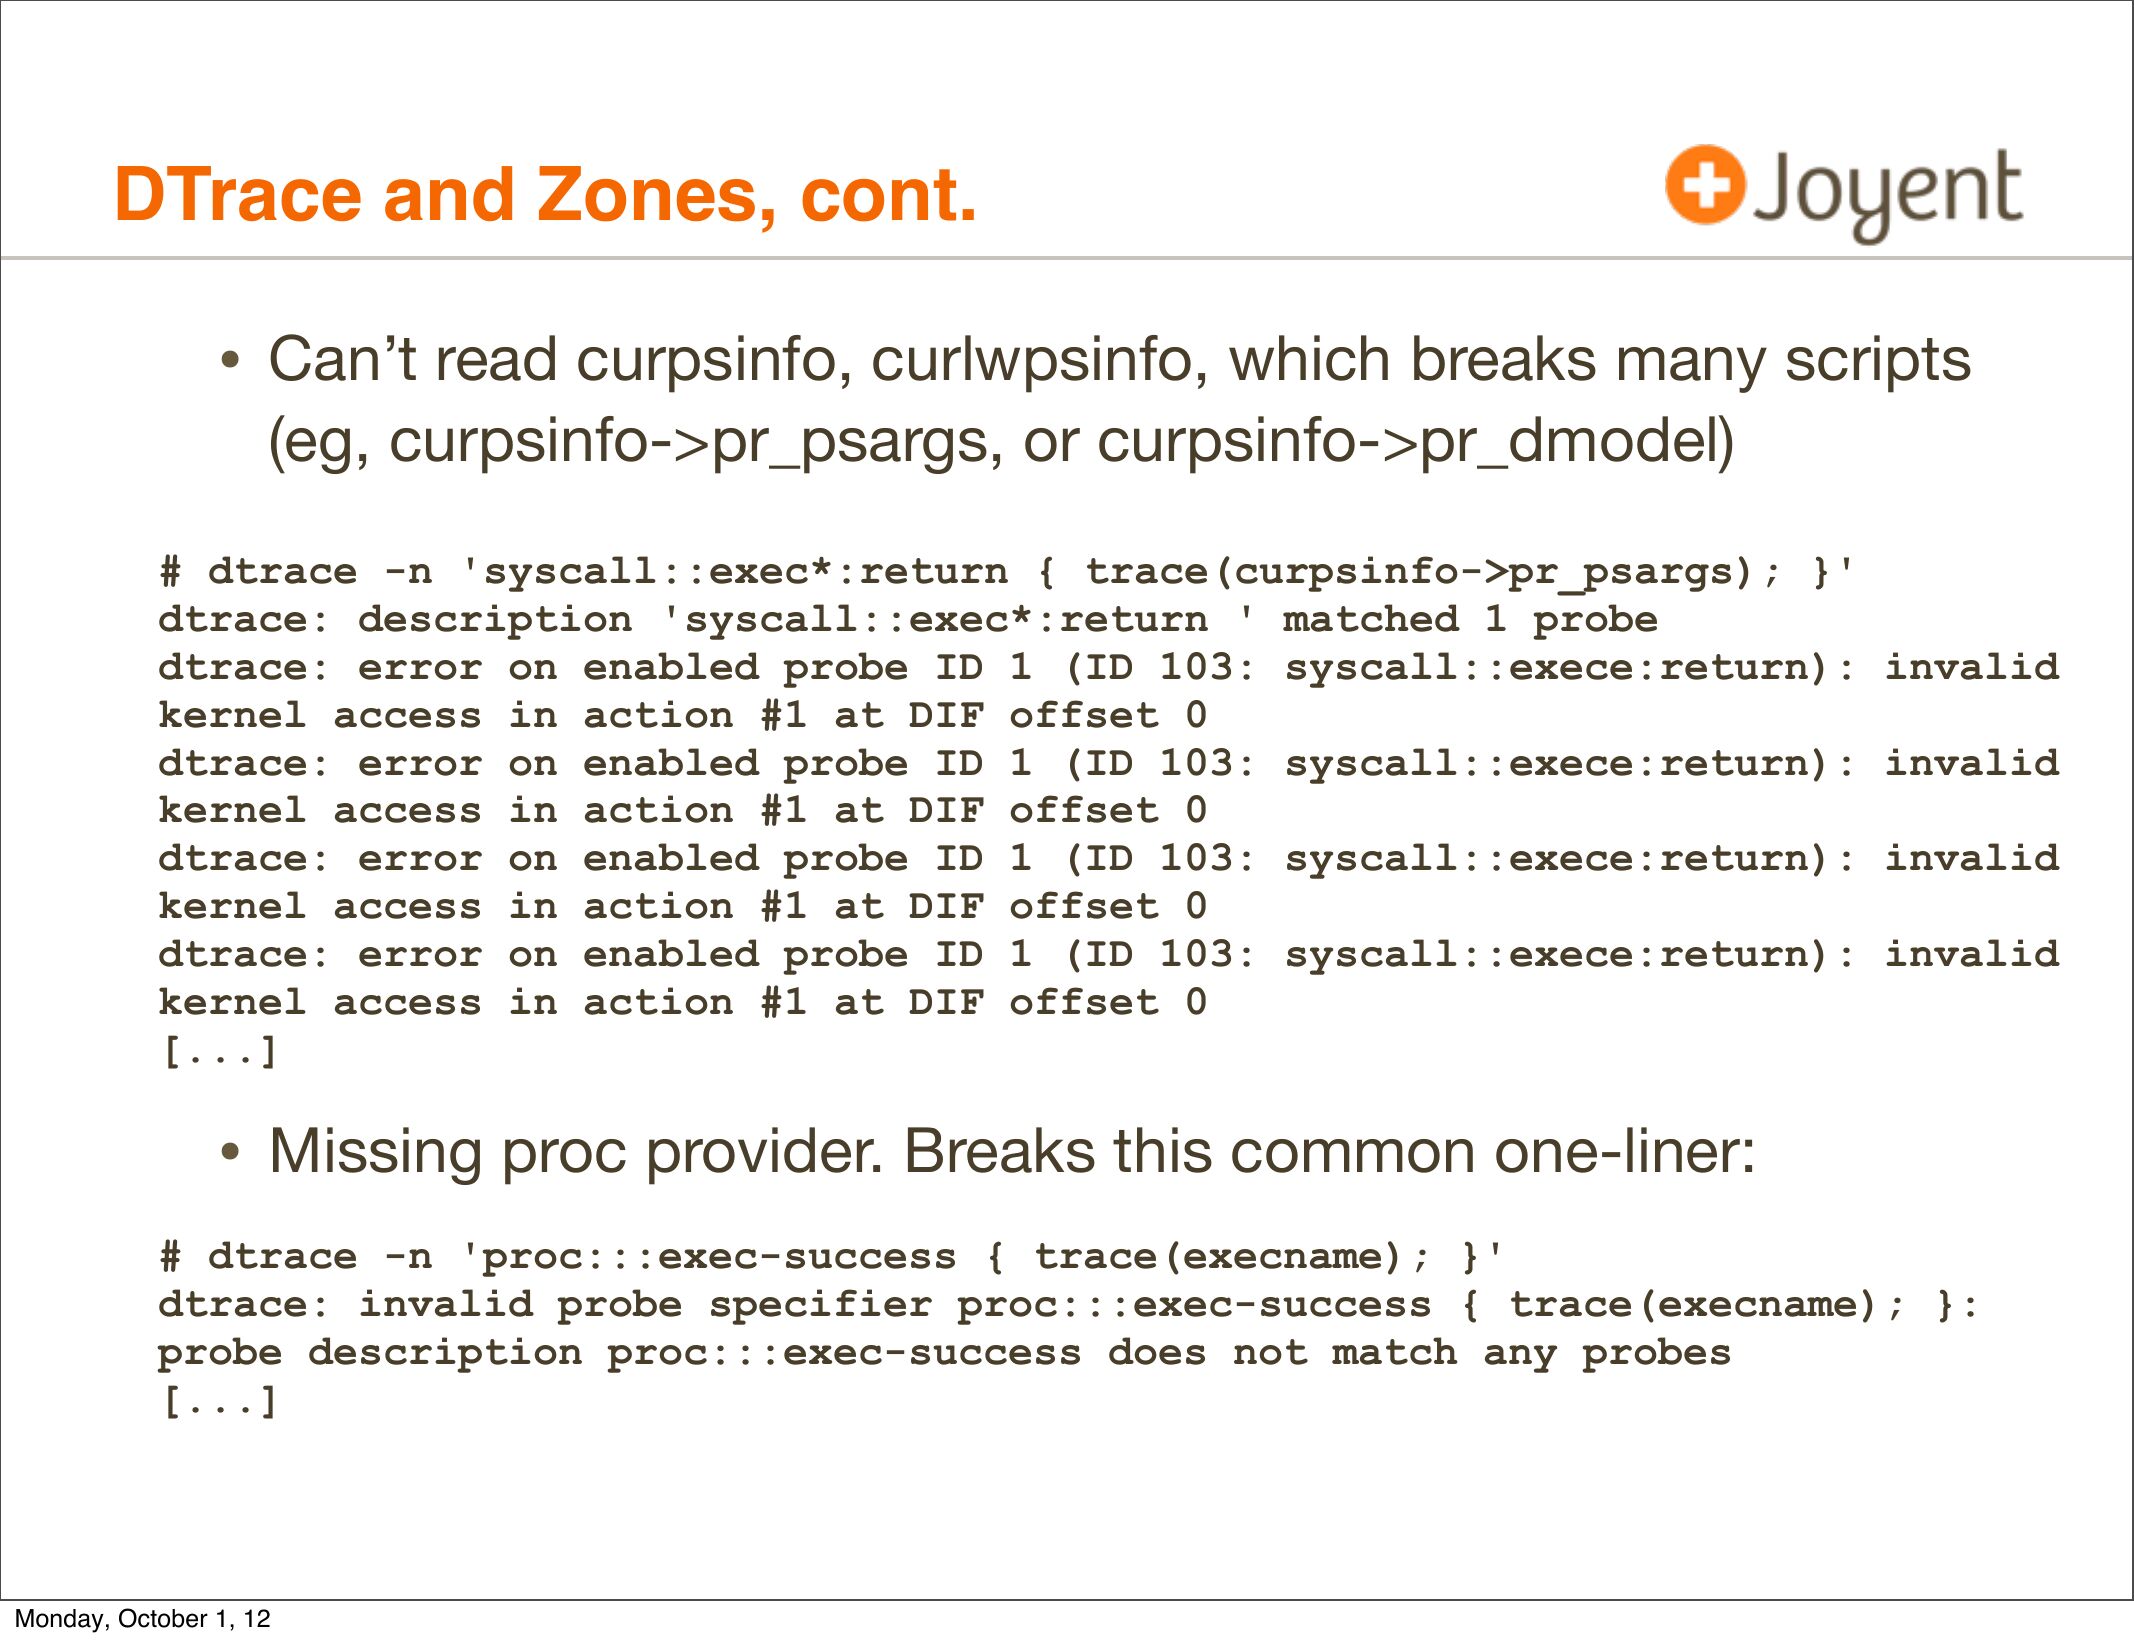
• Can’t read curpsinfo, curlwpsinfo, which breaks many scripts
(eg, curpsinfo->gt;pr_psargs, or curpsinfo->gt;pr_dmodel)
# dtrace -n 'syscall::exec*:return { trace(curpsinfo->gt;pr_psargs); }'
dtrace: description 'syscall::exec*:return ' matched 1 probe
dtrace: error on enabled probe ID 1 (ID 103: syscall::exece:return): invalid
kernel access in action #1 at DIF offset 0
dtrace: error on enabled probe ID 1 (ID 103: syscall::exece:return): invalid
kernel access in action #1 at DIF offset 0
dtrace: error on enabled probe ID 1 (ID 103: syscall::exece:return): invalid
kernel access in action #1 at DIF offset 0
dtrace: error on enabled probe ID 1 (ID 103: syscall::exece:return): invalid
kernel access in action #1 at DIF offset 0
[...]
• Missing proc provider. Breaks this common one-liner:
# dtrace -n 'proc:::exec-success { trace(execname); }'
dtrace: invalid probe specifier proc:::exec-success { trace(execname); }:
probe description proc:::exec-success does not match any probes
[...]
Monday, October 1, 12
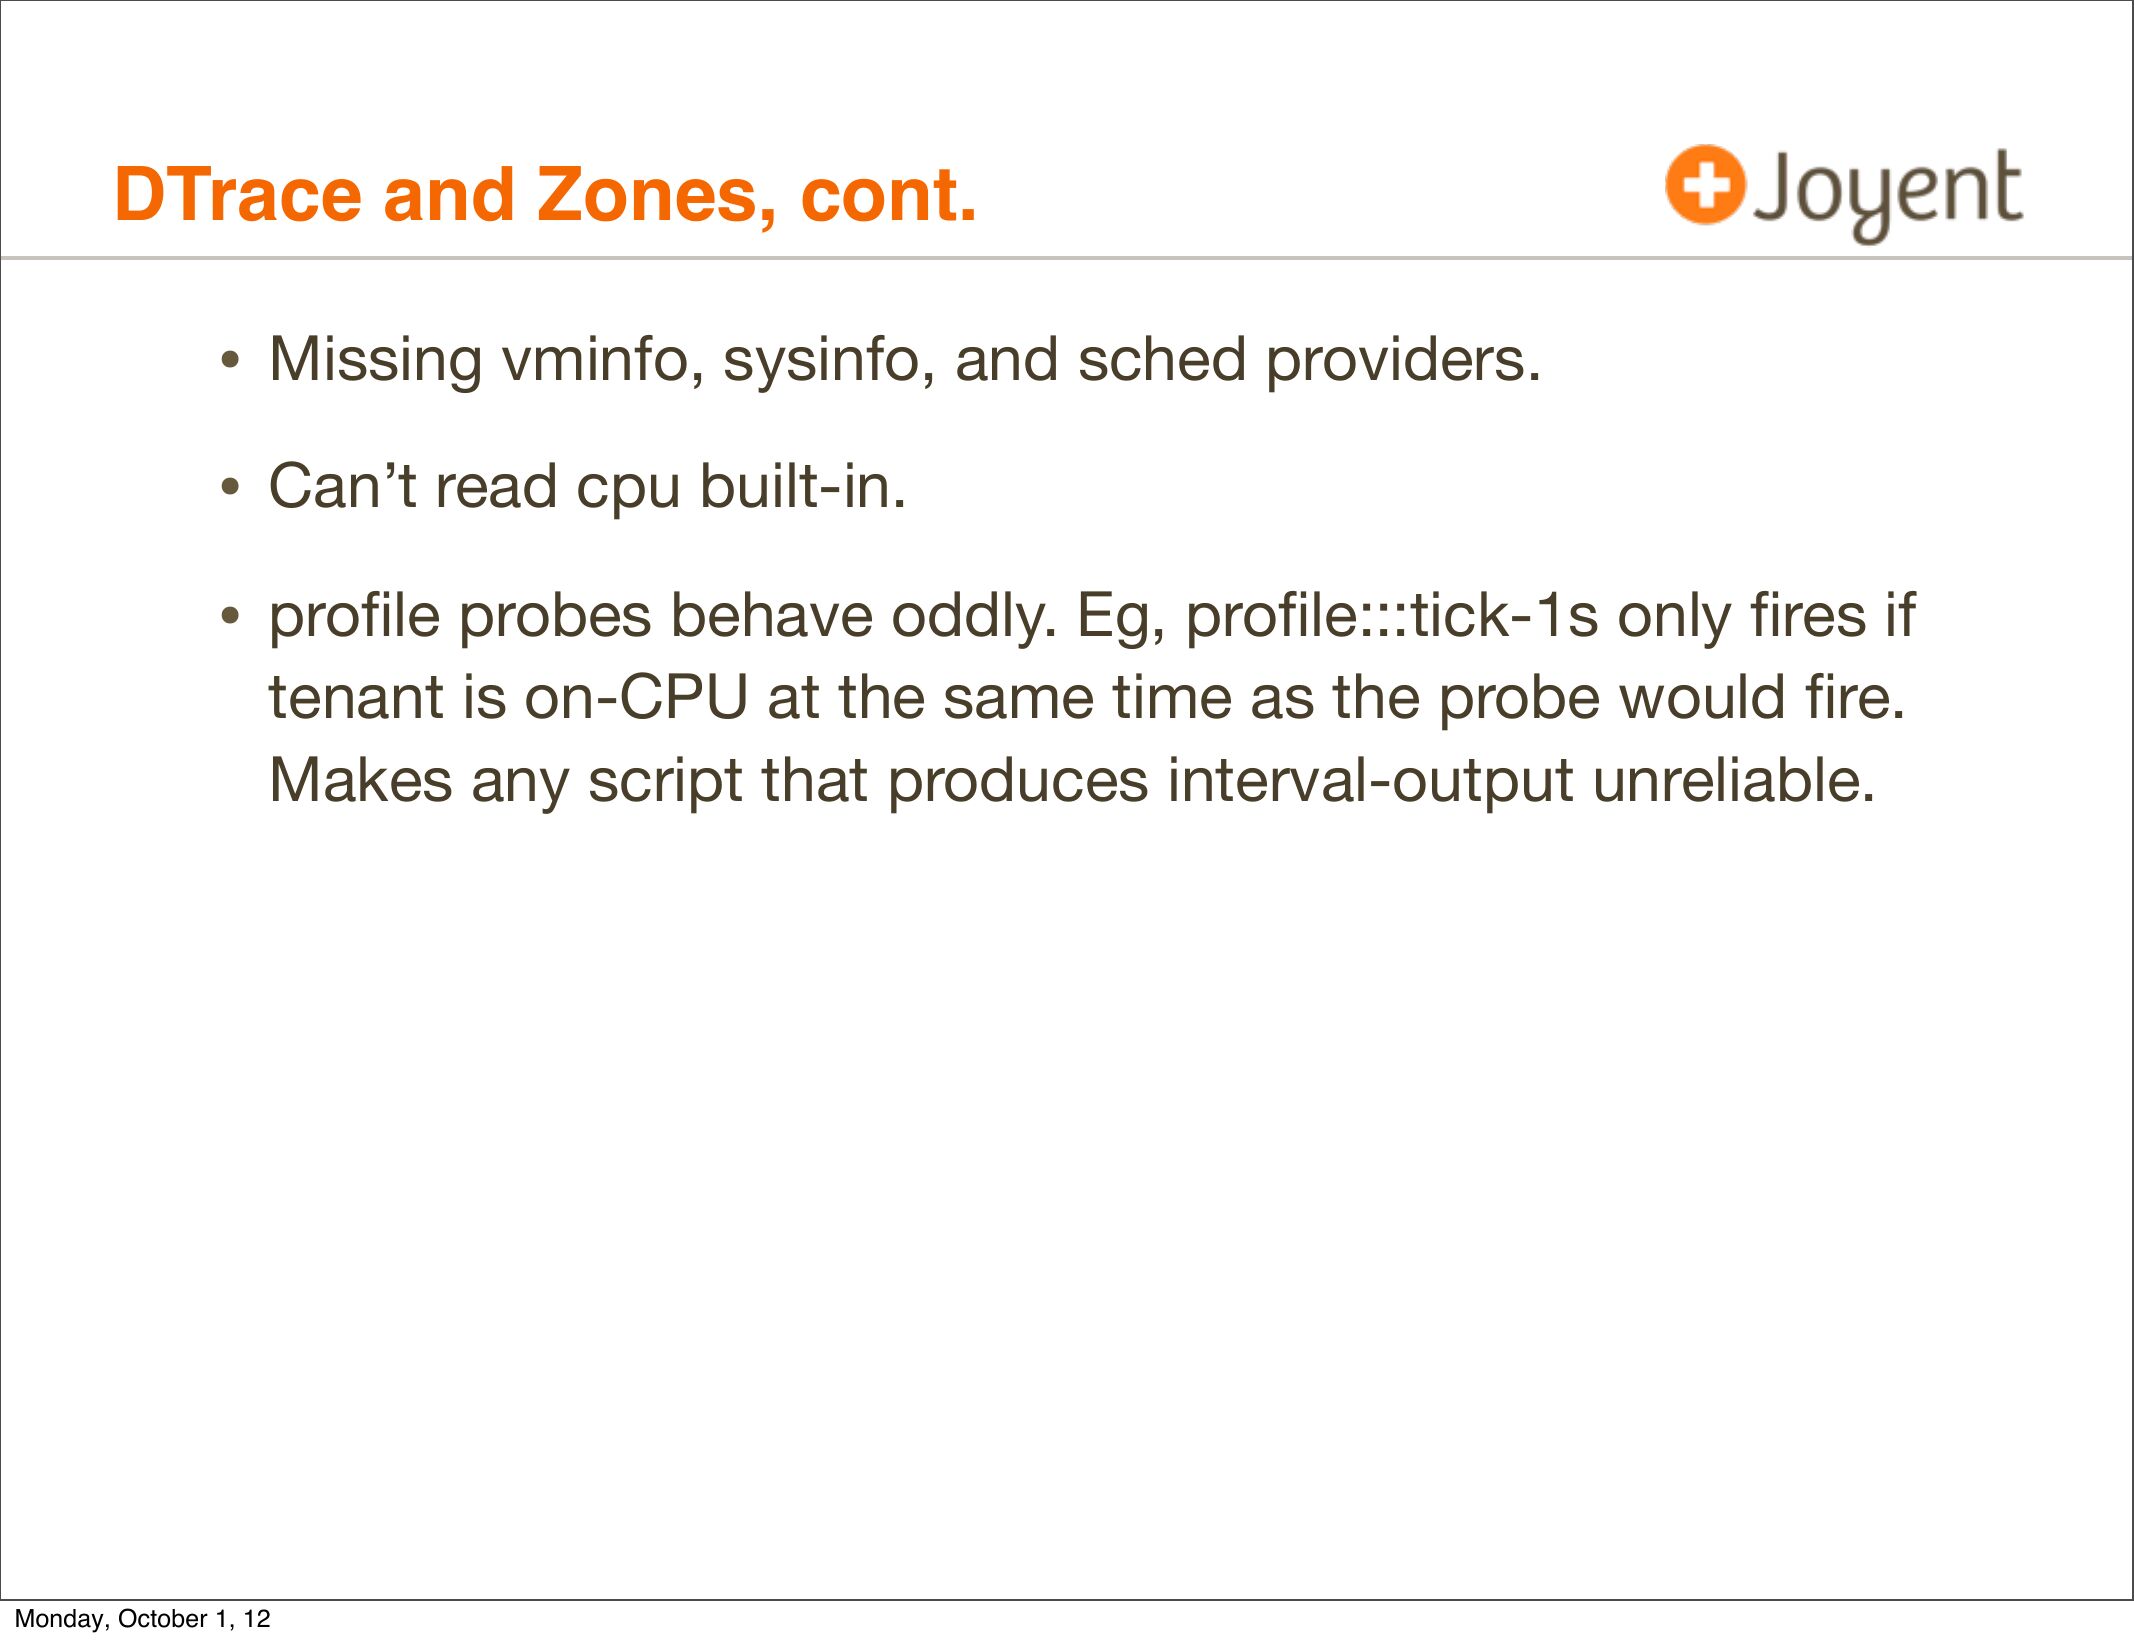
slide 30:DTrace and Zones, cont. • Missing vminfo, sysinfo, and sched providers. • Can’t read cpu built-in. • profile probes behave oddly. Eg, profile:::tick-1s only fires if tenant is on-CPU at the same time as the probe would fire. Makes any script that produces interval-output unreliable. Monday, October 1, 12slide 31:
DTrace and Zones, cont.
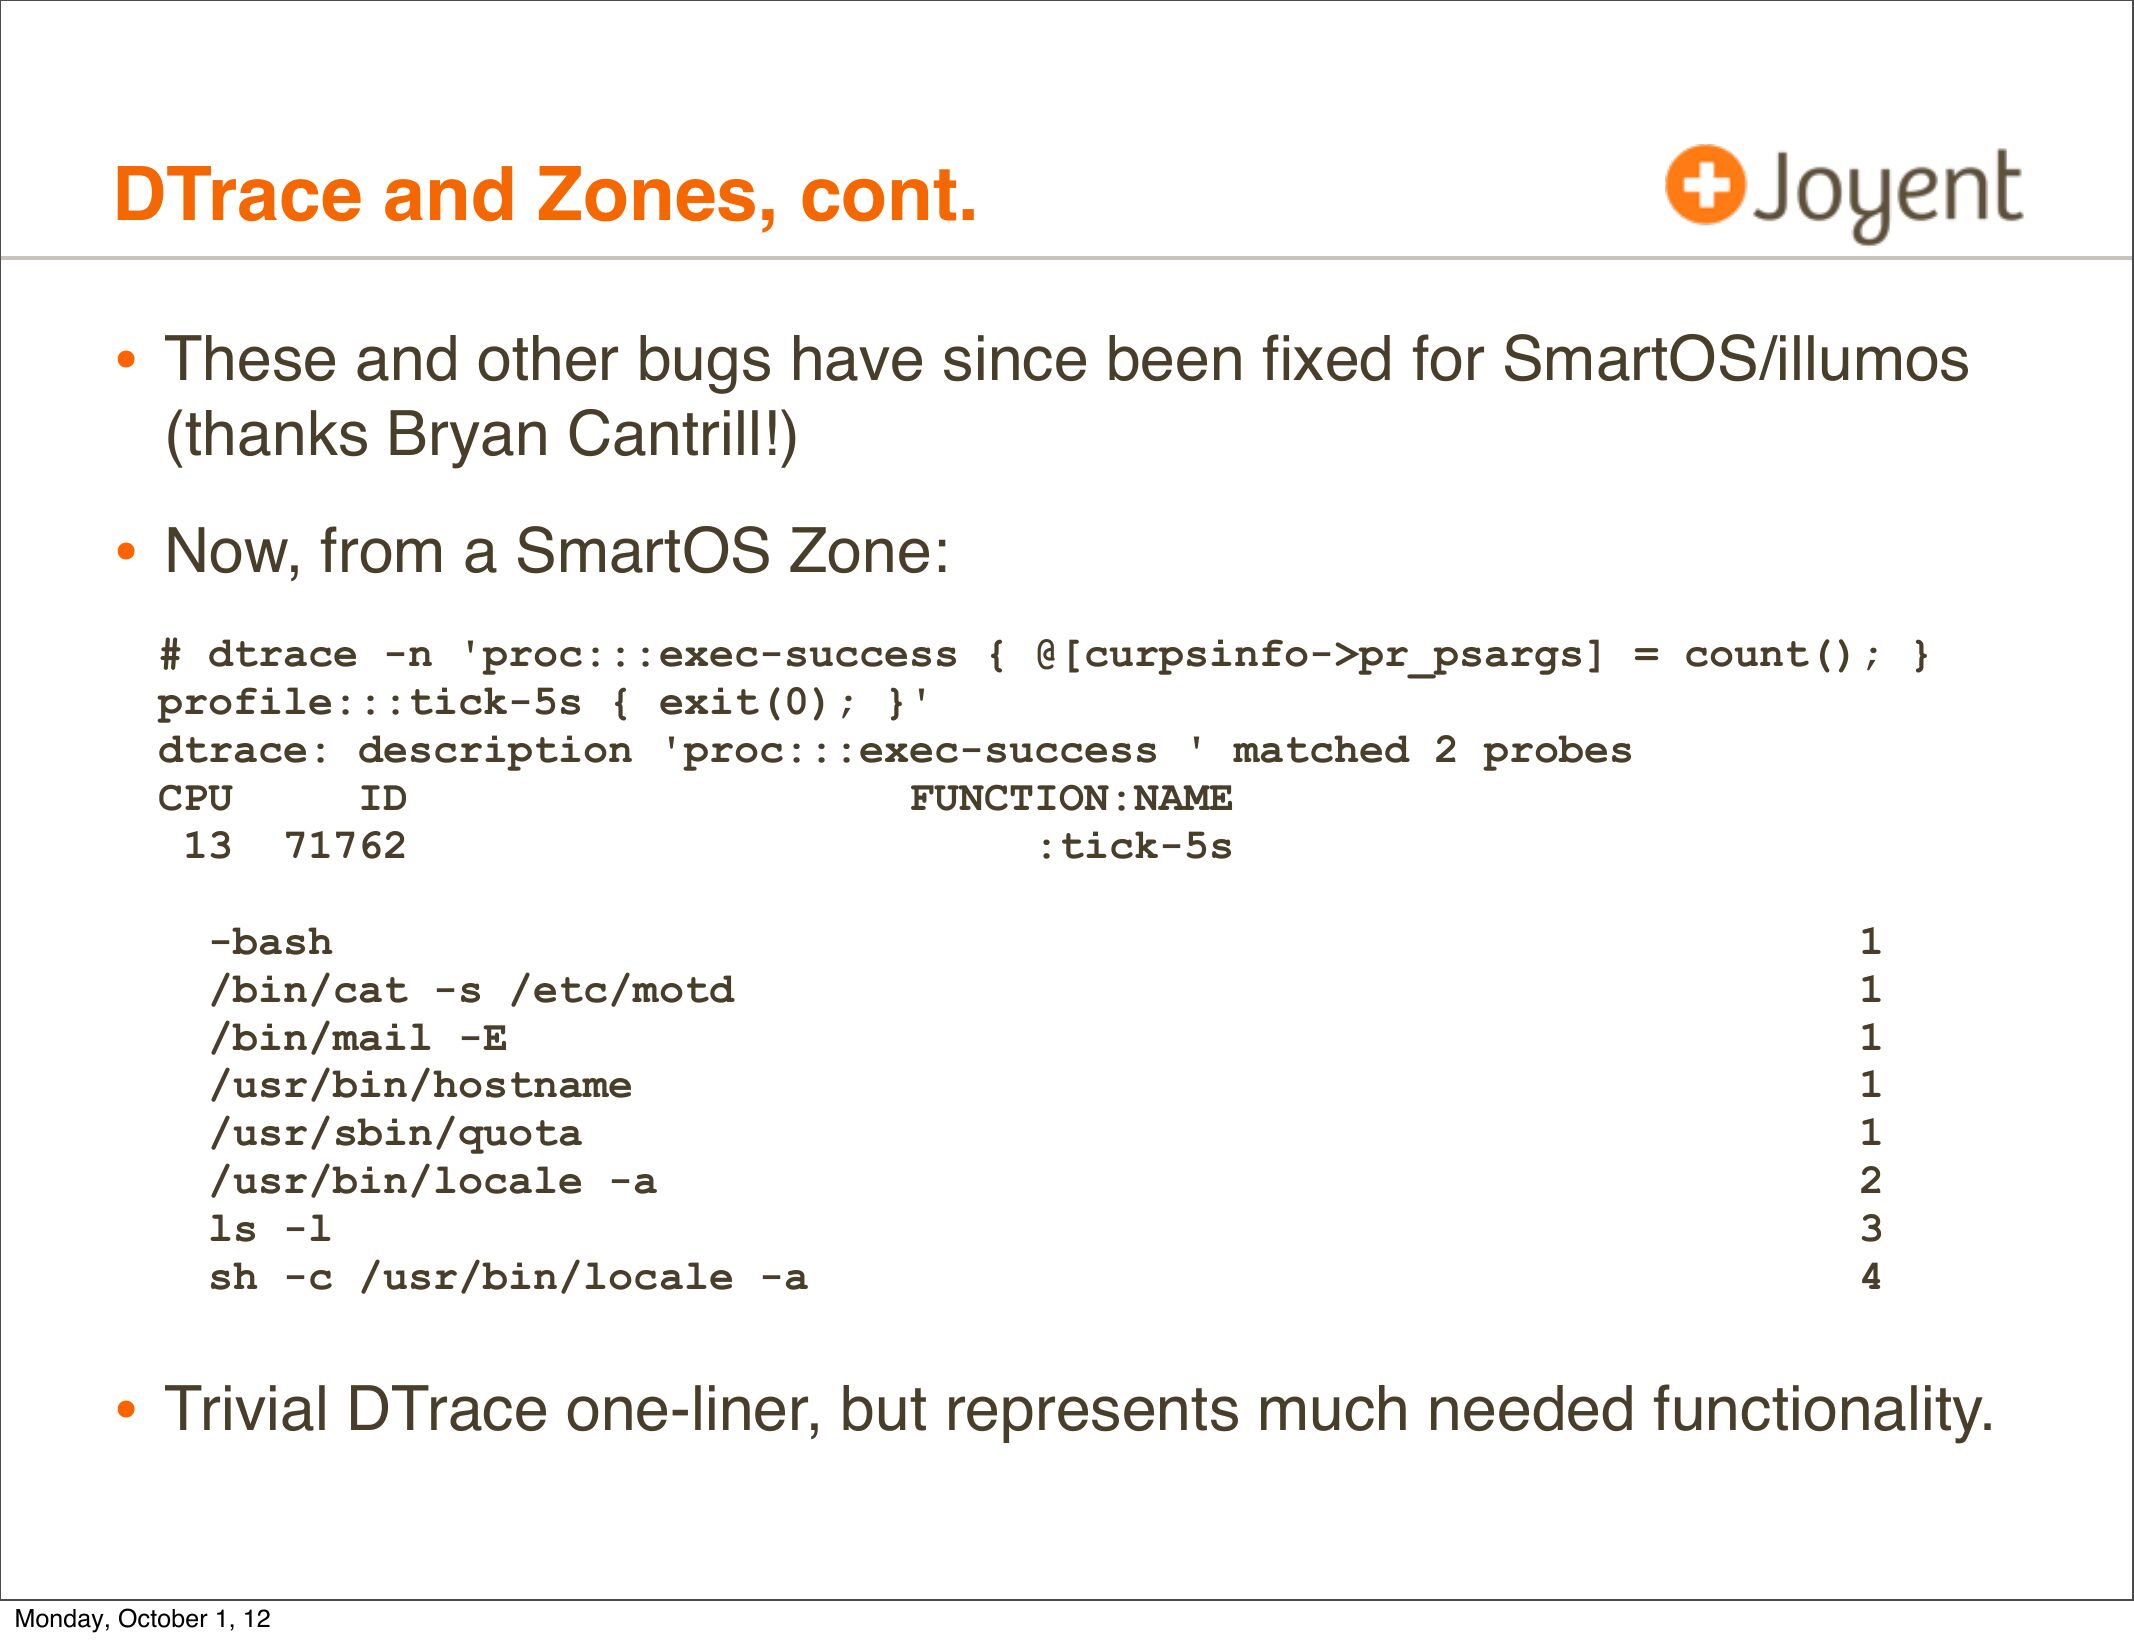
• These and other bugs have since been fixed for SmartOS/illumos
(thanks Bryan Cantrill!)
• Now, from a SmartOS Zone:
# dtrace -n 'proc:::exec-success { @[curpsinfo->gt;pr_psargs] = count(); }
profile:::tick-5s { exit(0); }'
dtrace: description 'proc:::exec-success ' matched 2 probes
CPU
FUNCTION:NAME
13 71762
:tick-5s
-bash
/bin/cat -s /etc/motd
/bin/mail -E
/usr/bin/hostname
/usr/sbin/quota
/usr/bin/locale -a
ls -l
sh -c /usr/bin/locale -a
• Trivial DTrace one-liner, but represents much needed functionality.
Monday, October 1, 12
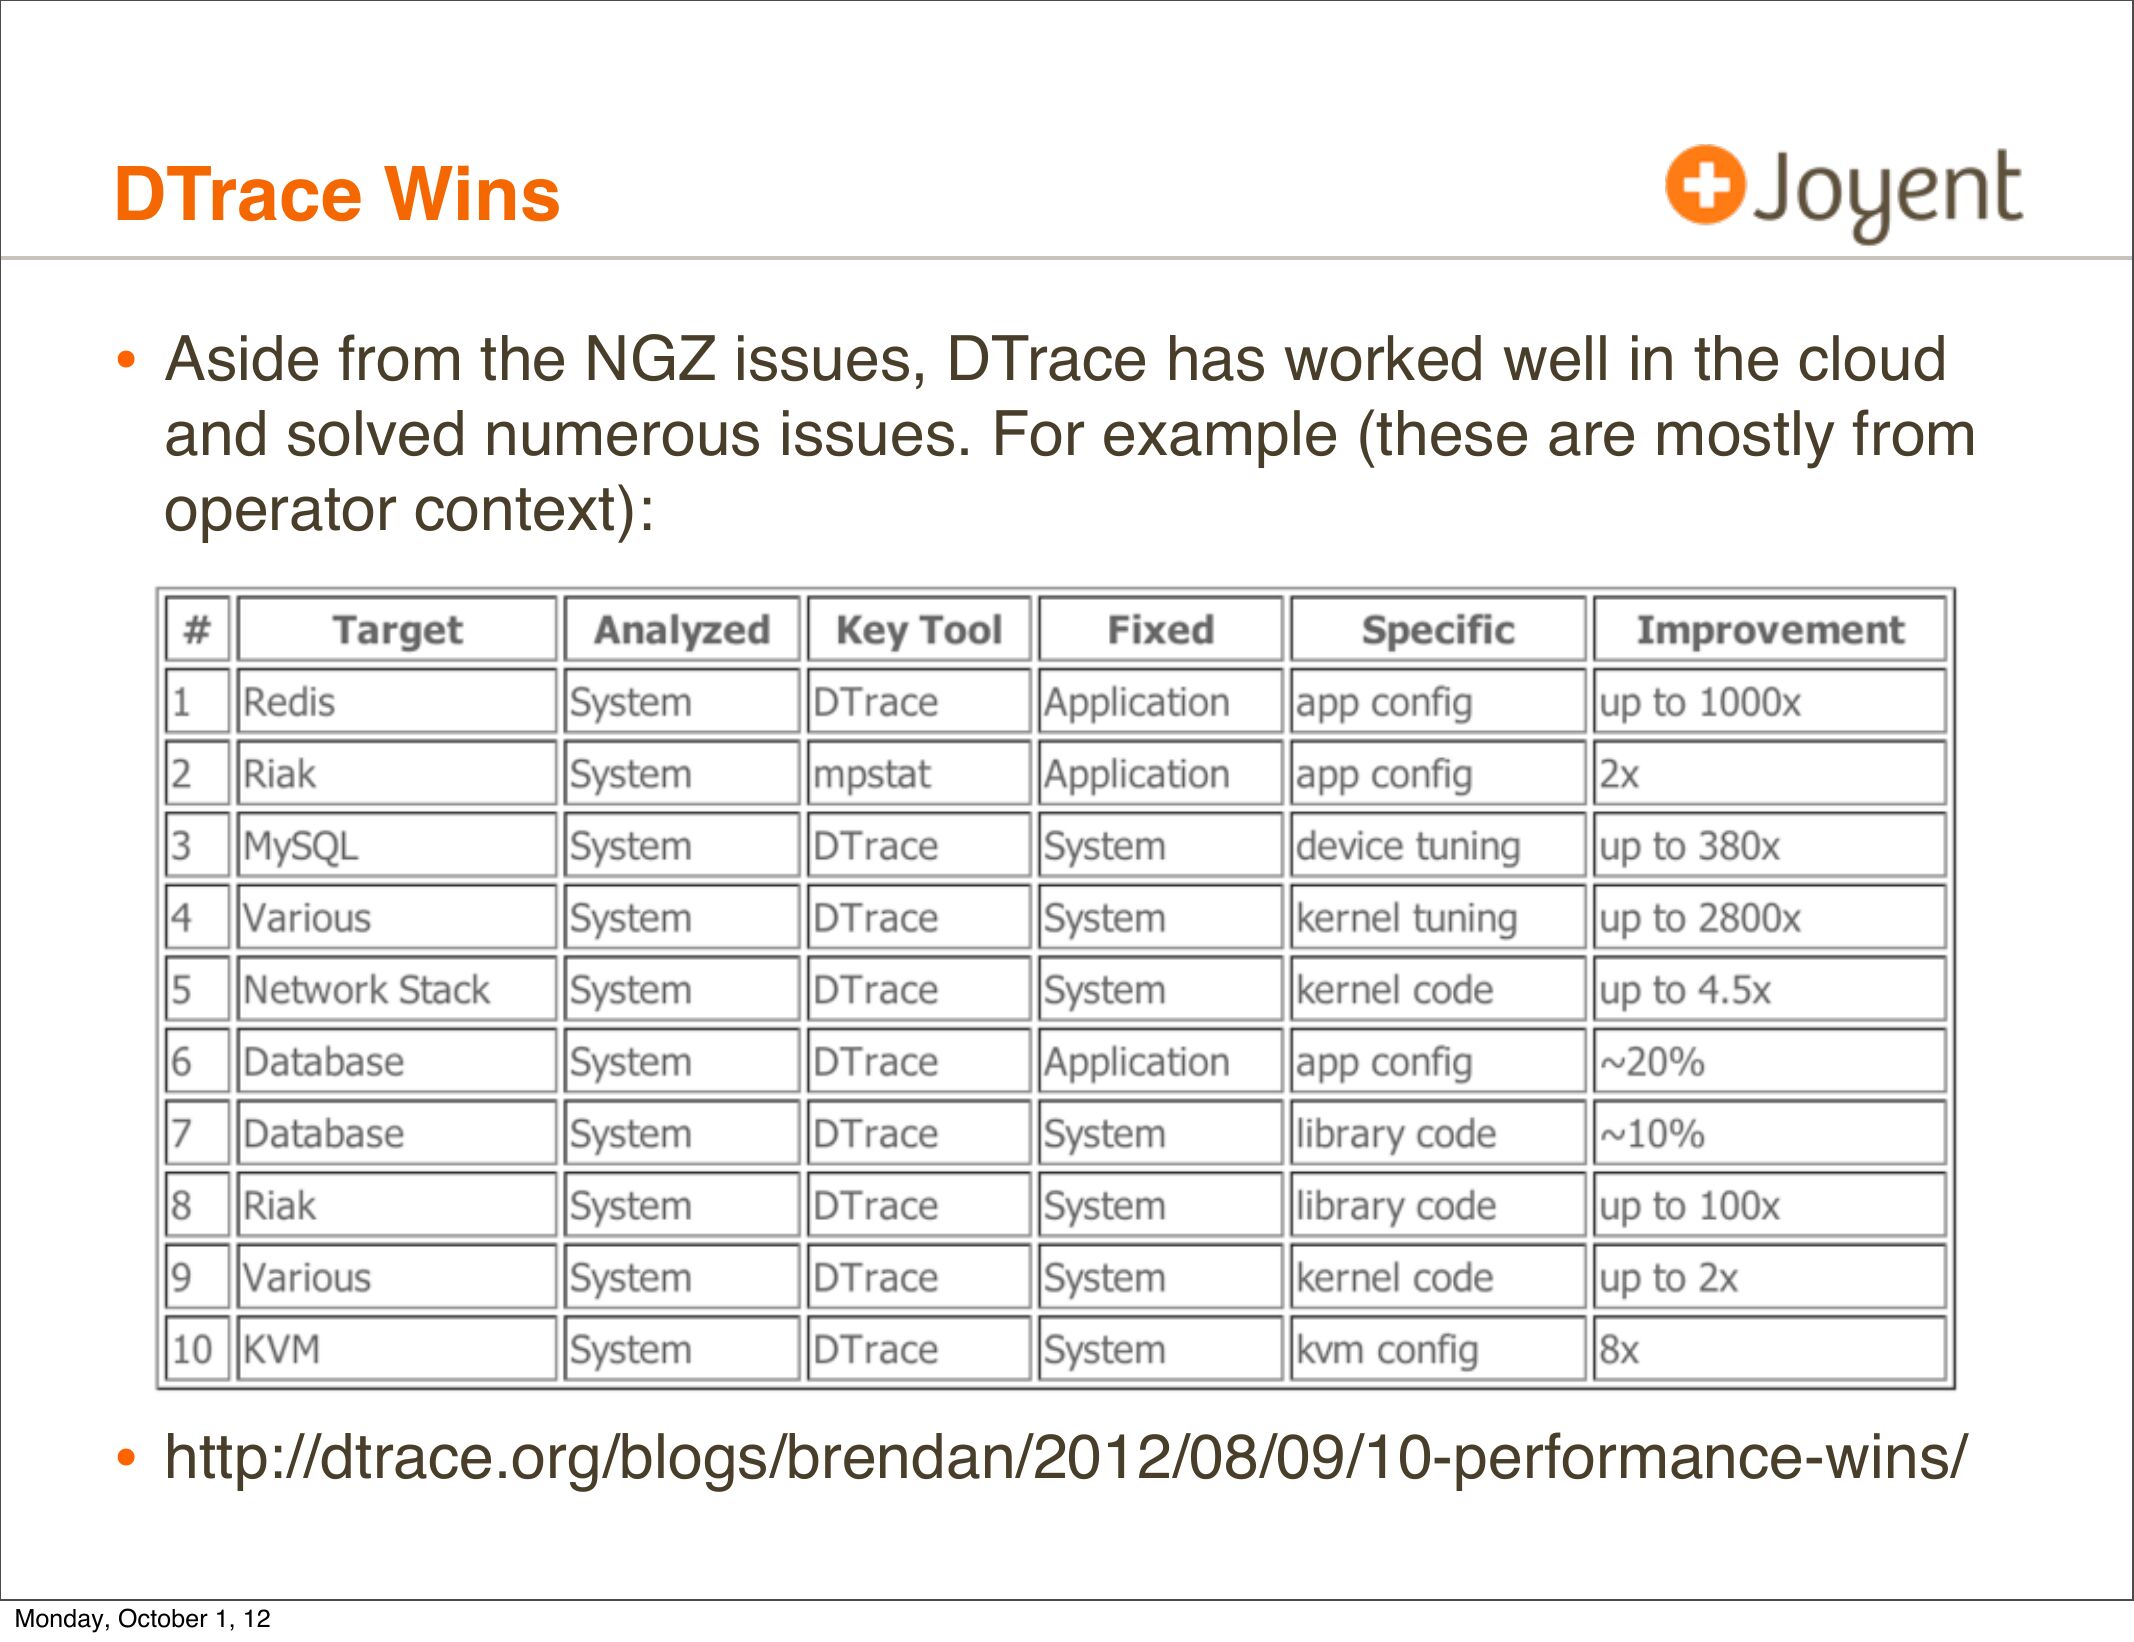
slide 32:DTrace Wins • Aside from the NGZ issues, DTrace has worked well in the cloud and solved numerous issues. For example (these are mostly from operator context): • http://dtrace.org/blogs/brendan/2012/08/09/10-performance-wins/ Monday, October 1, 12slide 33:
DTrace Wins, cont.
• Not surprising given DTrace’s visibility...
Monday, October 1, 12
slide 34:
DTrace Wins, cont.
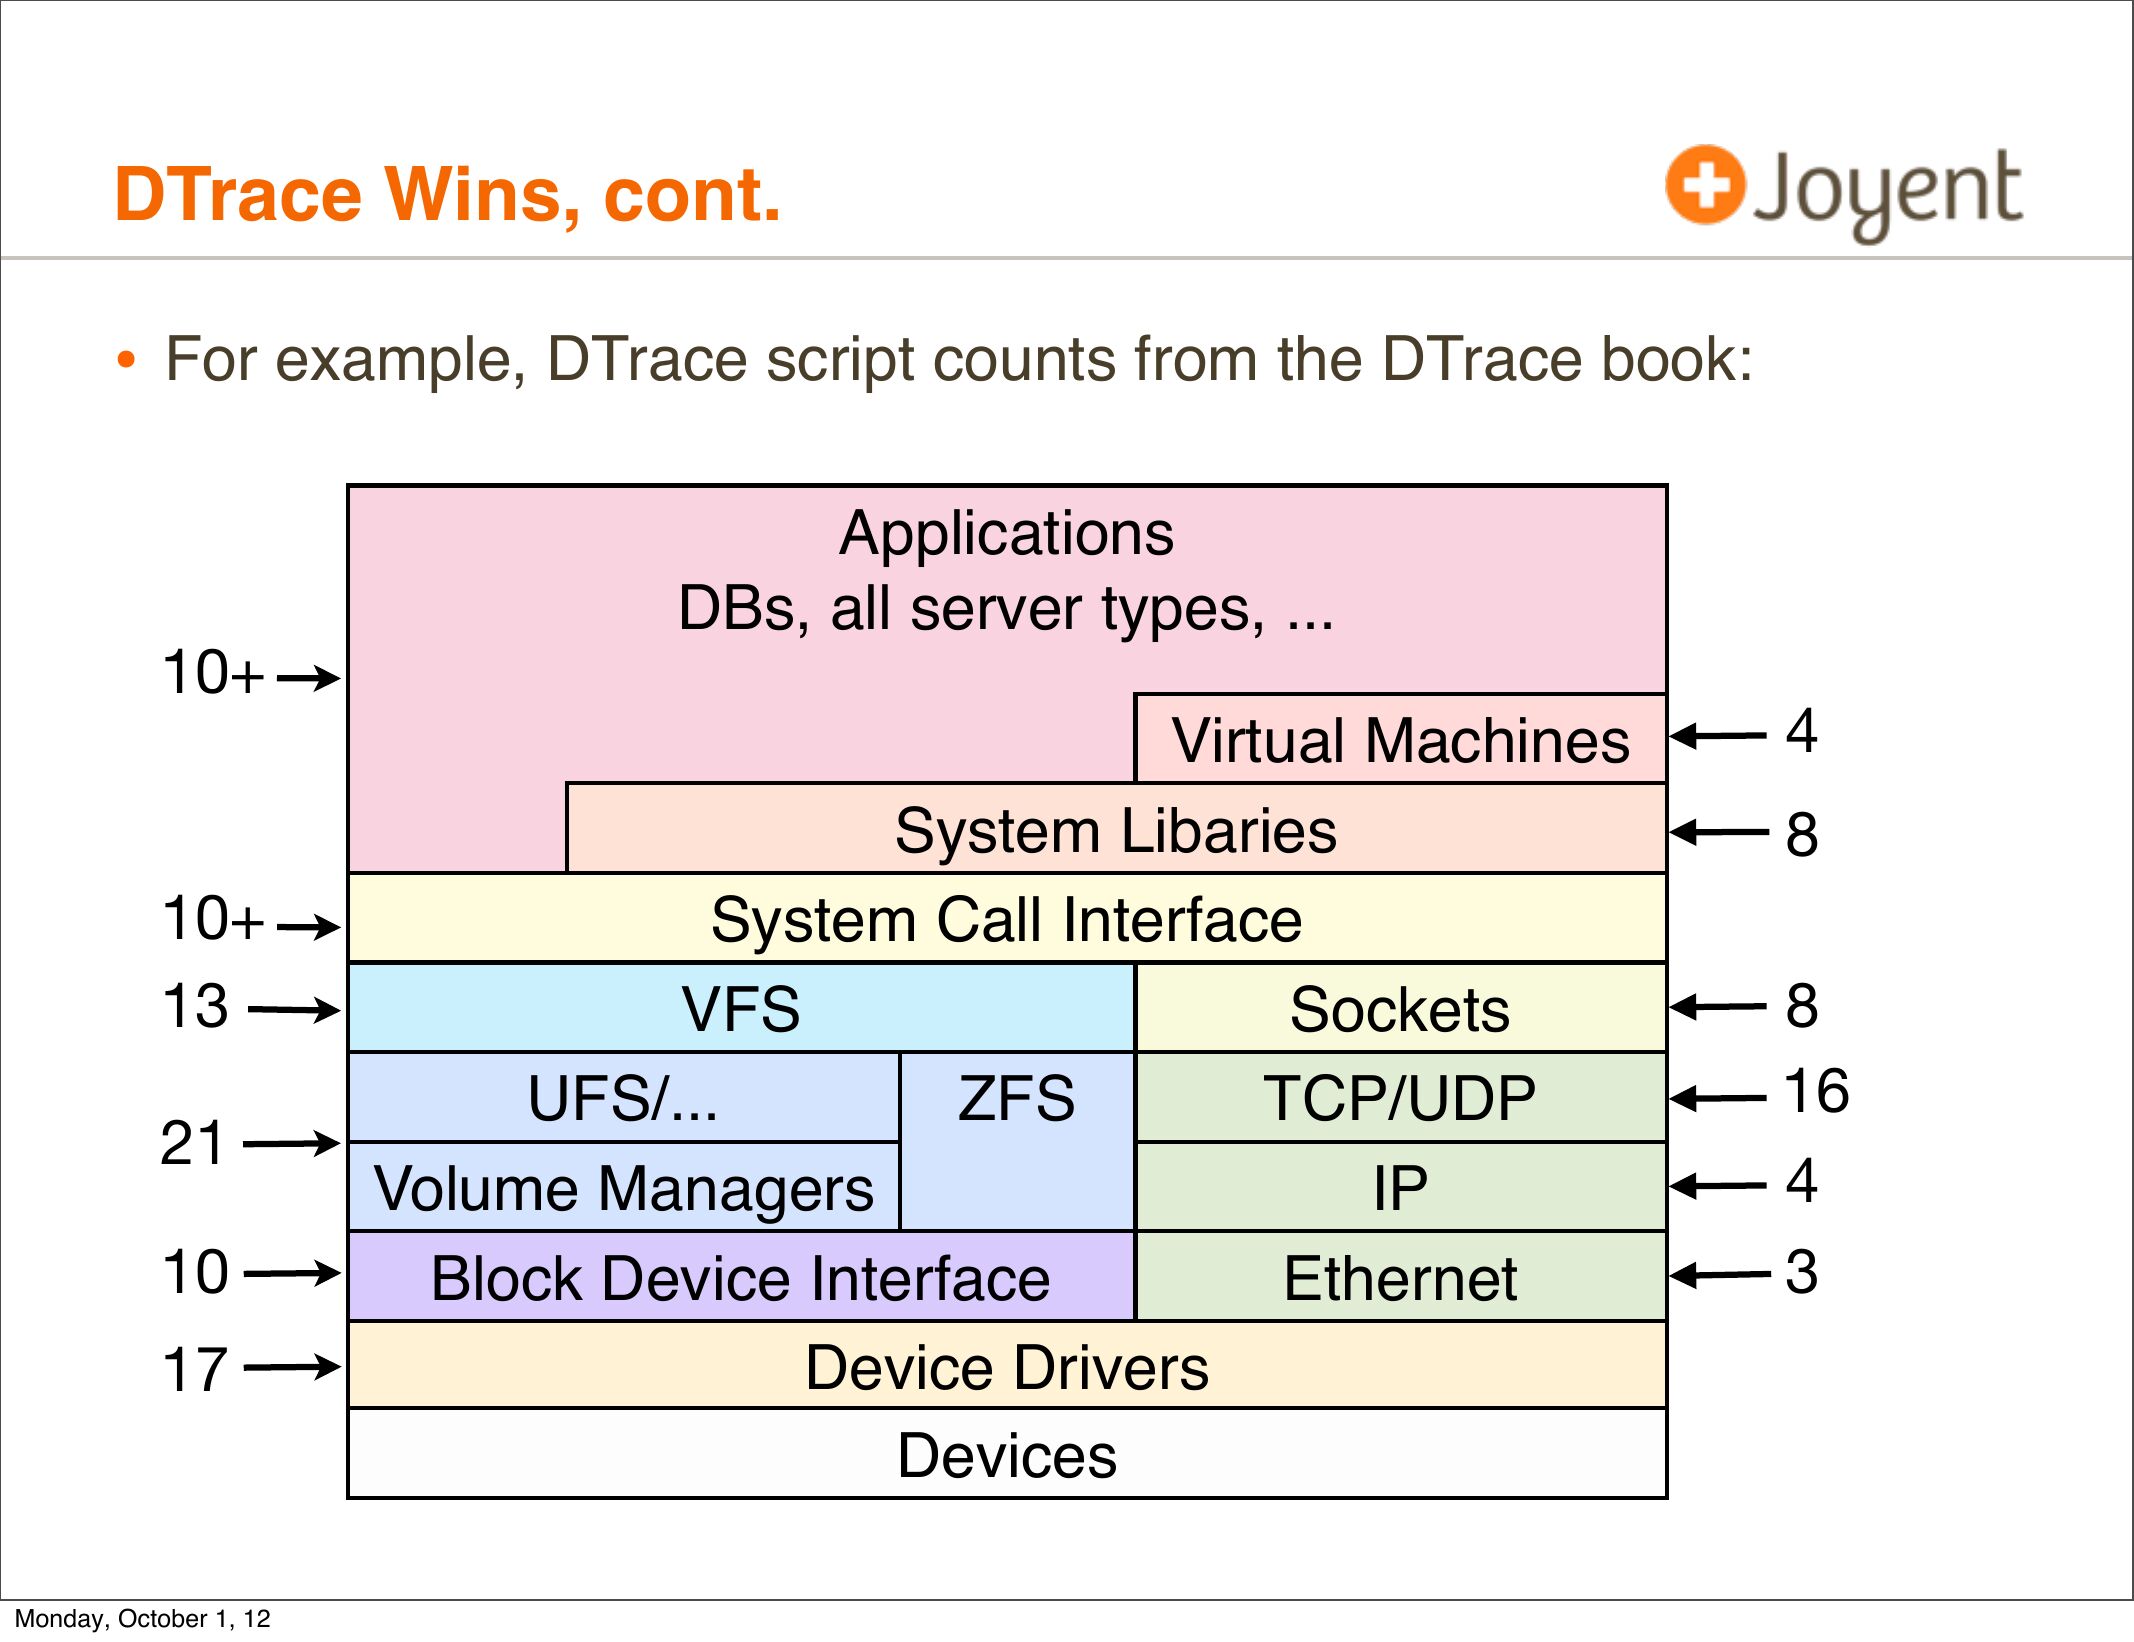
• For example, DTrace script counts from the DTrace book:
10+
10+
Monday, October 1, 12
Applications
DBs, all server types, ...
Virtual Machines
System Libaries
System Call Interface
VFS
Sockets
UFS/...
ZFS
TCP/UDP
Volume Managers
Block Device Interface
Ethernet
Device Drivers
Devices
slide 35:
Tools
Monday, October 1, 12
slide 36:
Ad-hoc
• Write DTrace scripts as needed
• Execute individually on hosts, or,
• With ah-hoc scripting, execute across all hosts (cloud)
• My ad-hoc tools include:
• DTrace Cloud Tools
• Flame Graphs
Monday, October 1, 12
slide 37:
Ad-hoc: DTrace Cloud Tools
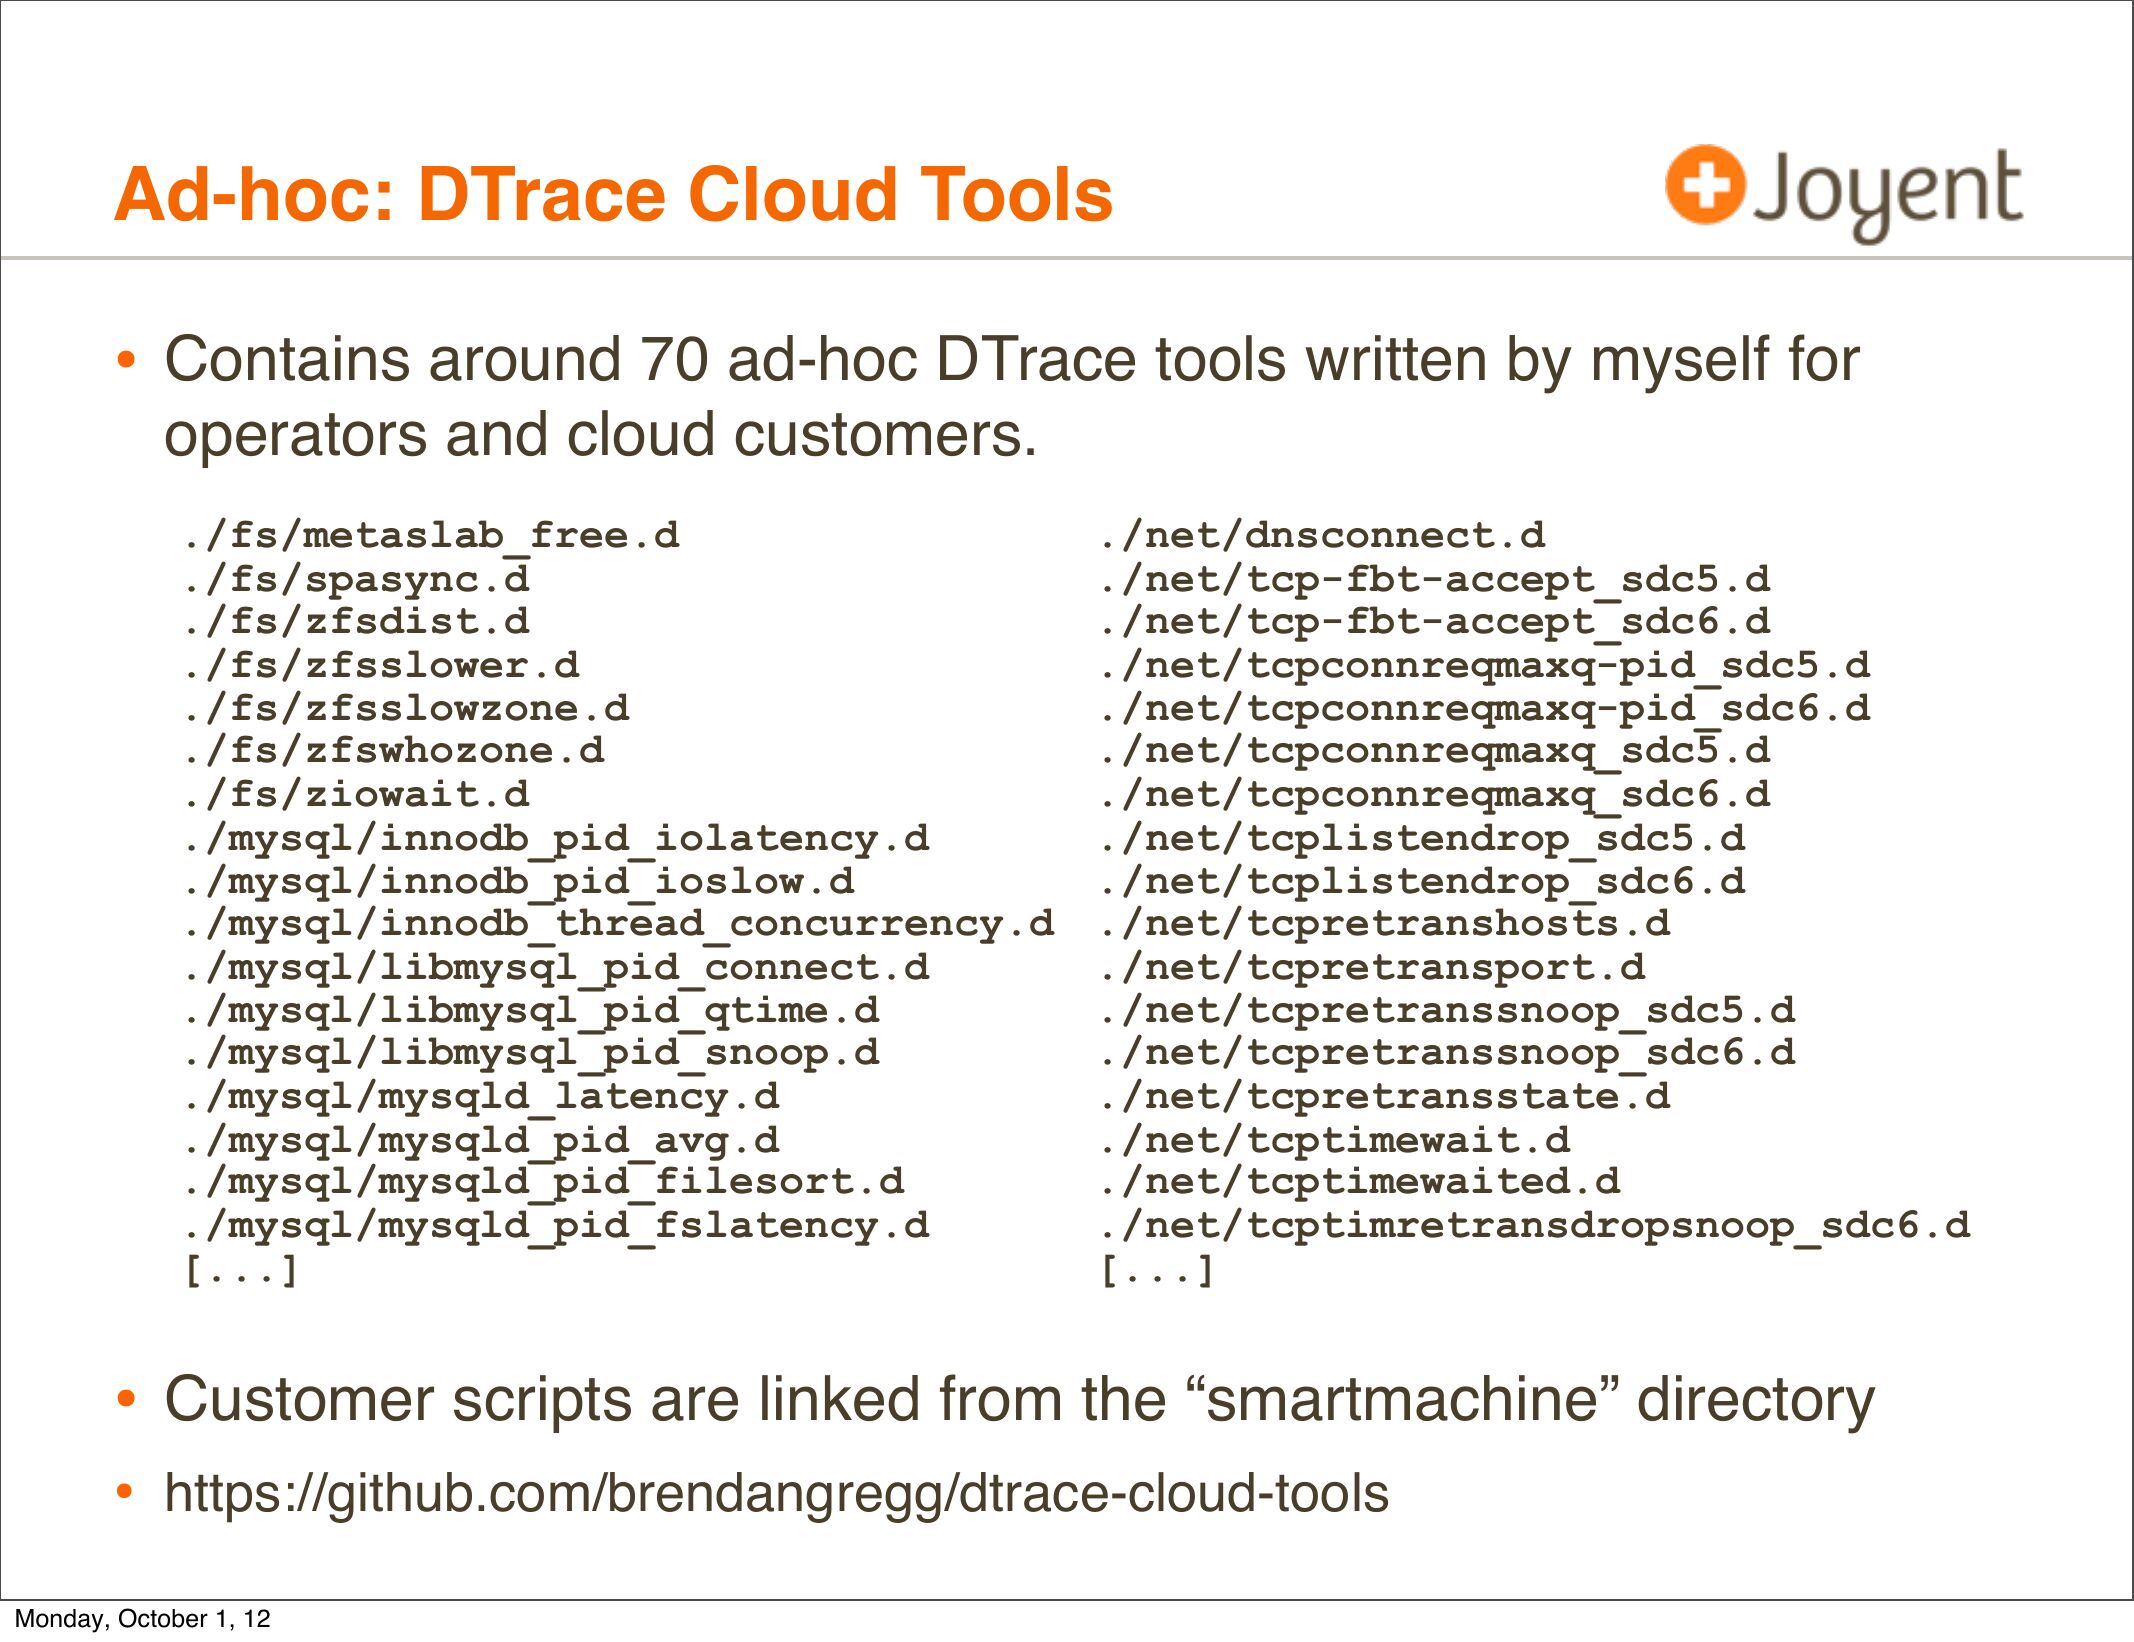
• Contains around 70 ad-hoc DTrace tools written by myself for
operators and cloud customers.
./fs/metaslab_free.d
./fs/spasync.d
./fs/zfsdist.d
./fs/zfsslower.d
./fs/zfsslowzone.d
./fs/zfswhozone.d
./fs/ziowait.d
./mysql/innodb_pid_iolatency.d
./mysql/innodb_pid_ioslow.d
./mysql/innodb_thread_concurrency.d
./mysql/libmysql_pid_connect.d
./mysql/libmysql_pid_qtime.d
./mysql/libmysql_pid_snoop.d
./mysql/mysqld_latency.d
./mysql/mysqld_pid_avg.d
./mysql/mysqld_pid_filesort.d
./mysql/mysqld_pid_fslatency.d
[...]
./net/dnsconnect.d
./net/tcp-fbt-accept_sdc5.d
./net/tcp-fbt-accept_sdc6.d
./net/tcpconnreqmaxq-pid_sdc5.d
./net/tcpconnreqmaxq-pid_sdc6.d
./net/tcpconnreqmaxq_sdc5.d
./net/tcpconnreqmaxq_sdc6.d
./net/tcplistendrop_sdc5.d
./net/tcplistendrop_sdc6.d
./net/tcpretranshosts.d
./net/tcpretransport.d
./net/tcpretranssnoop_sdc5.d
./net/tcpretranssnoop_sdc6.d
./net/tcpretransstate.d
./net/tcptimewait.d
./net/tcptimewaited.d
./net/tcptimretransdropsnoop_sdc6.d
[...]
• Customer scripts are linked from the “smartmachine” directory
• https://github.com/brendangregg/dtrace-cloud-tools
Monday, October 1, 12
slide 38:
Ad-hoc: DTrace Cloud Tools, cont.
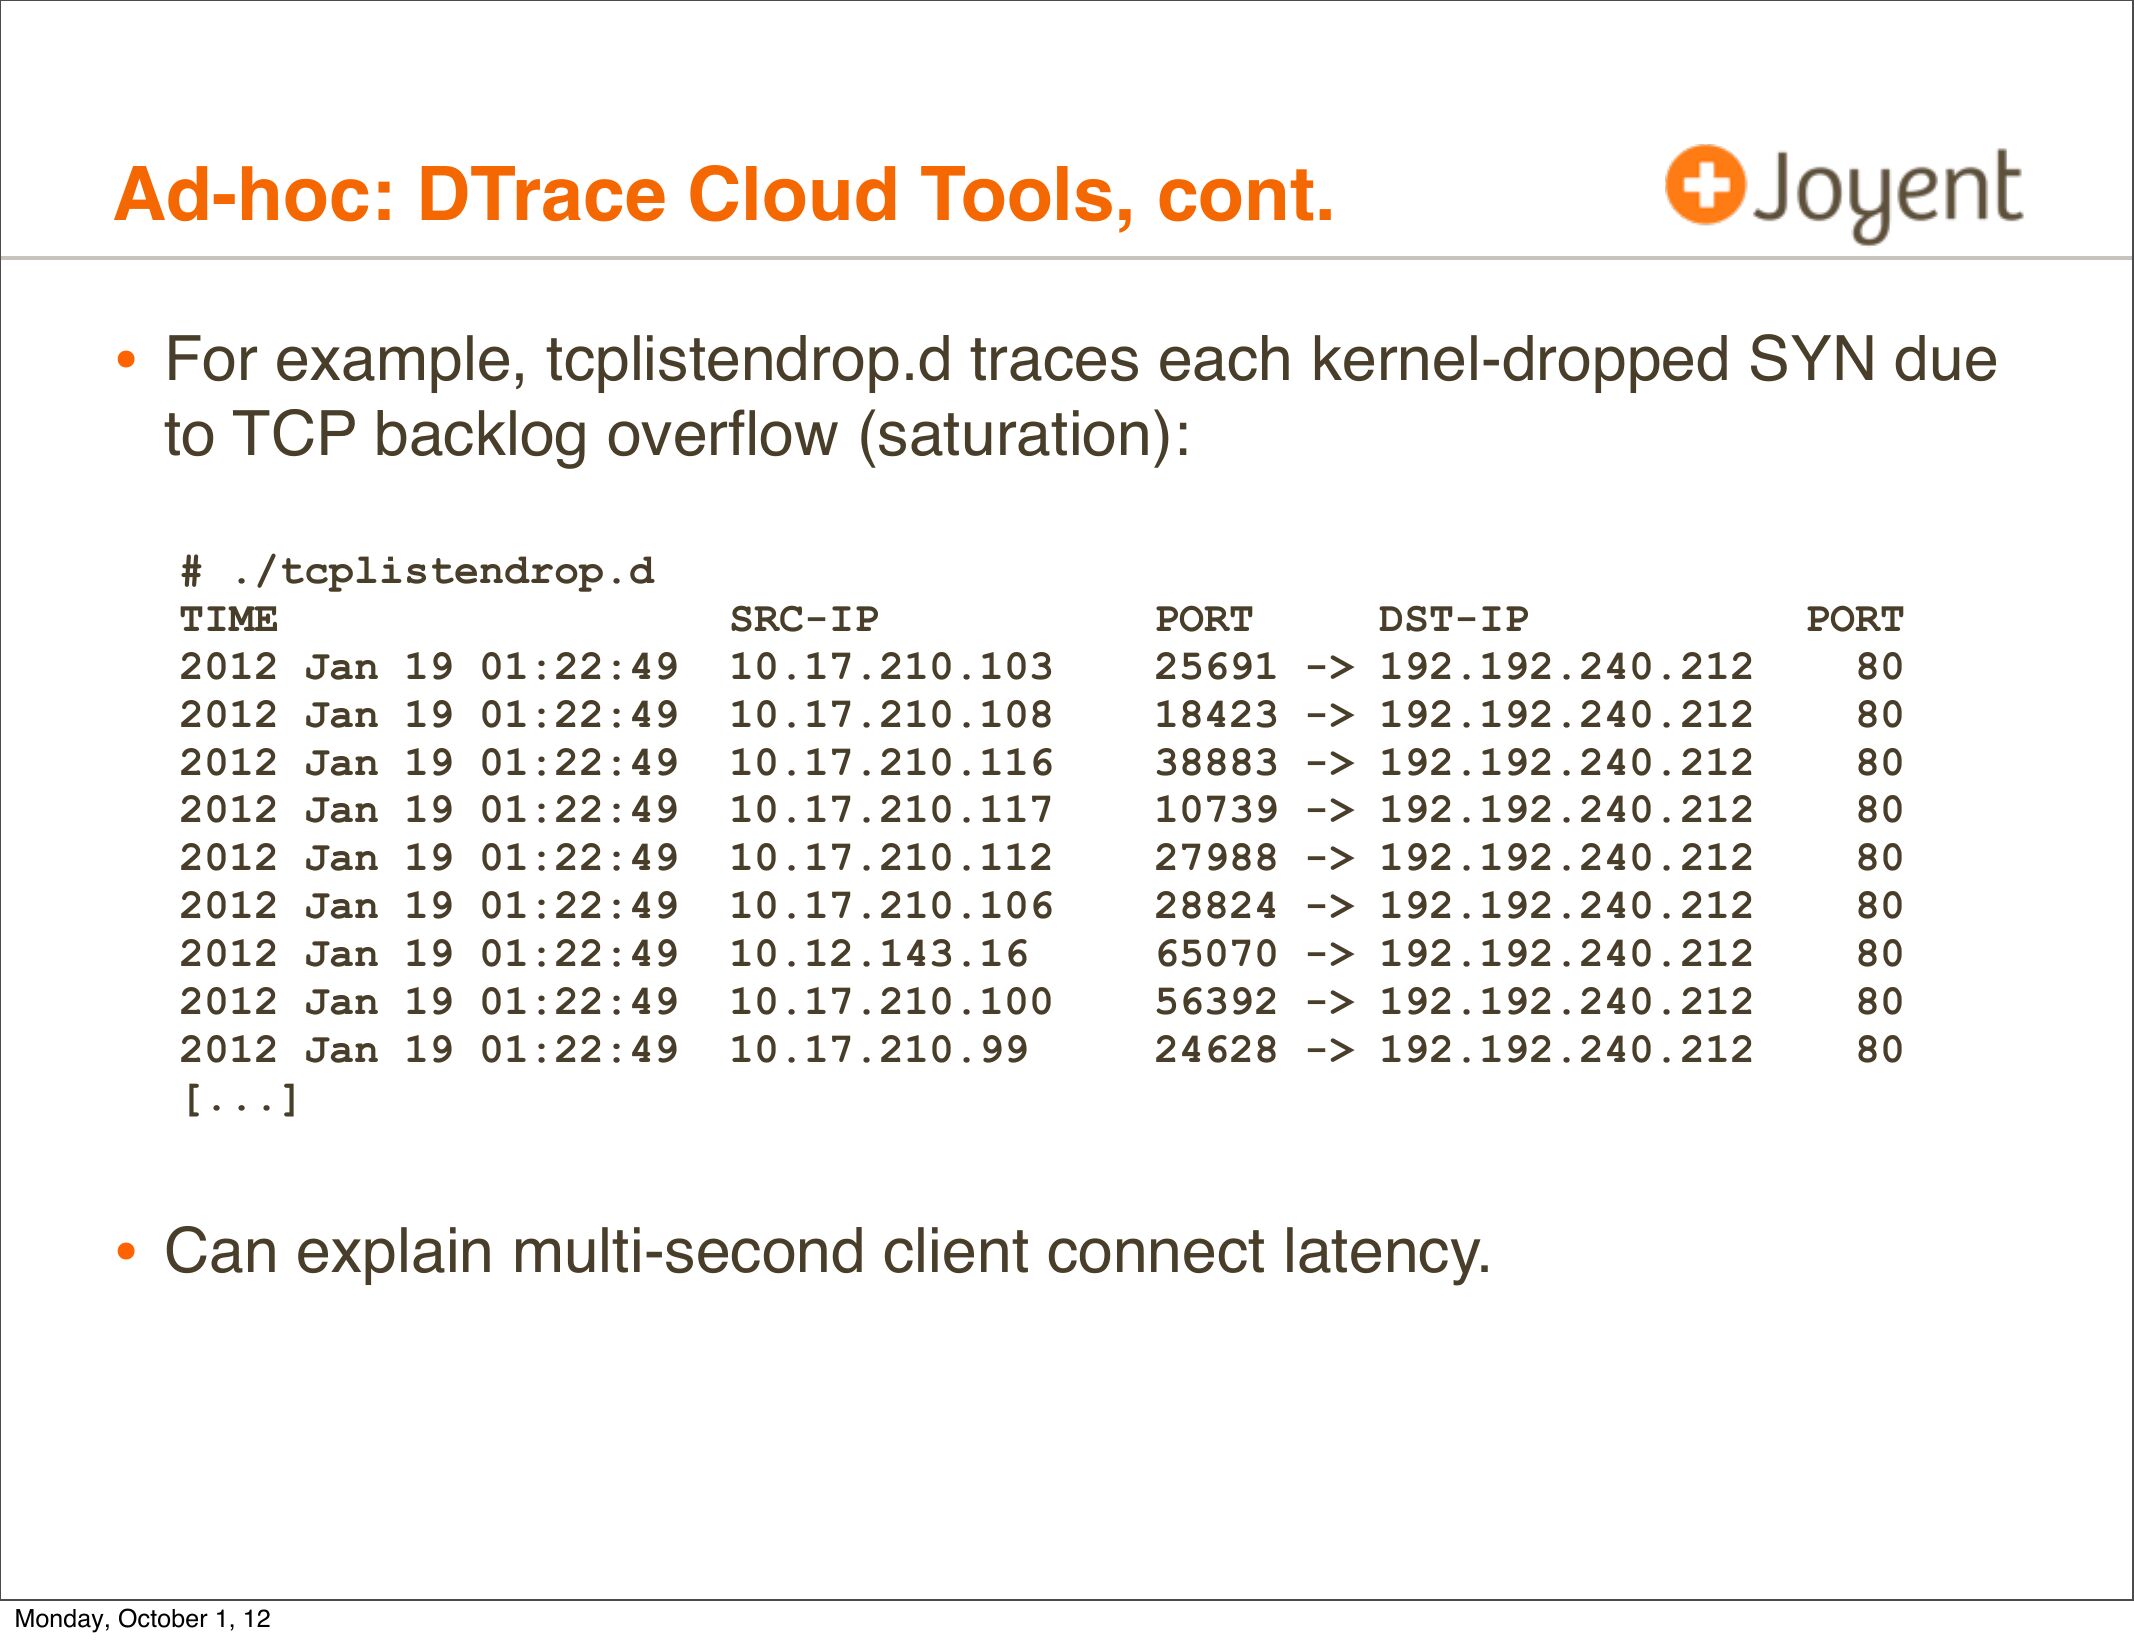
• For example, tcplistendrop.d traces each kernel-dropped SYN due
to TCP backlog overflow (saturation):
# ./tcplistendrop.d
TIME
2012 Jan 19 01:22:49
2012 Jan 19 01:22:49
2012 Jan 19 01:22:49
2012 Jan 19 01:22:49
2012 Jan 19 01:22:49
2012 Jan 19 01:22:49
2012 Jan 19 01:22:49
2012 Jan 19 01:22:49
2012 Jan 19 01:22:49
[...]
SRC-IP
PORT
DST-IP
25691 ->gt; 192.192.240.212
18423 ->gt; 192.192.240.212
38883 ->gt; 192.192.240.212
10739 ->gt; 192.192.240.212
27988 ->gt; 192.192.240.212
28824 ->gt; 192.192.240.212
65070 ->gt; 192.192.240.212
56392 ->gt; 192.192.240.212
24628 ->gt; 192.192.240.212
• Can explain multi-second client connect latency.
Monday, October 1, 12
PORT
slide 39:
Ad-hoc: DTrace Cloud Tools, cont.
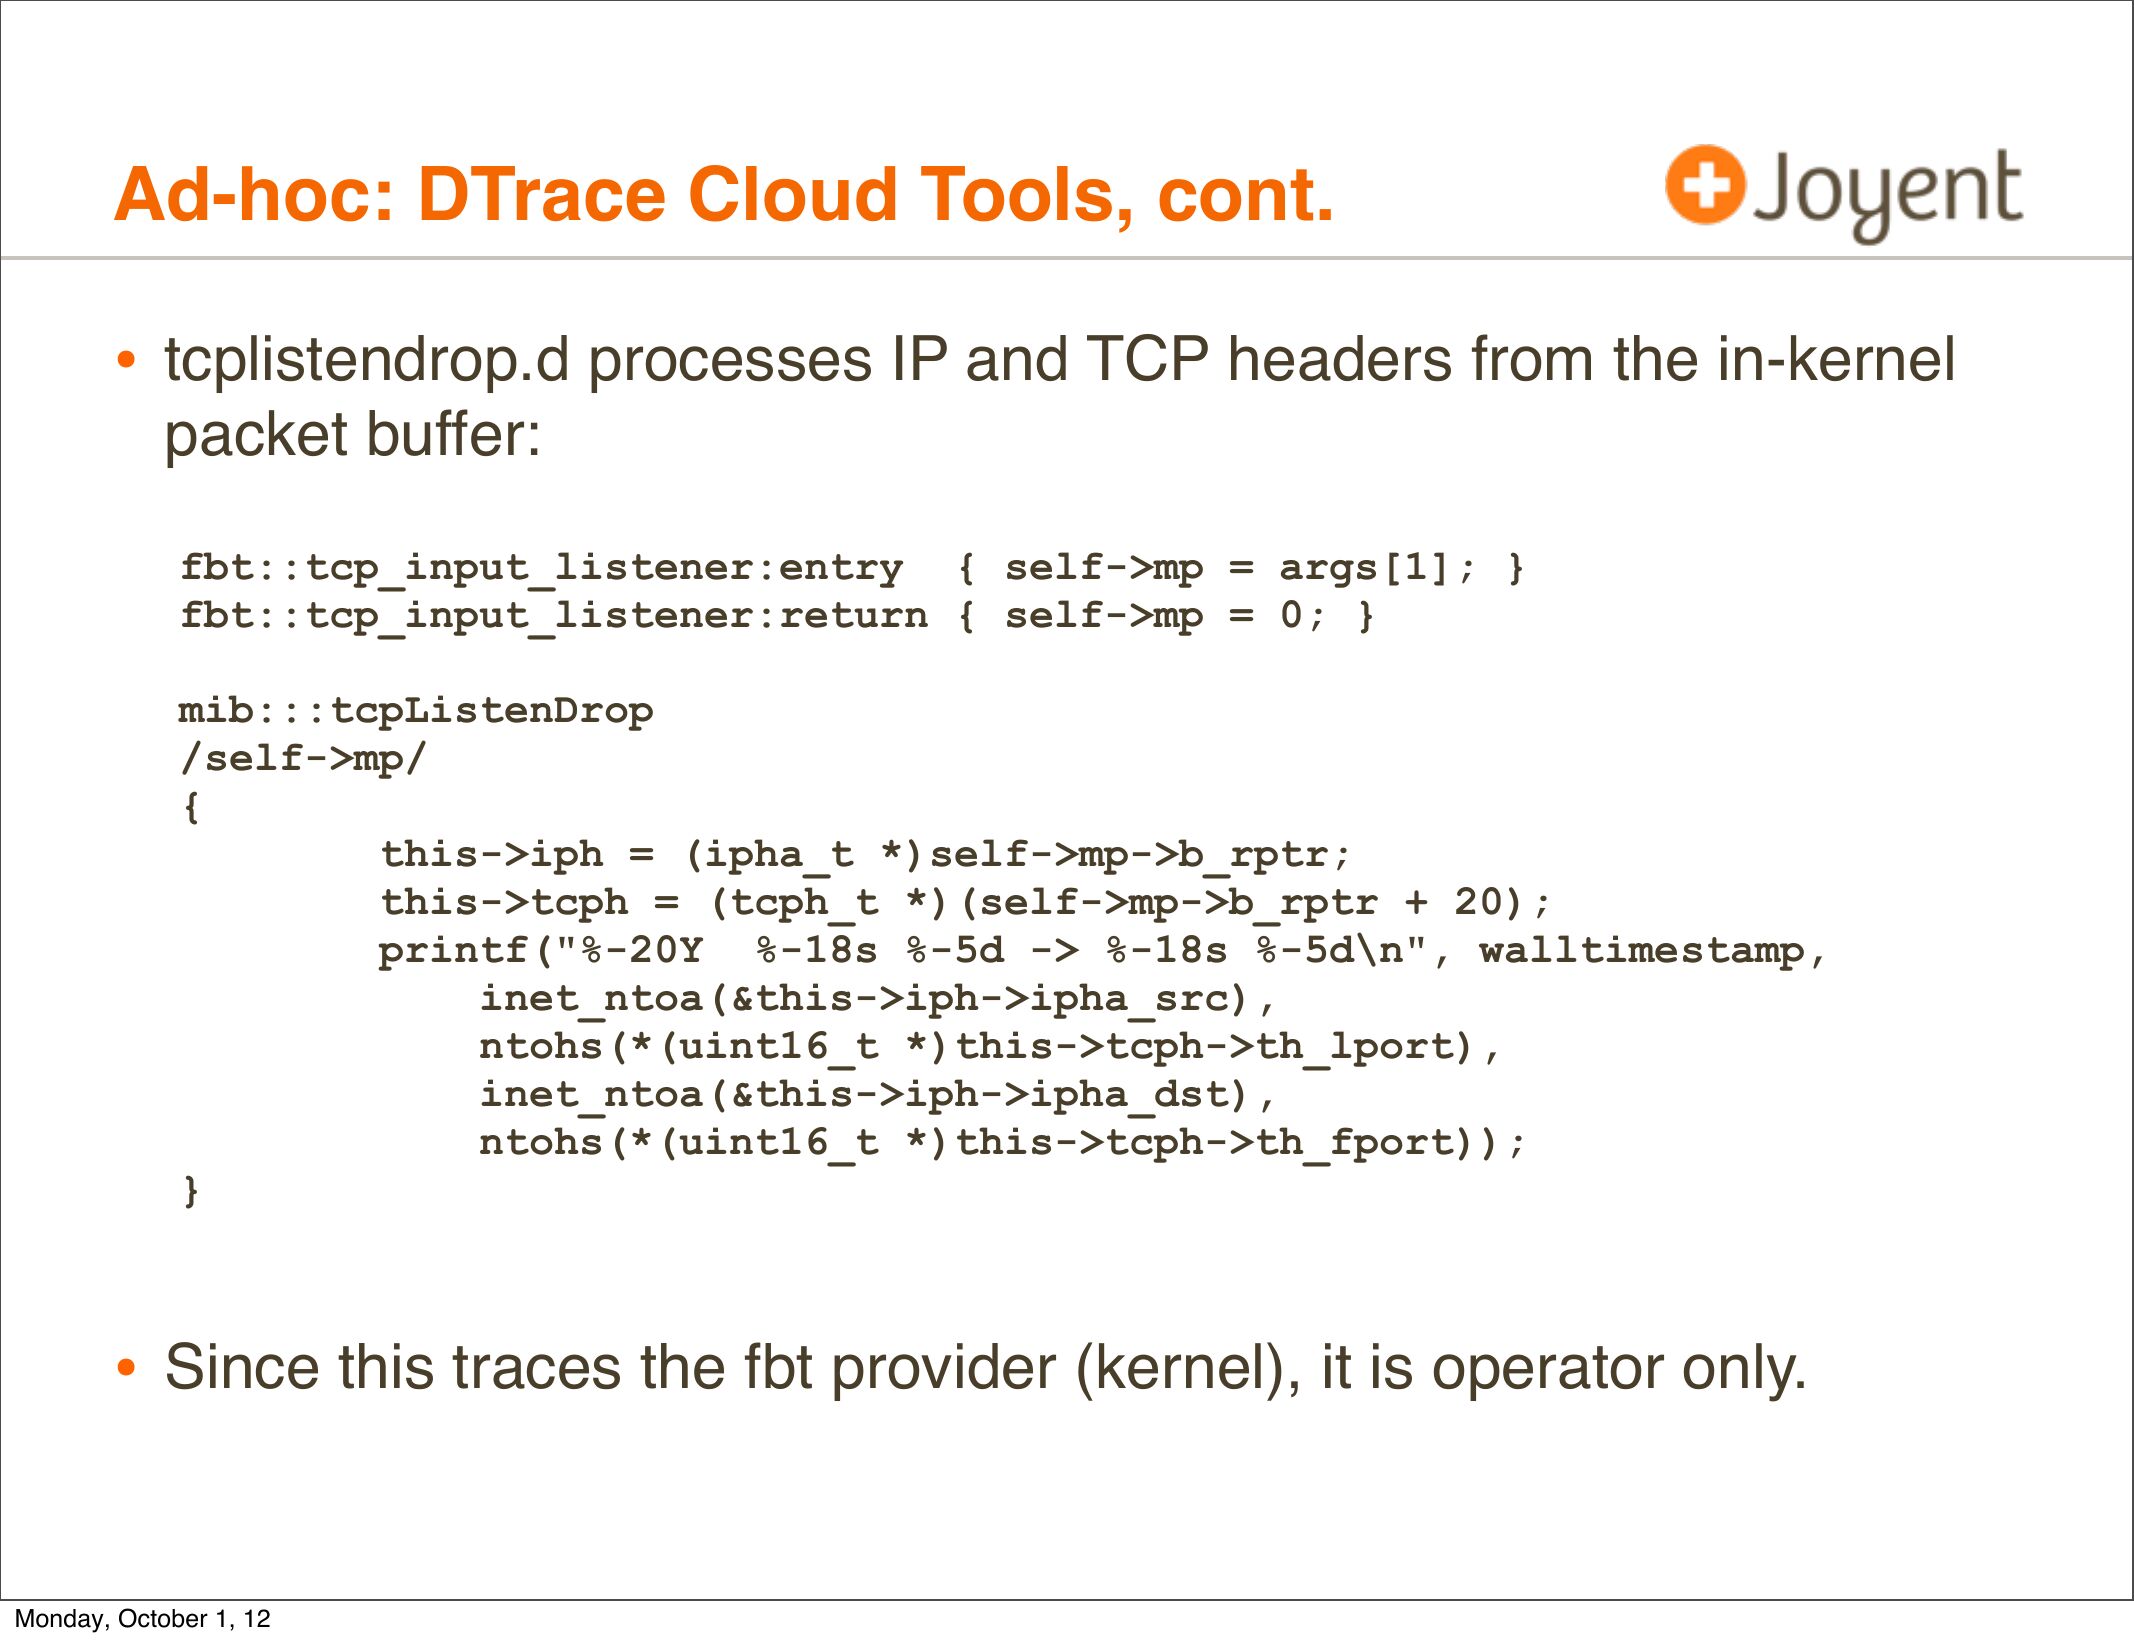
• tcplistendrop.d processes IP and TCP headers from the in-kernel
packet buffer:
fbt::tcp_input_listener:entry { self->gt;mp = args[1]; }
fbt::tcp_input_listener:return { self->gt;mp = 0; }
mib:::tcpListenDrop
/self->gt;mp/
this->gt;iph = (ipha_t *)self->gt;mp->gt;b_rptr;
this->gt;tcph = (tcph_t *)(self->gt;mp->gt;b_rptr + 20);
printf("%-20Y %-18s %-5d ->gt; %-18s %-5d\n", walltimestamp,
inet_ntoa(&this->gt;iph->gt;ipha_src),
ntohs(*(uint16_t *)this->gt;tcph->gt;th_lport),
inet_ntoa(&this->gt;iph->gt;ipha_dst),
ntohs(*(uint16_t *)this->gt;tcph->gt;th_fport));
• Since this traces the fbt provider (kernel), it is operator only.
Monday, October 1, 12
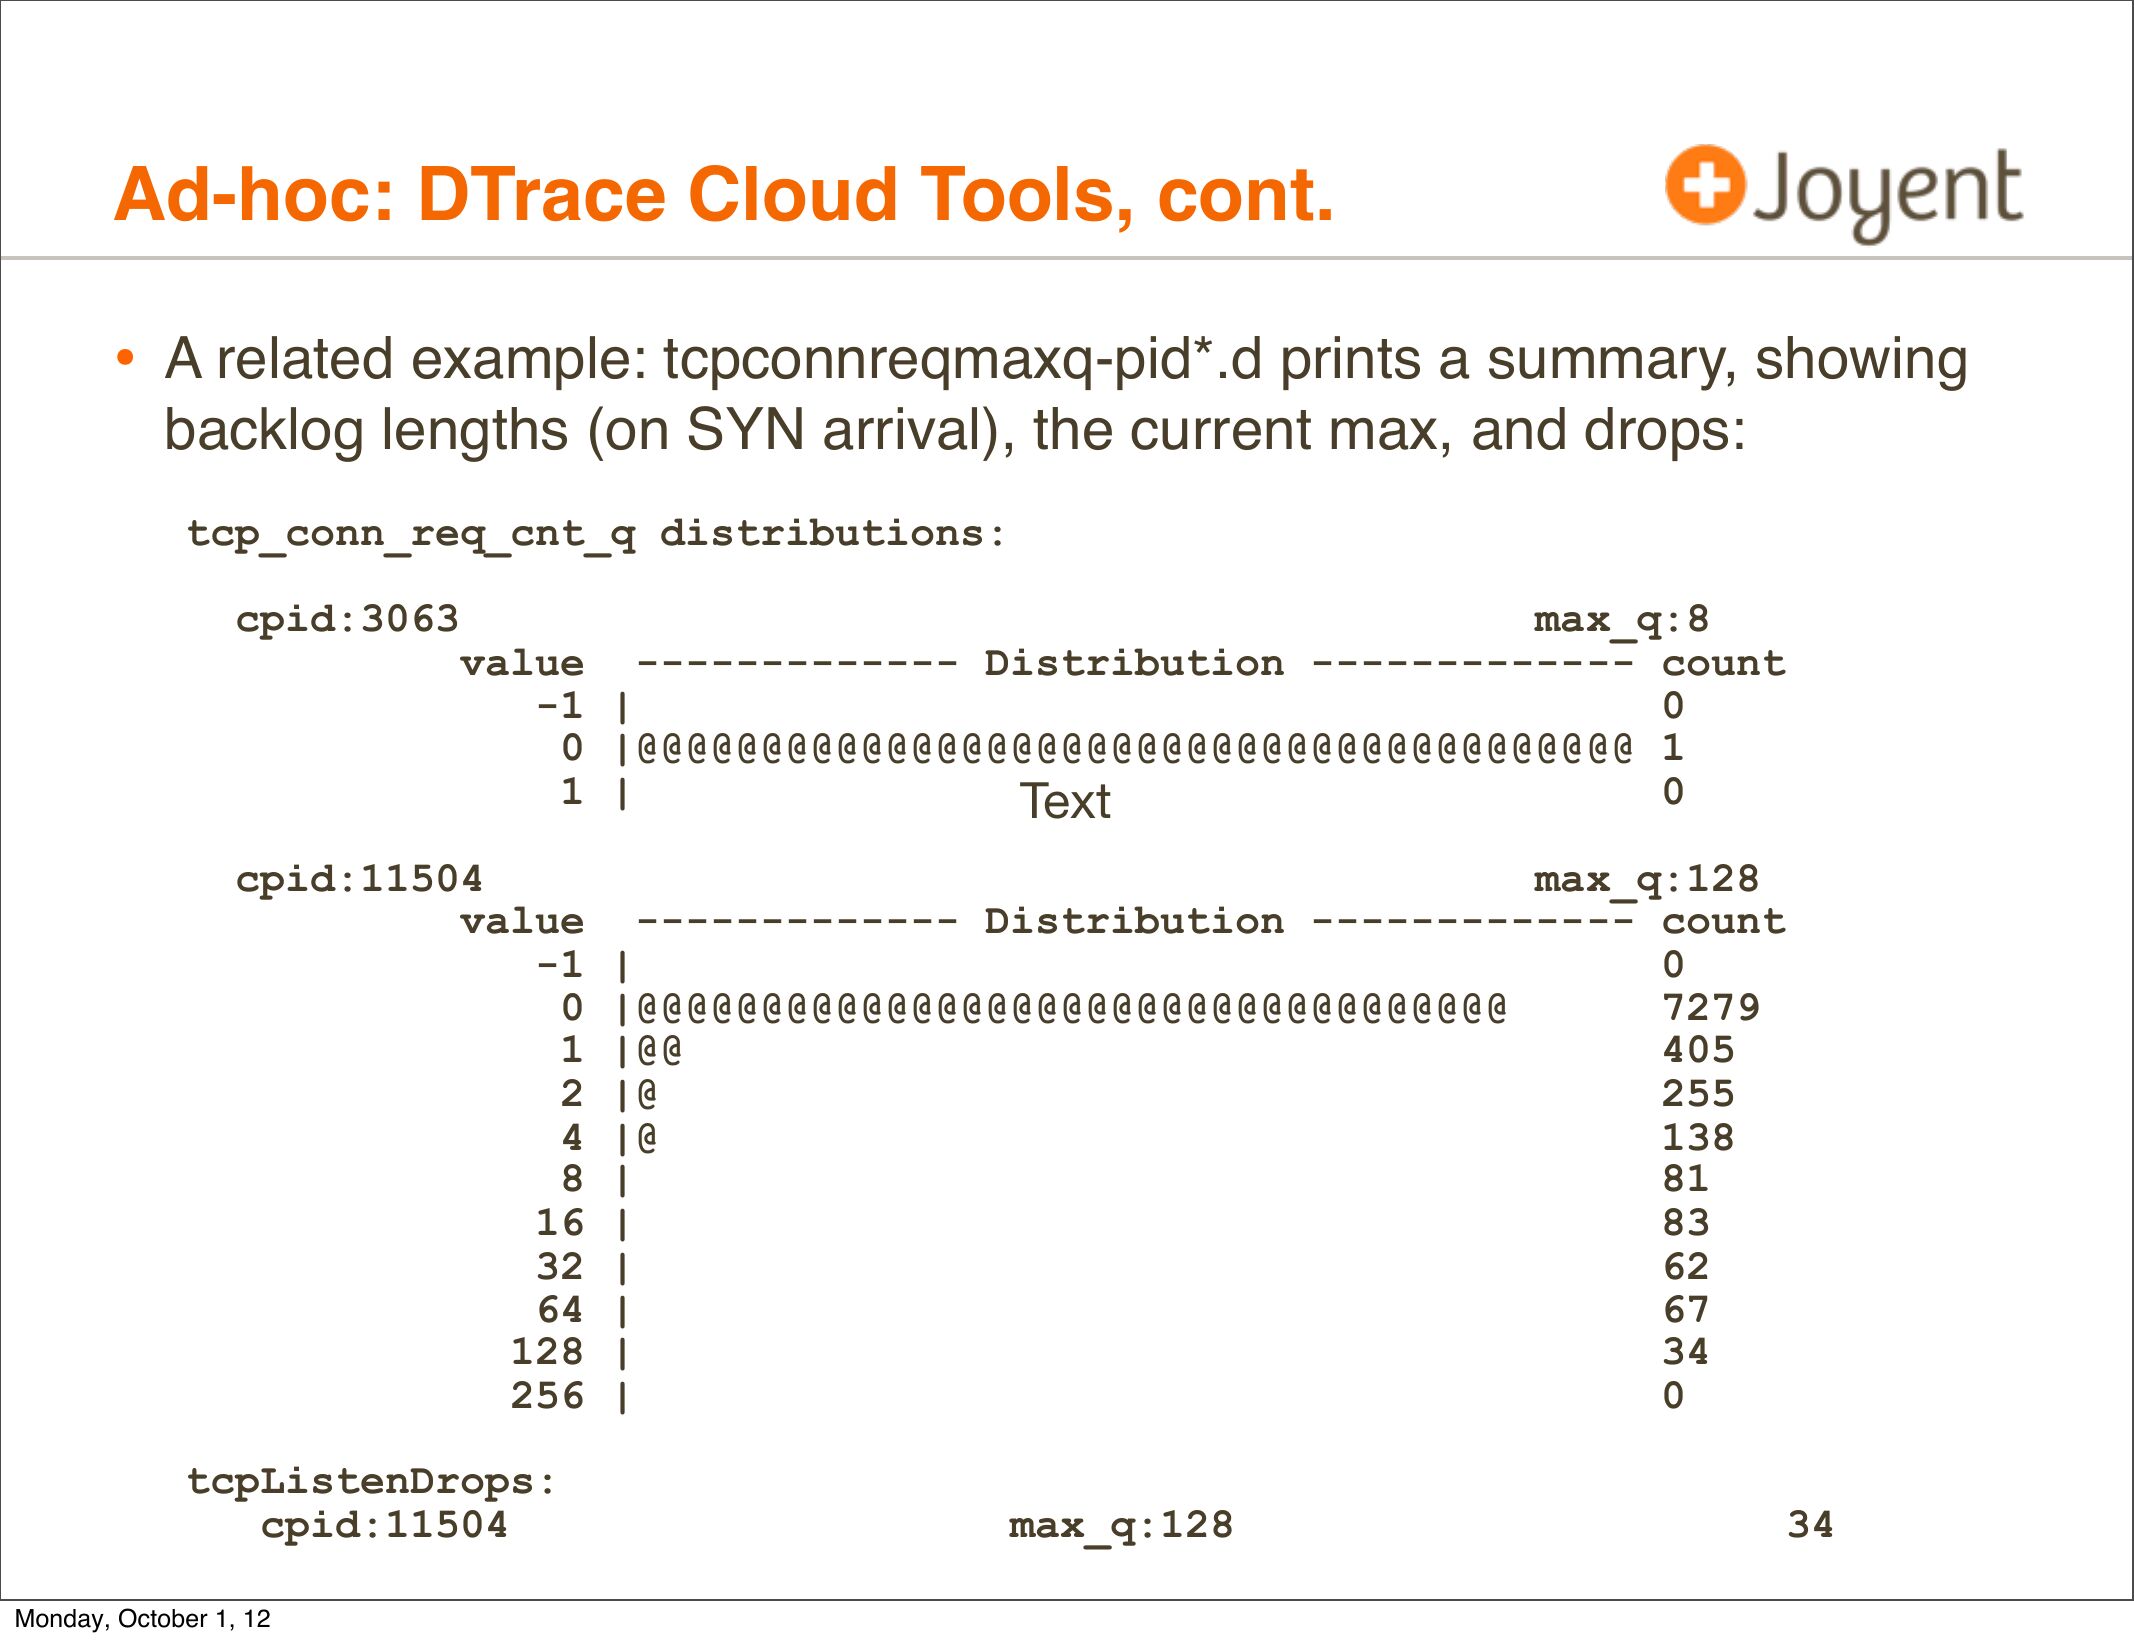
slide 40:Ad-hoc: DTrace Cloud Tools, cont. • A related example: tcpconnreqmaxq-pid*.d prints a summary, showing backlog lengths (on SYN arrival), the current max, and drops: tcp_conn_req_cnt_q distributions: cpid:3063 max_q:8 value ------------- Distribution ------------- count -1 | 0 |@@@@@@@@@@@@@@@@@@@@@@@@@@@@@@@@@@@@@@@@ 1 1 | Text cpid:11504 max_q:128 value ------------- Distribution ------------- count -1 | 0 |@@@@@@@@@@@@@@@@@@@@@@@@@@@@@@@@@@@ 1 |@@ 2 |@ 4 |@ 8 | 16 | 32 | 64 | 128 | 256 | tcpListenDrops: cpid:11504 Monday, October 1, 12 max_q:128slide 41:
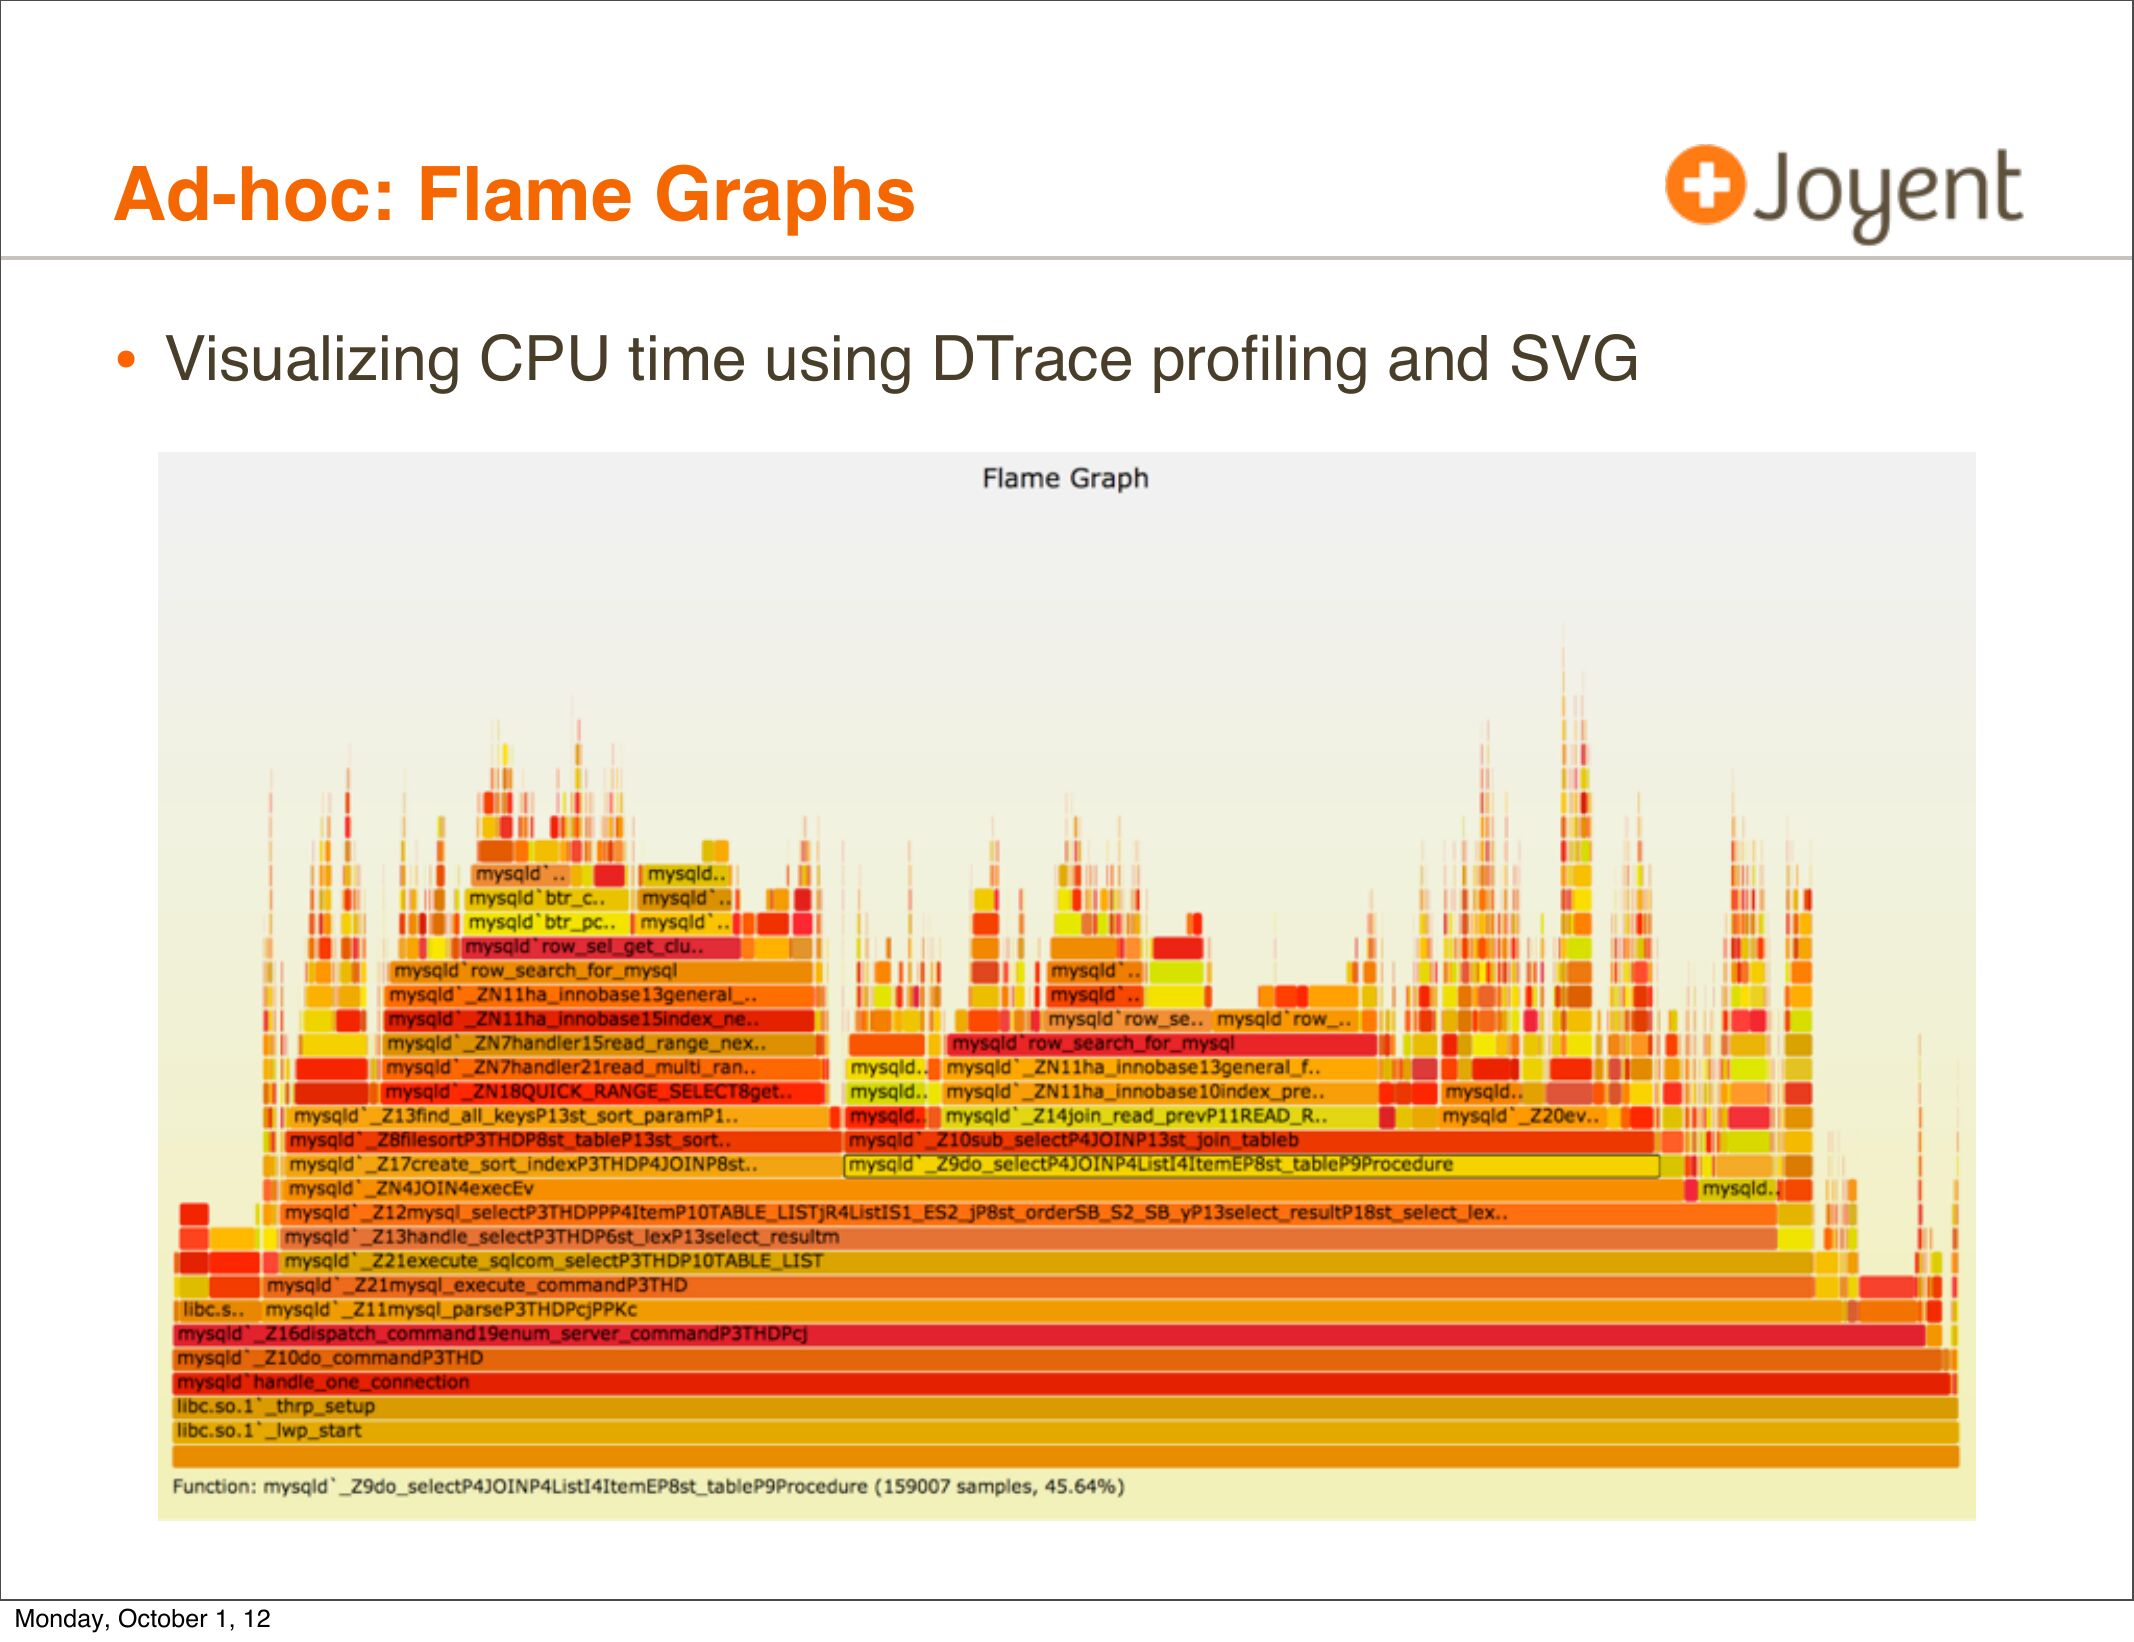
Ad-hoc: Flame Graphs
• Visualizing CPU time using DTrace profiling and SVG
Monday, October 1, 12
slide 42:
Product
• Cloud observability products including DTrace:
• Joyent’s Cloud Analytics
Monday, October 1, 12
slide 43:
Product: Cloud Analytics
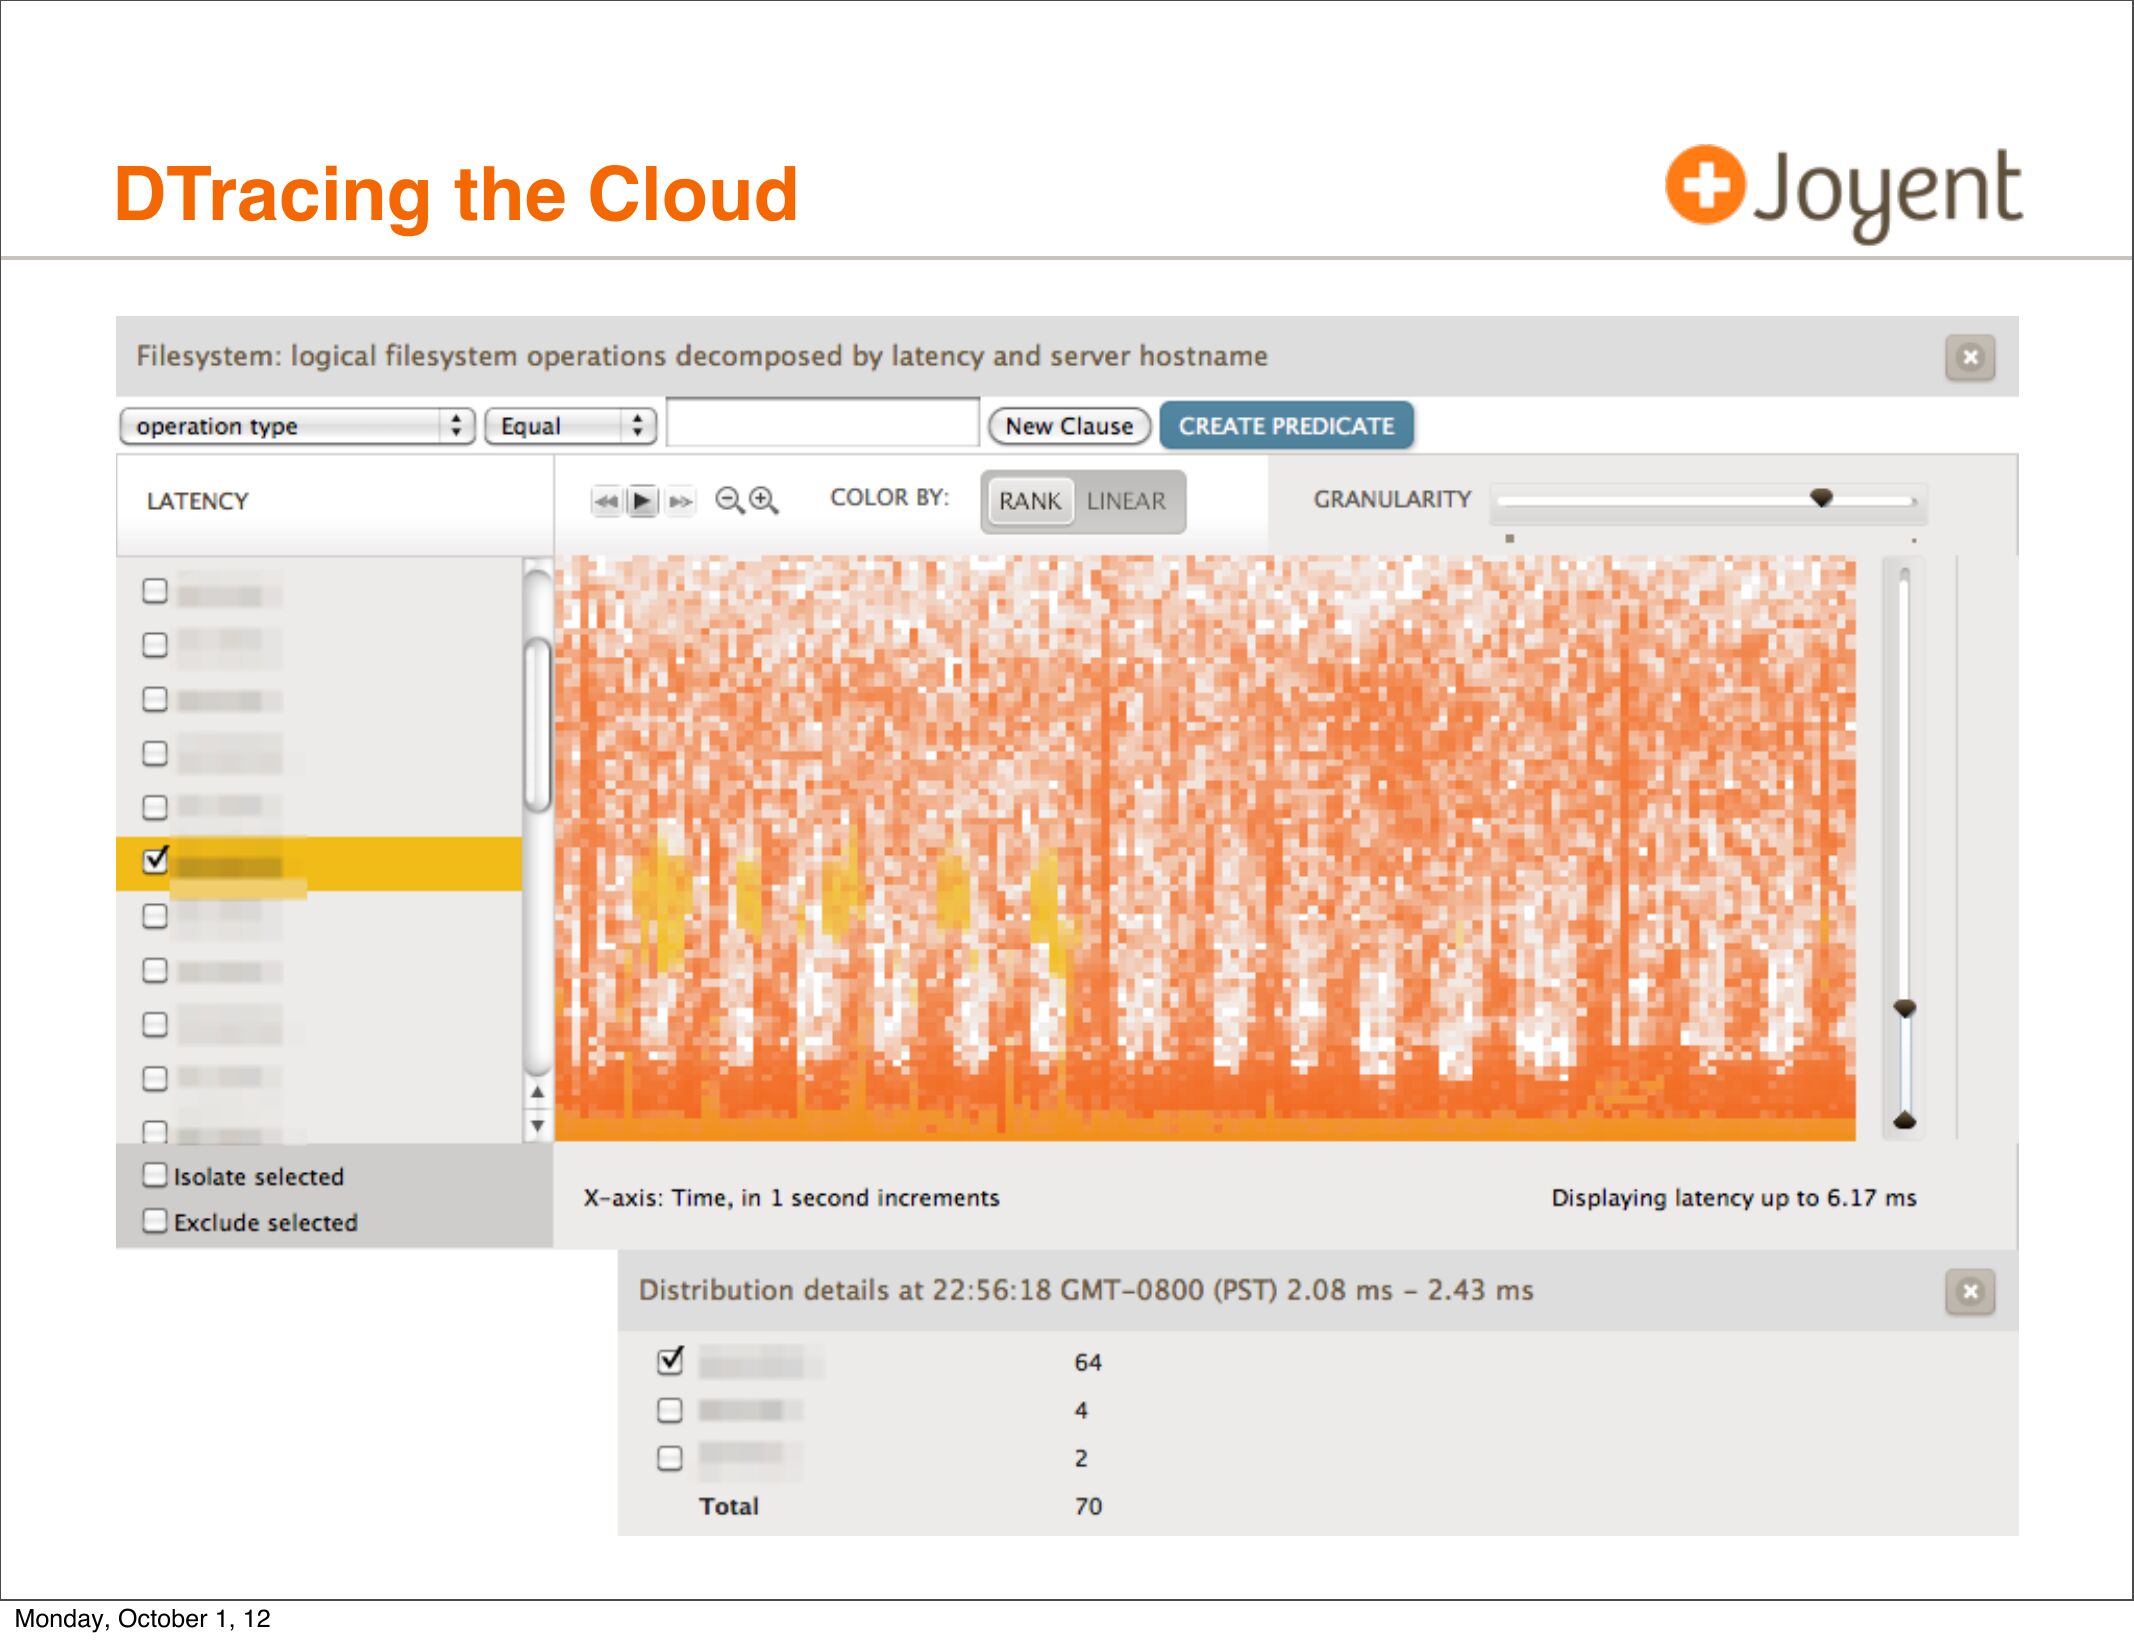
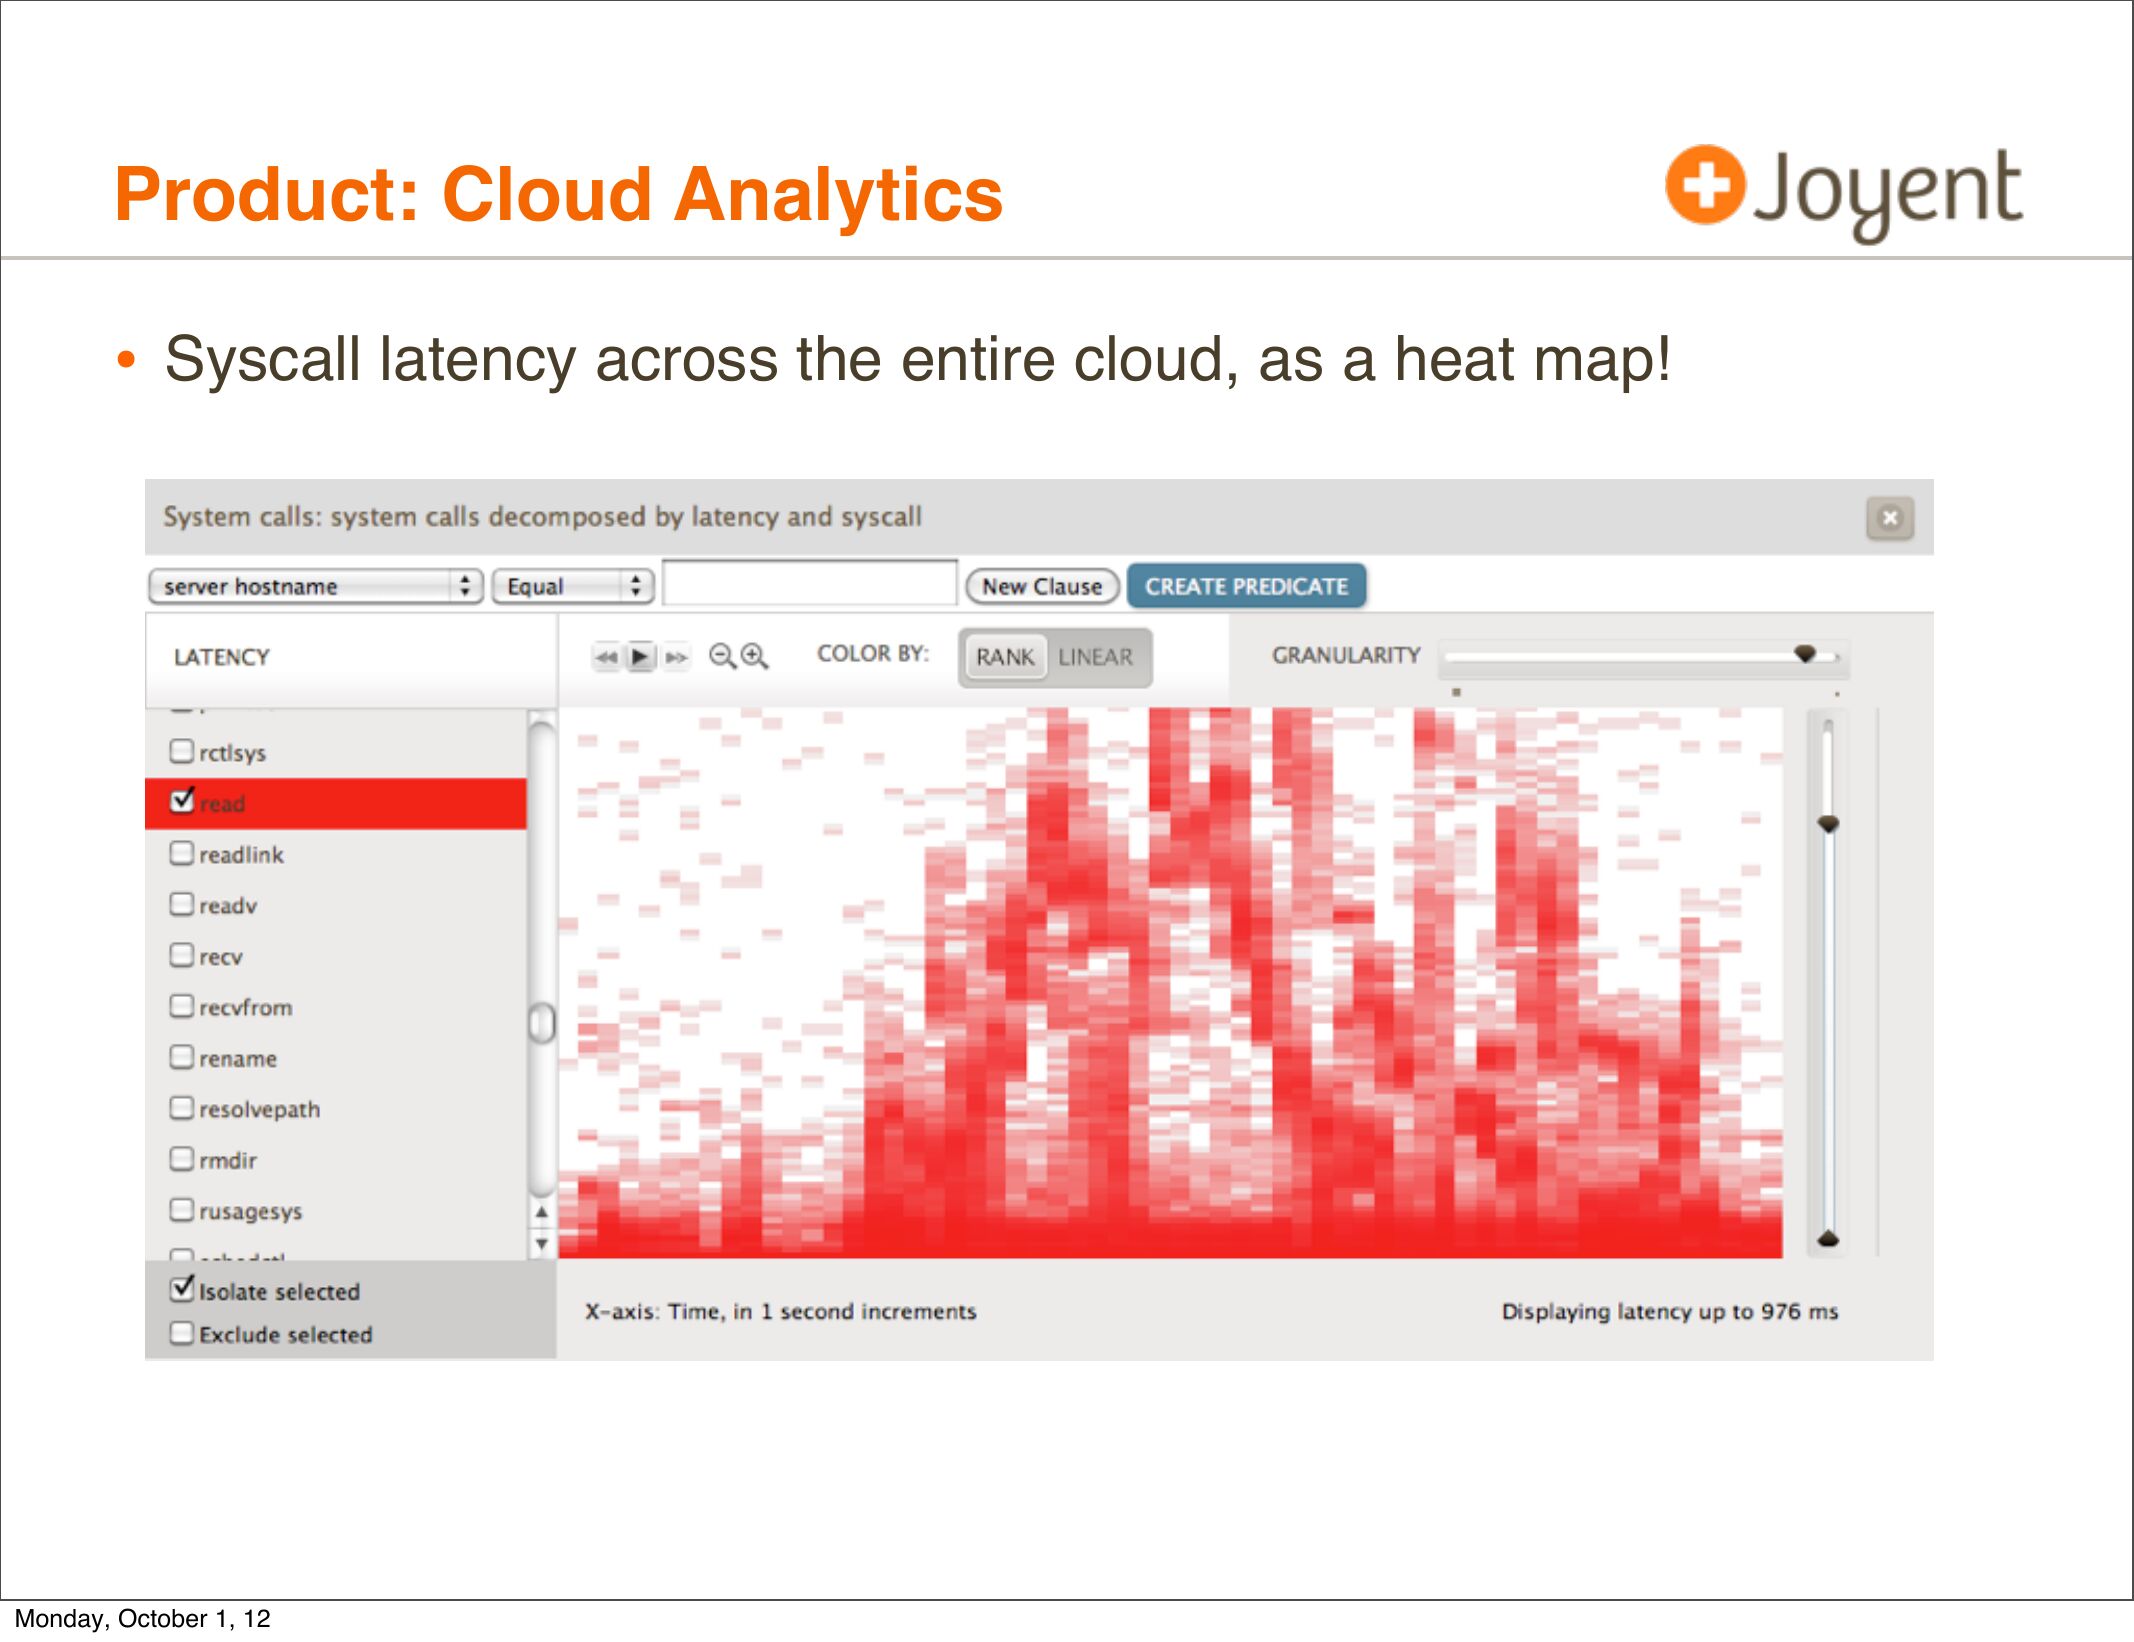
• Syscall latency across the entire cloud, as a heat map!
Monday, October 1, 12
slide 44:
Product: Cloud Analytics, cont.
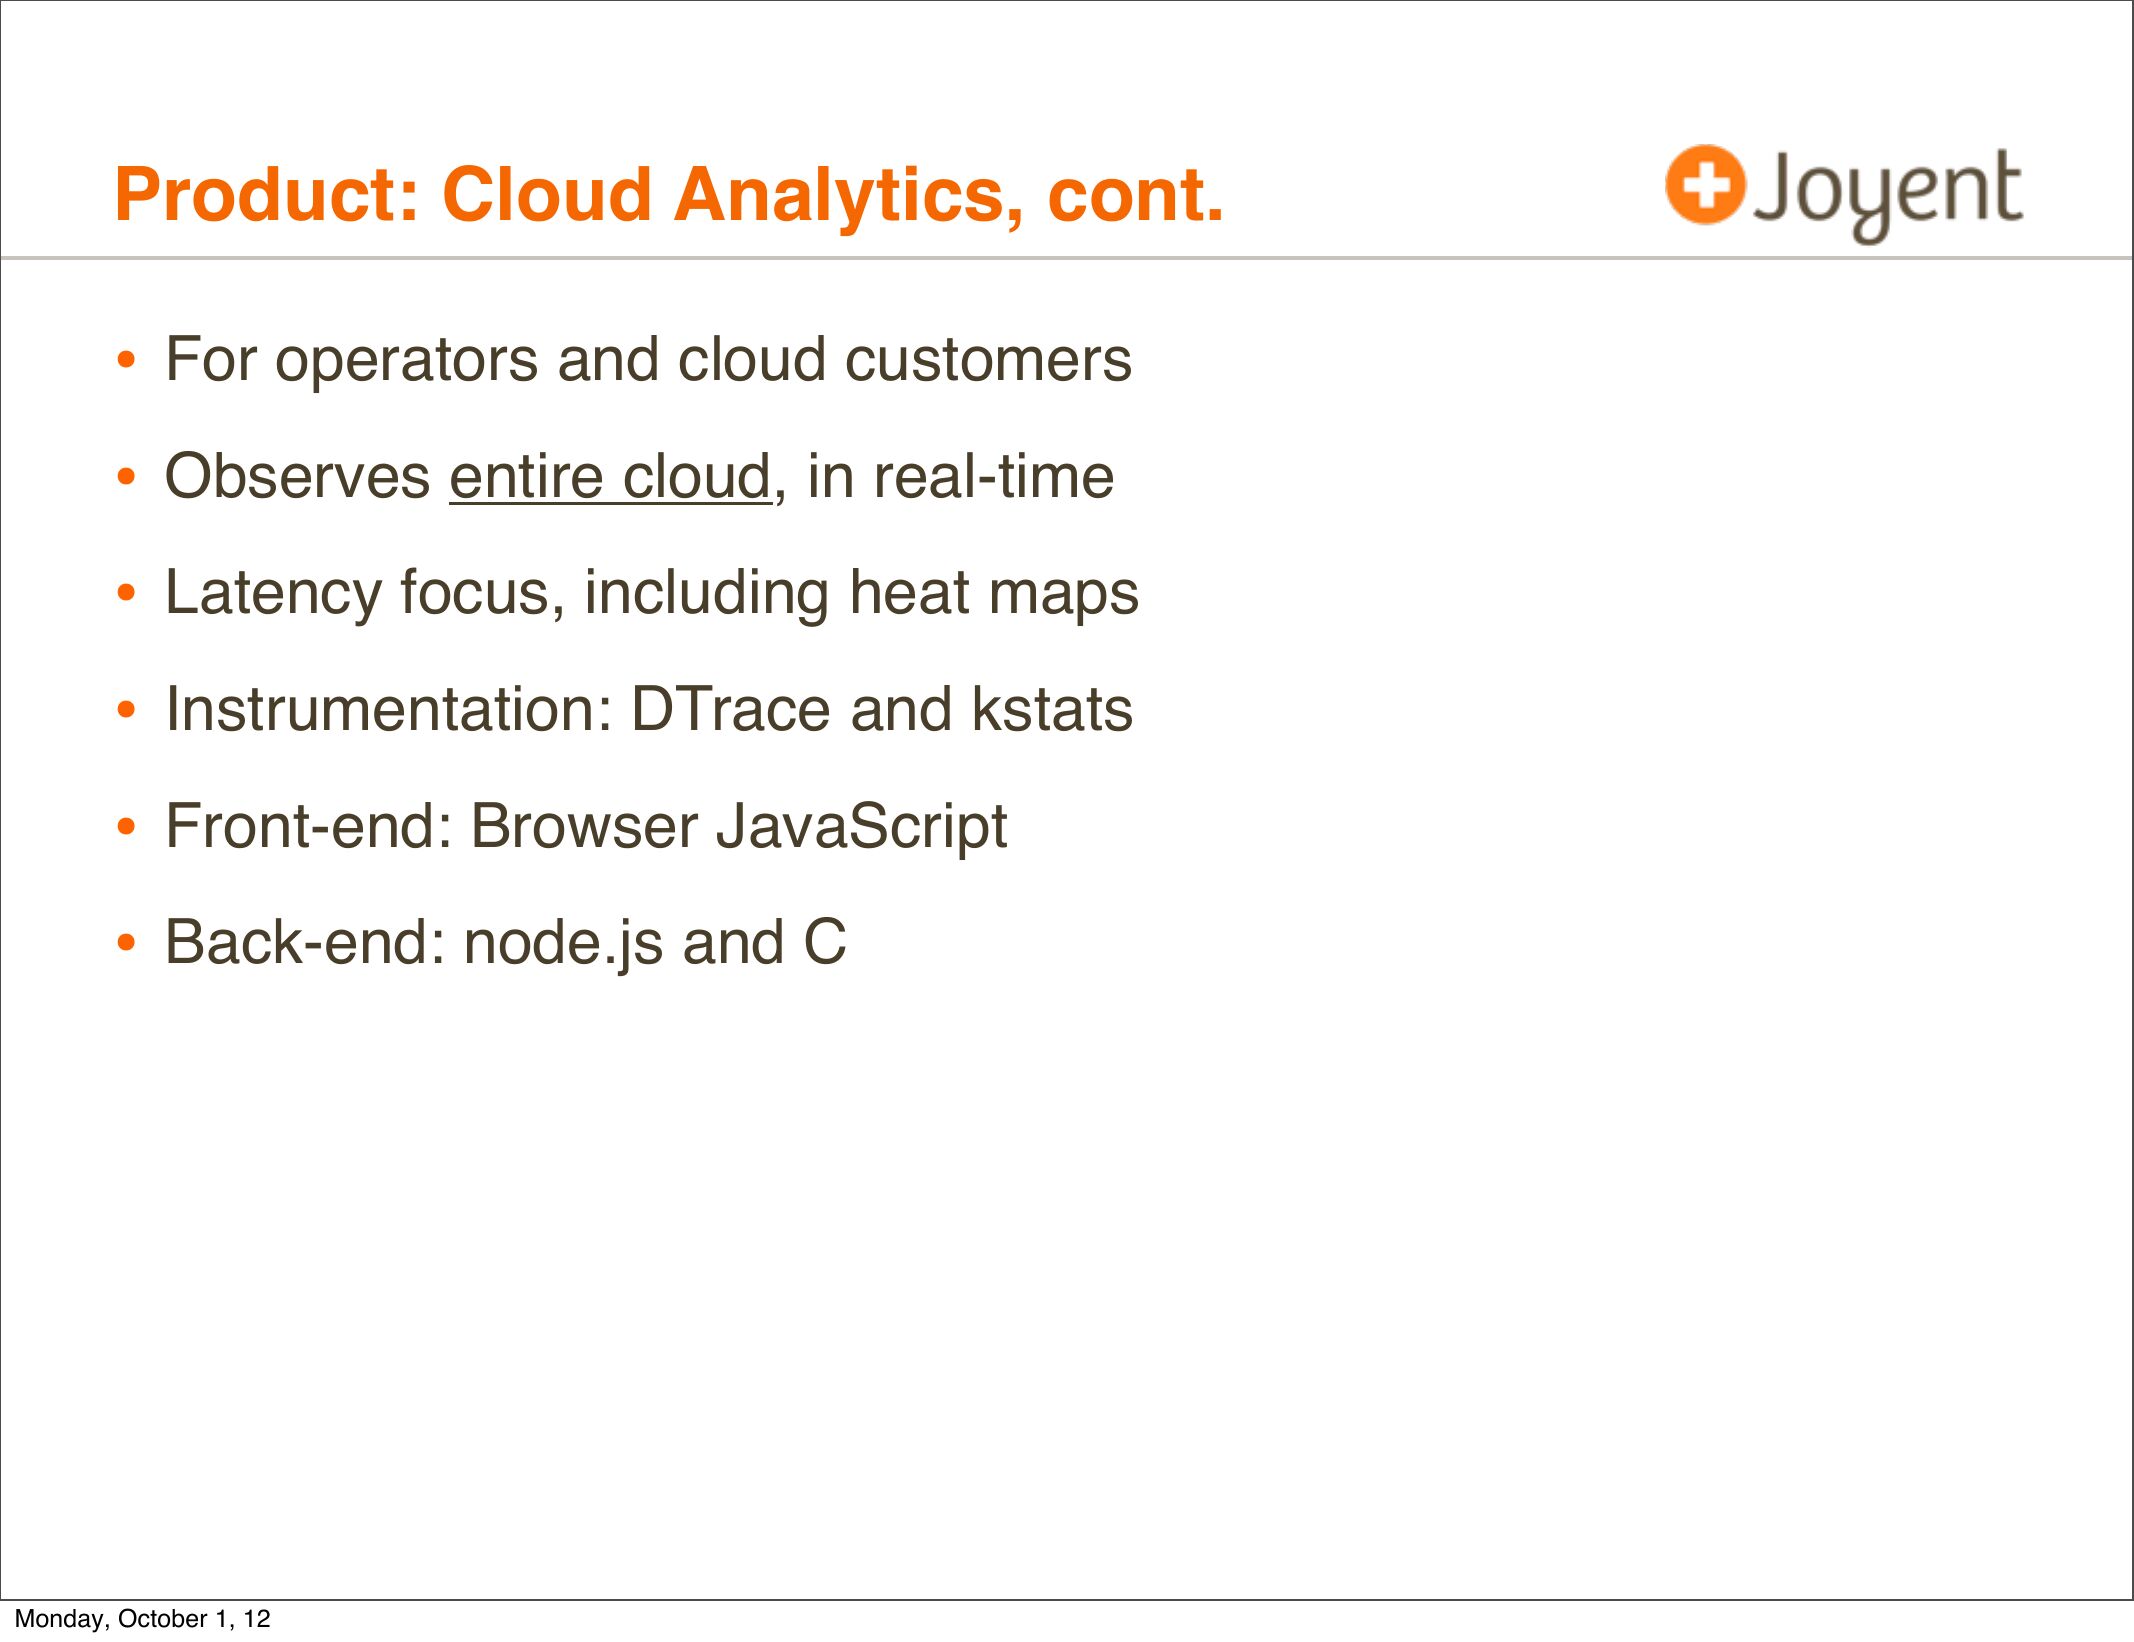
• For operators and cloud customers
• Observes entire cloud, in real-time
• Latency focus, including heat maps
• Instrumentation: DTrace and kstats
• Front-end: Browser JavaScript
• Back-end: node.js and C
Monday, October 1, 12
slide 45:
Product: Cloud Analytics, cont.
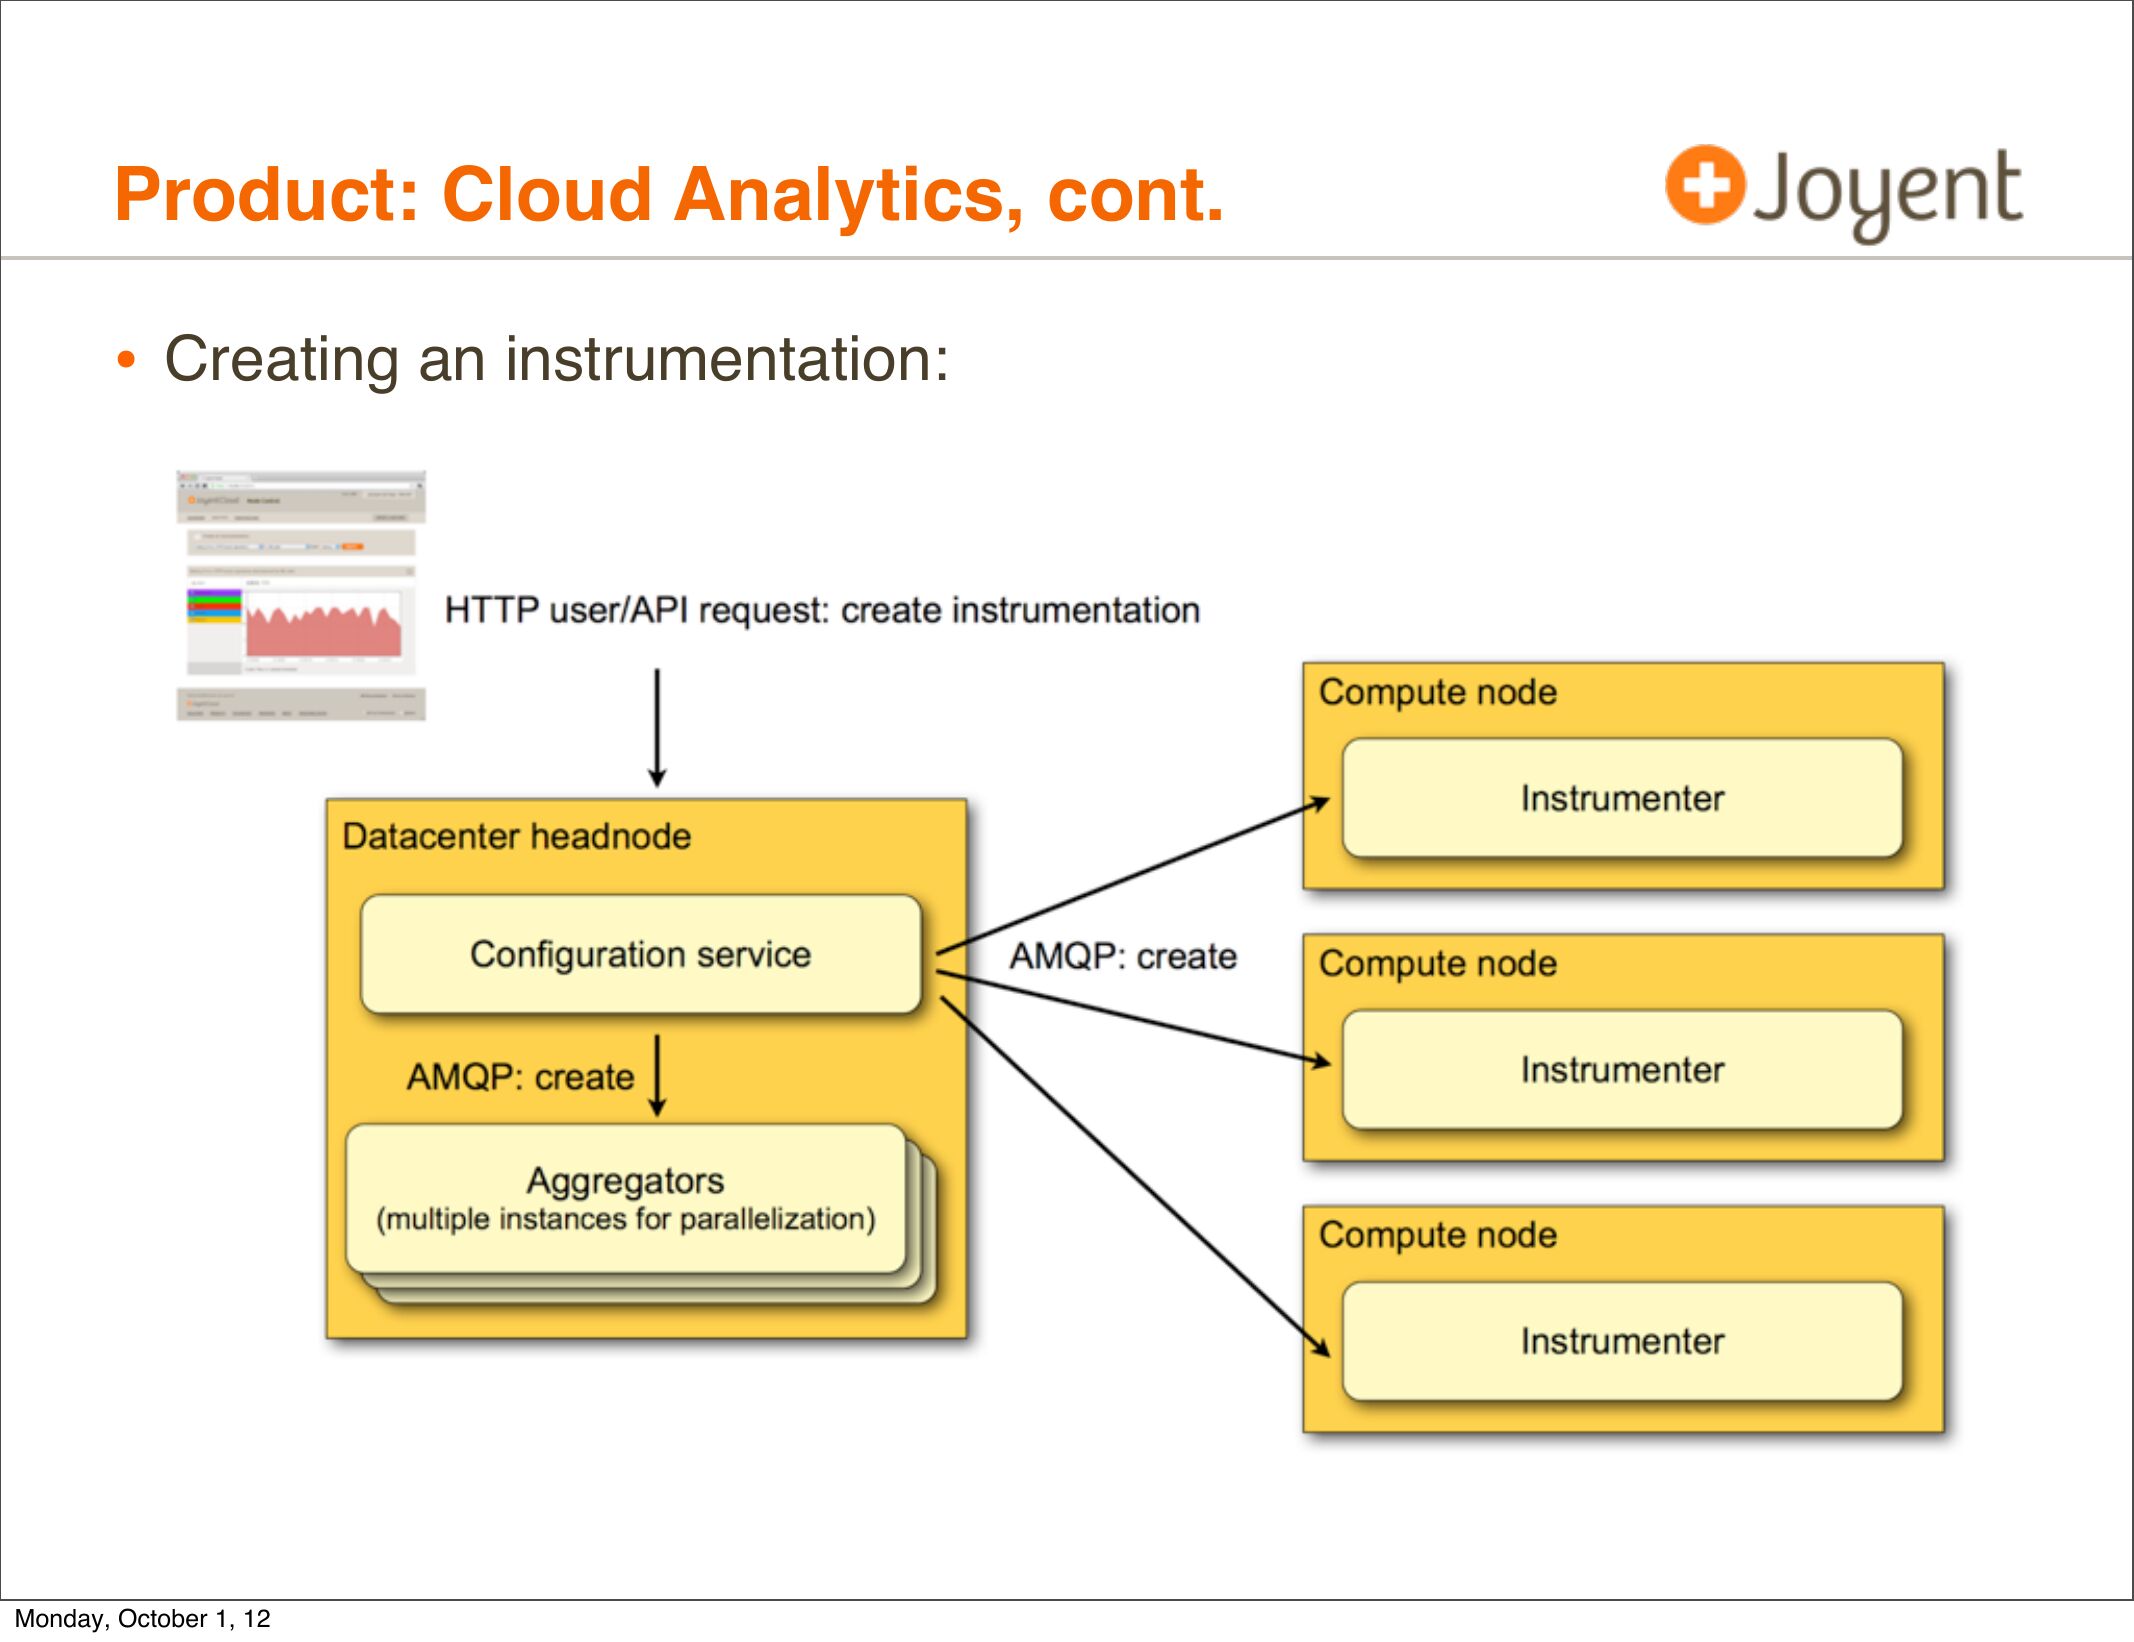
• Creating an instrumentation:
Monday, October 1, 12
slide 46:
Product: Cloud Analytics, cont.
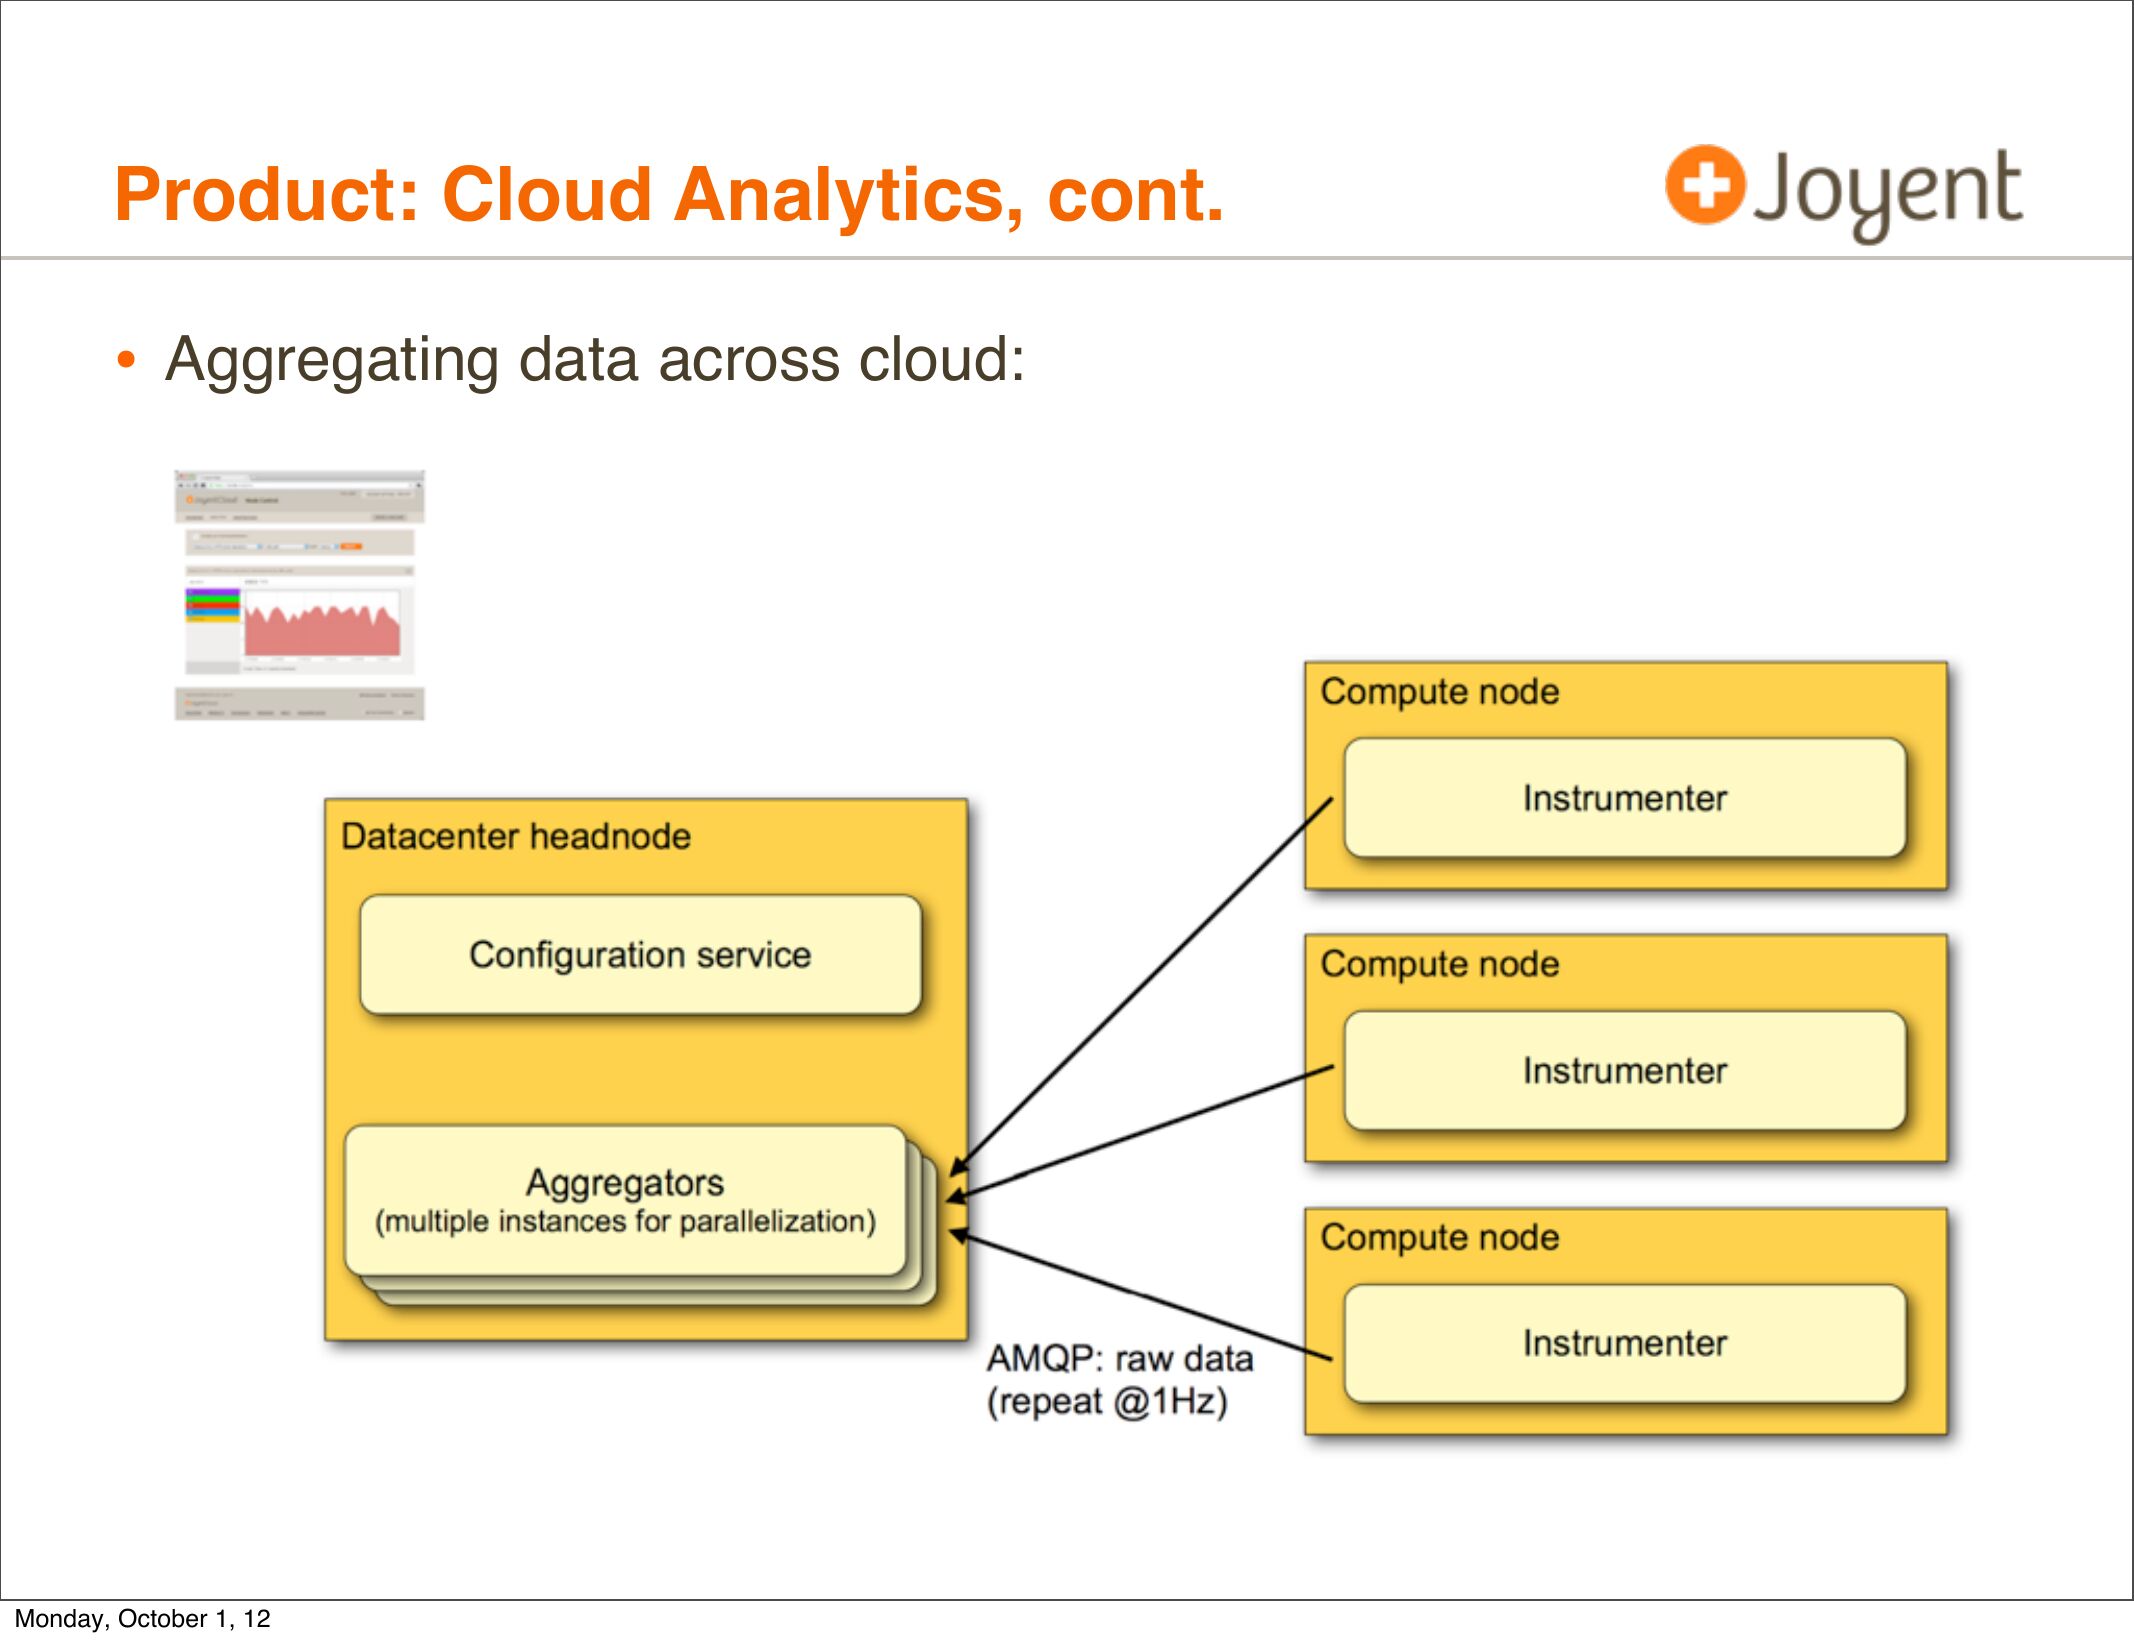
• Aggregating data across cloud:
Monday, October 1, 12
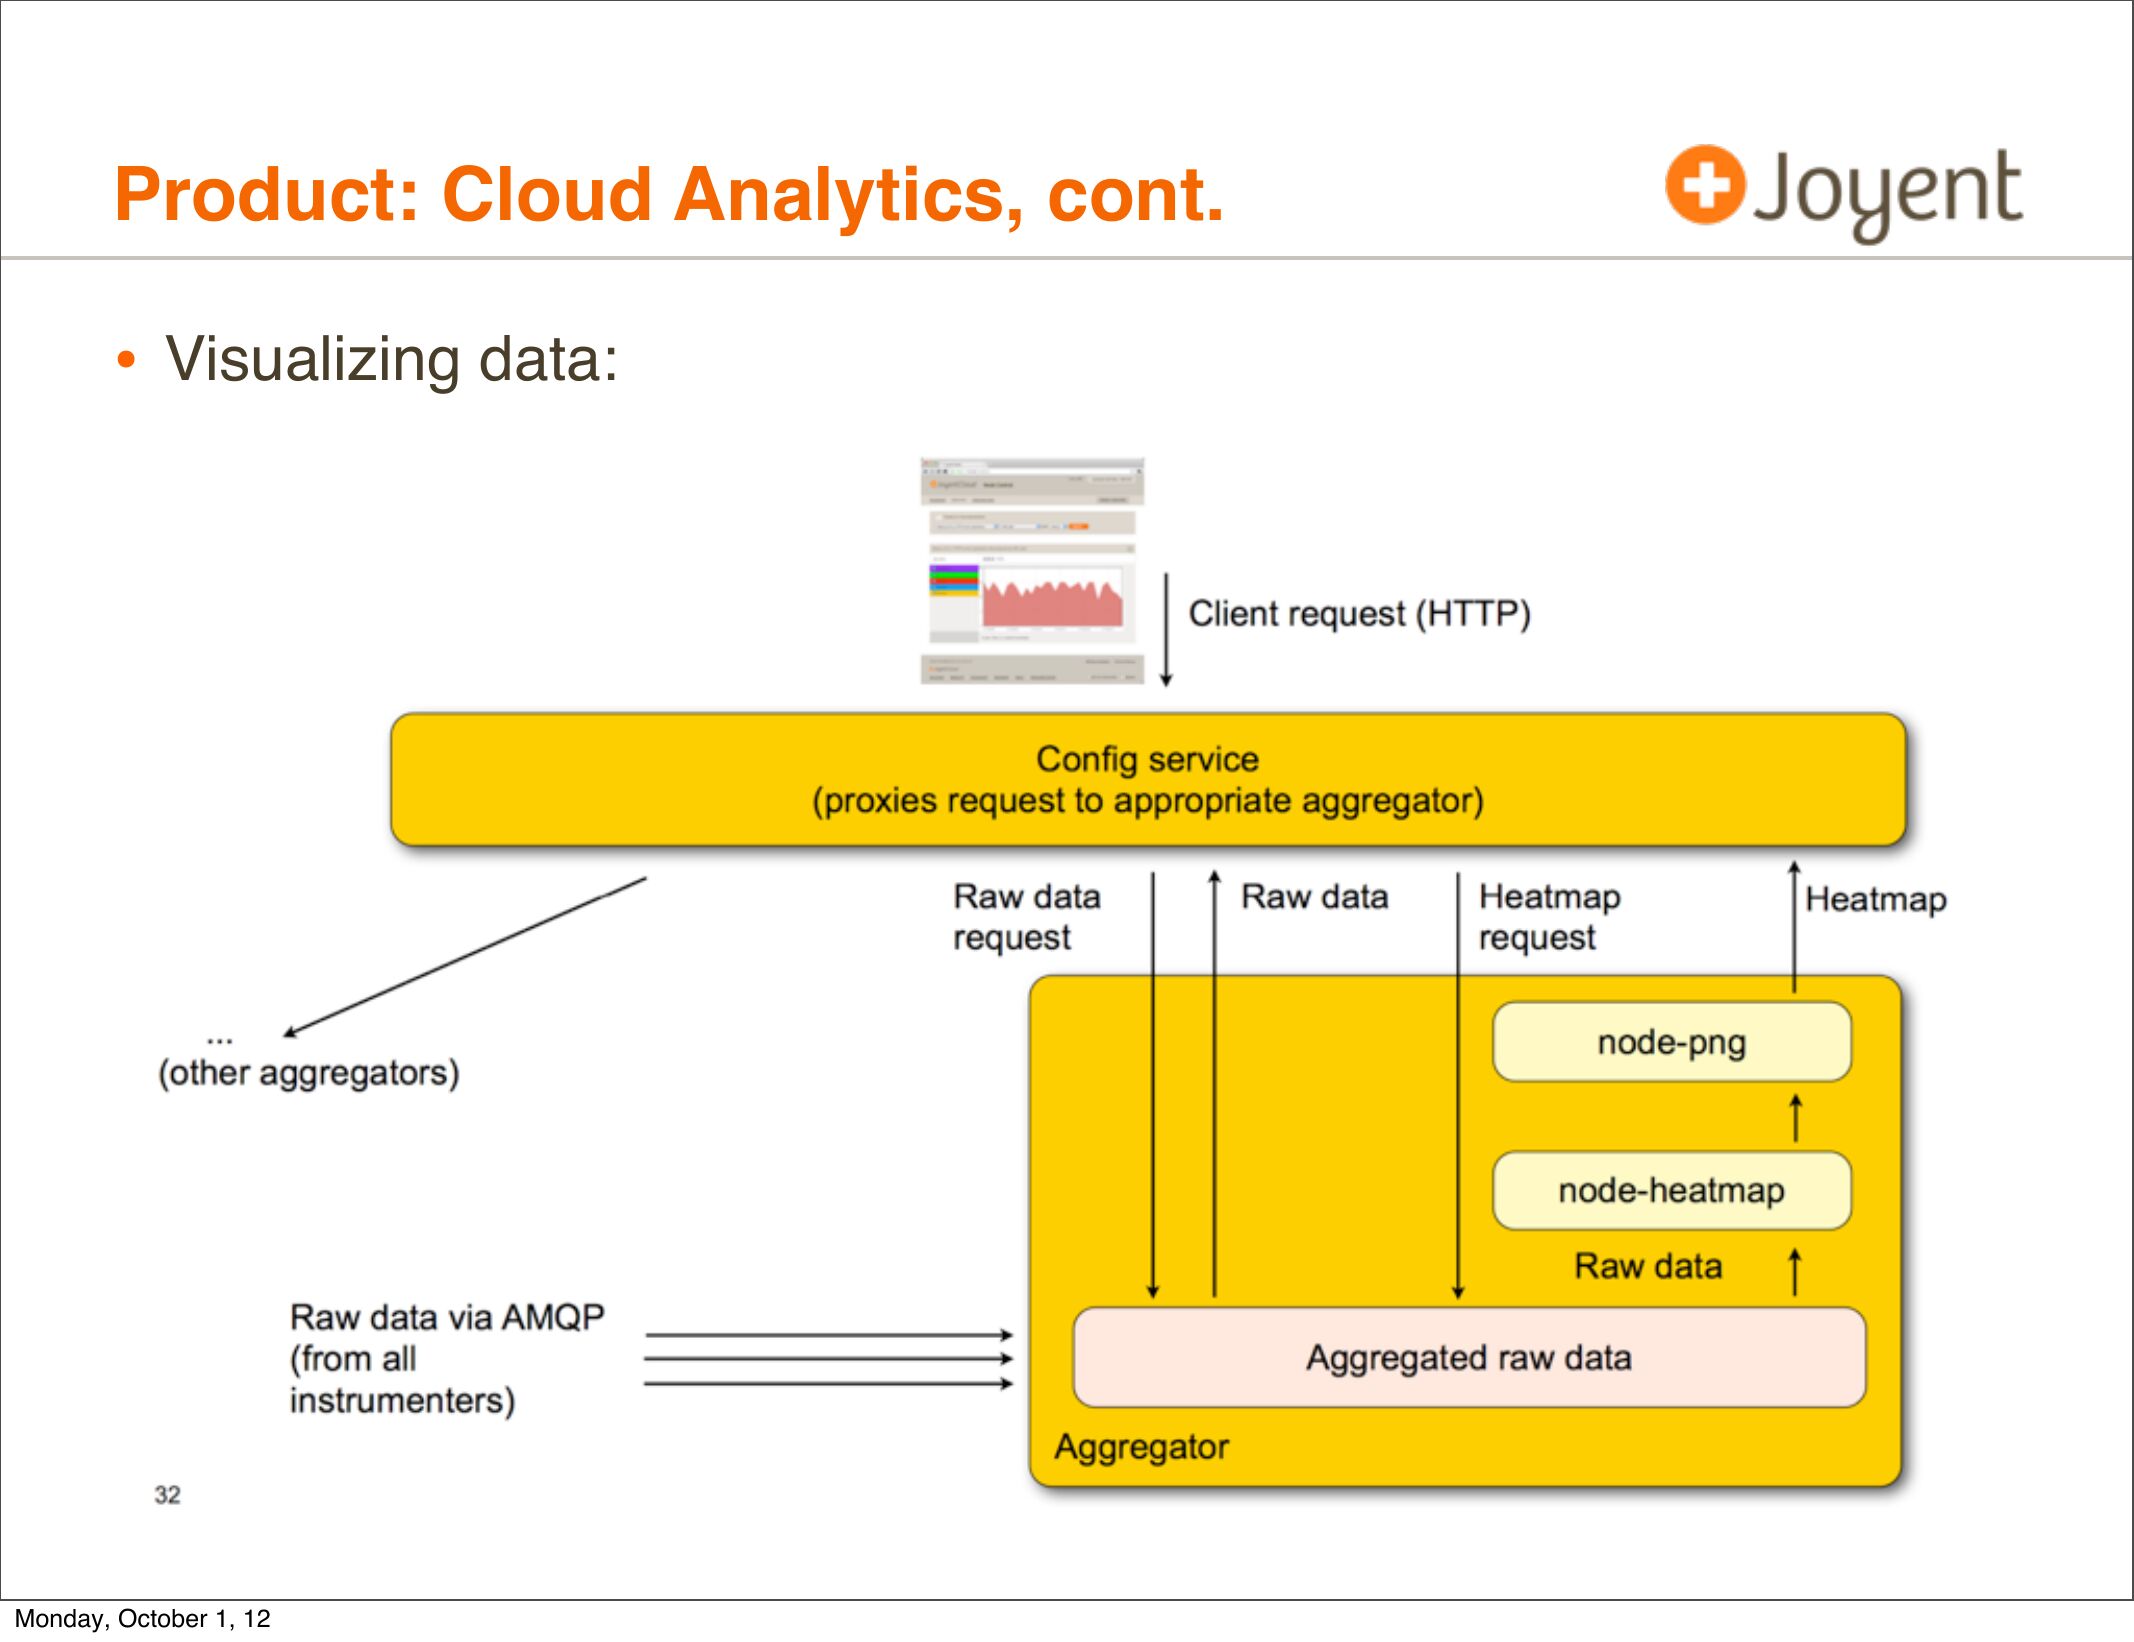
slide 47:
Product: Cloud Analytics, cont.
• Visualizing data:
Monday, October 1, 12
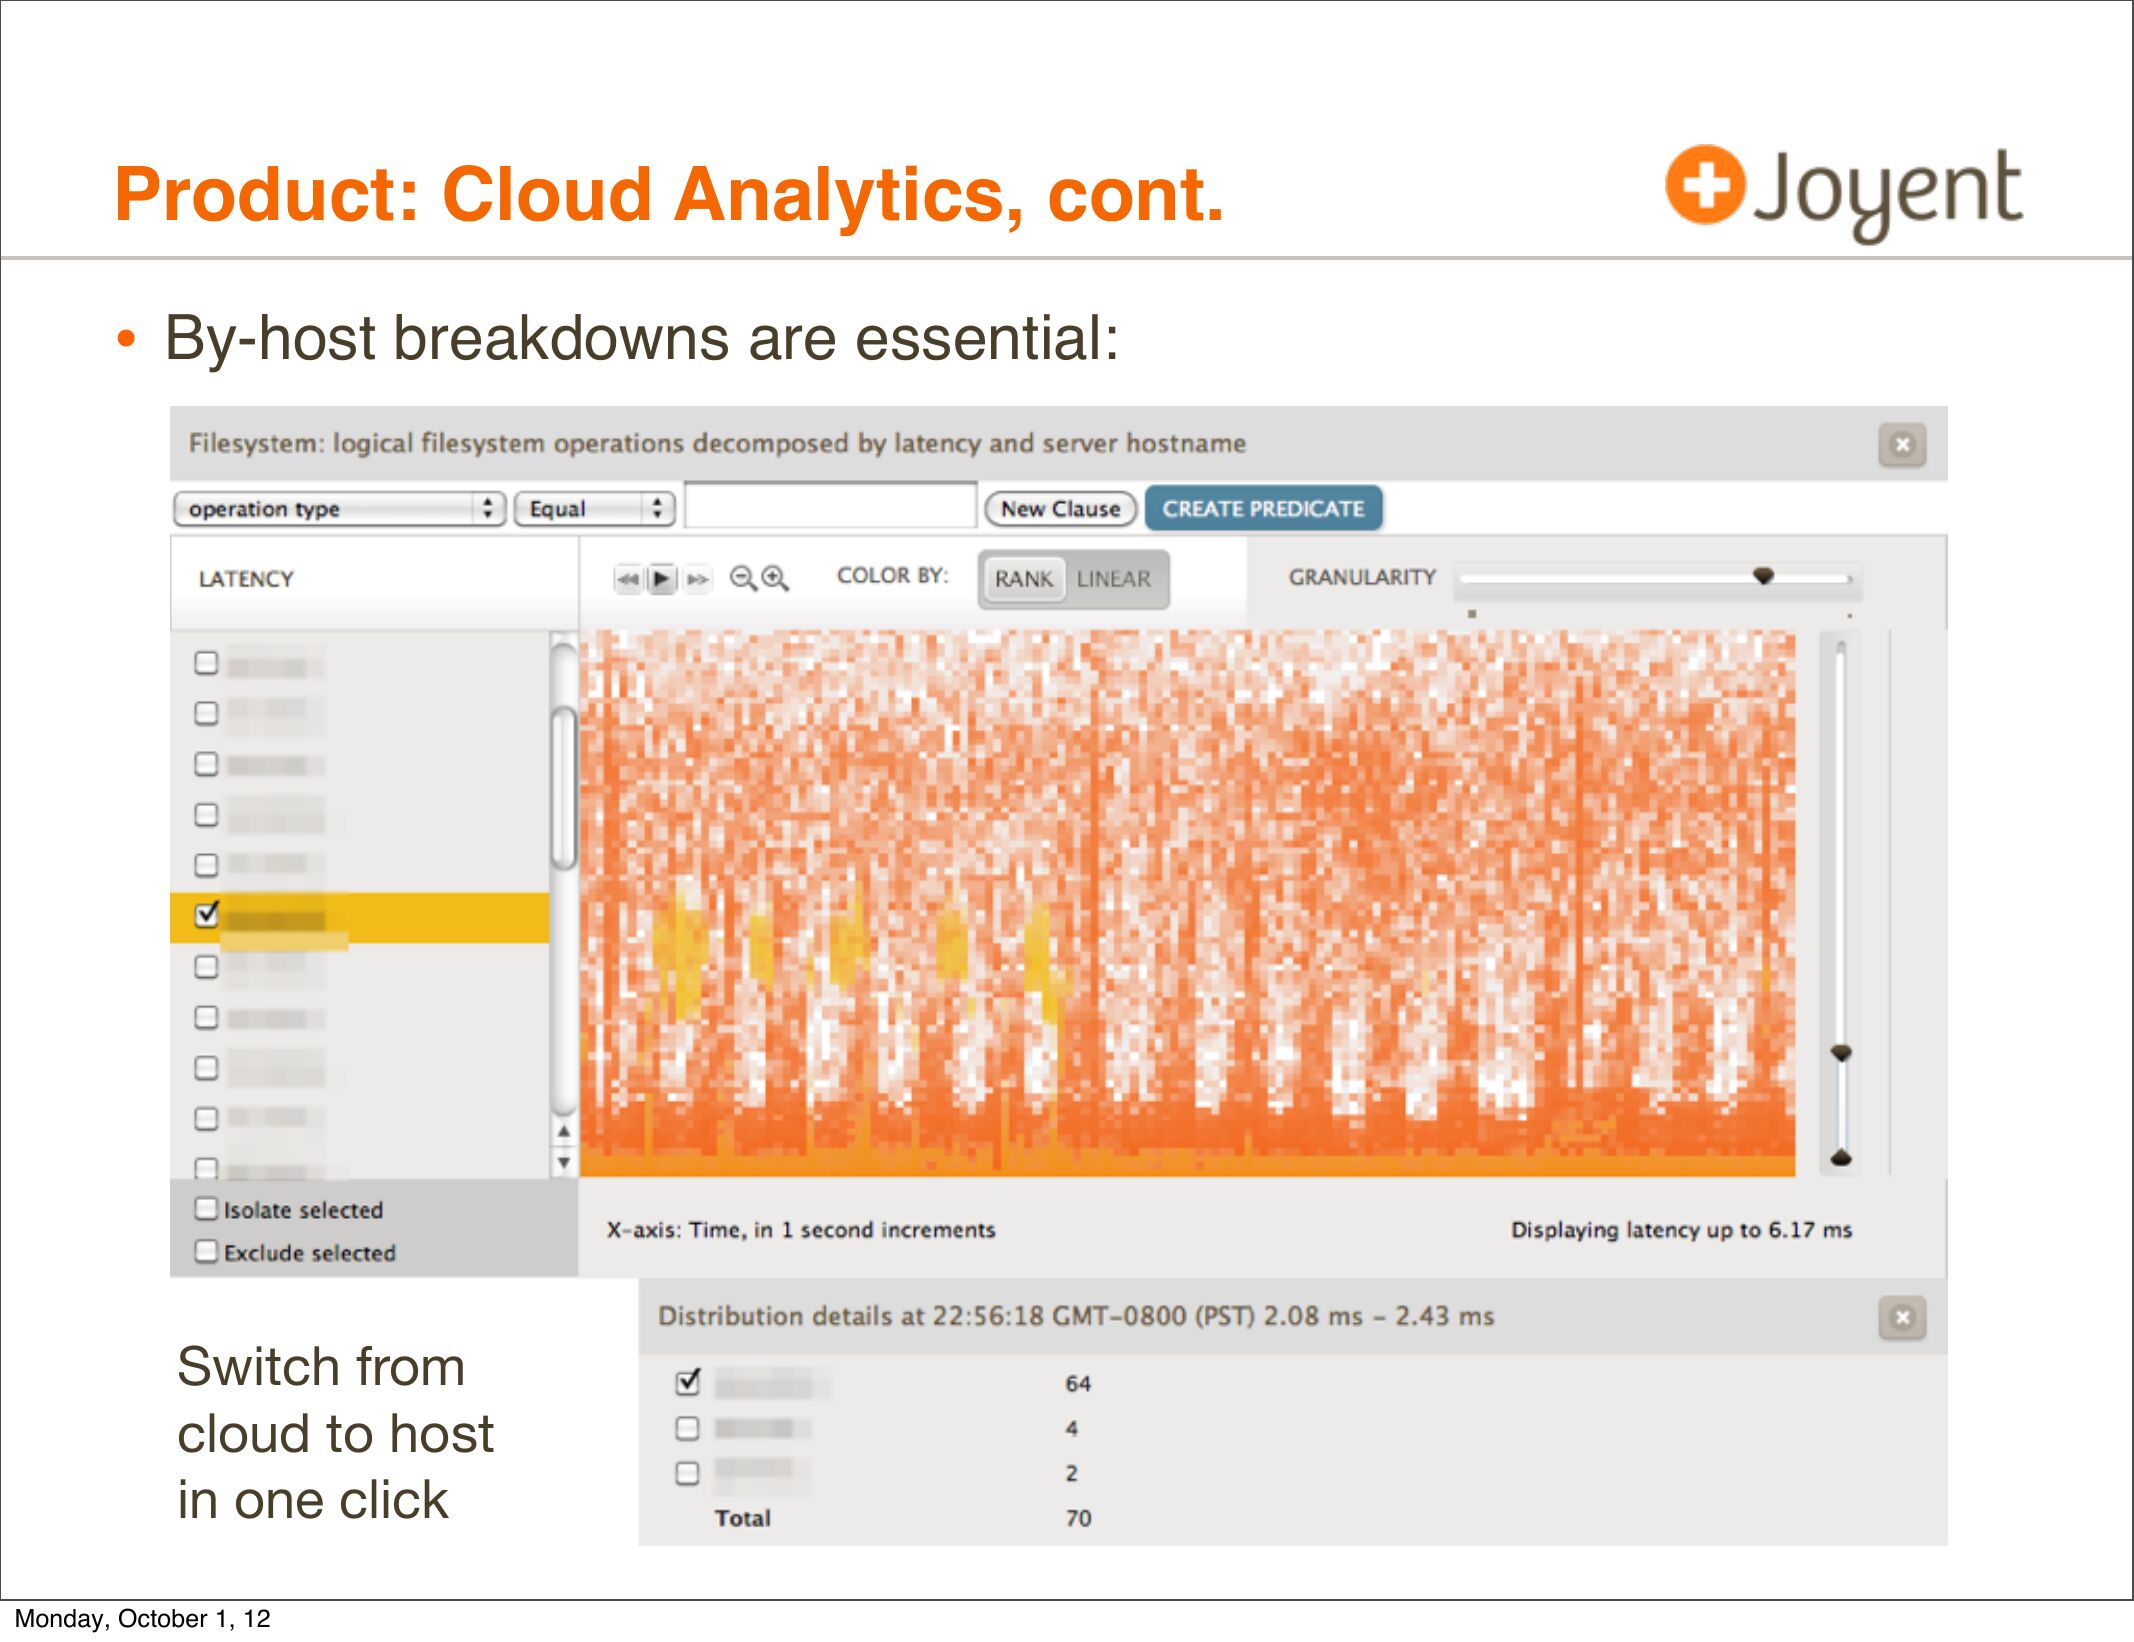
slide 48:
Product: Cloud Analytics, cont.
• By-host breakdowns are essential:
Switch from
cloud to host
in one click
Monday, October 1, 12
slide 49:
Case Studies
Monday, October 1, 12
slide 50:
Case Studies
• Slow disks
• Scheduler
Monday, October 1, 12
slide 51:
Slow disks
• Customer complains of poor MySQL performance.
• Noticed disks are busy via iostat-based monitoring software,
and have blamed noisy neighbors causing disk I/O contention.
• Multi-tenancy and performance isolation are common cloud issues
Monday, October 1, 12
slide 52:
Slow disks, cont.
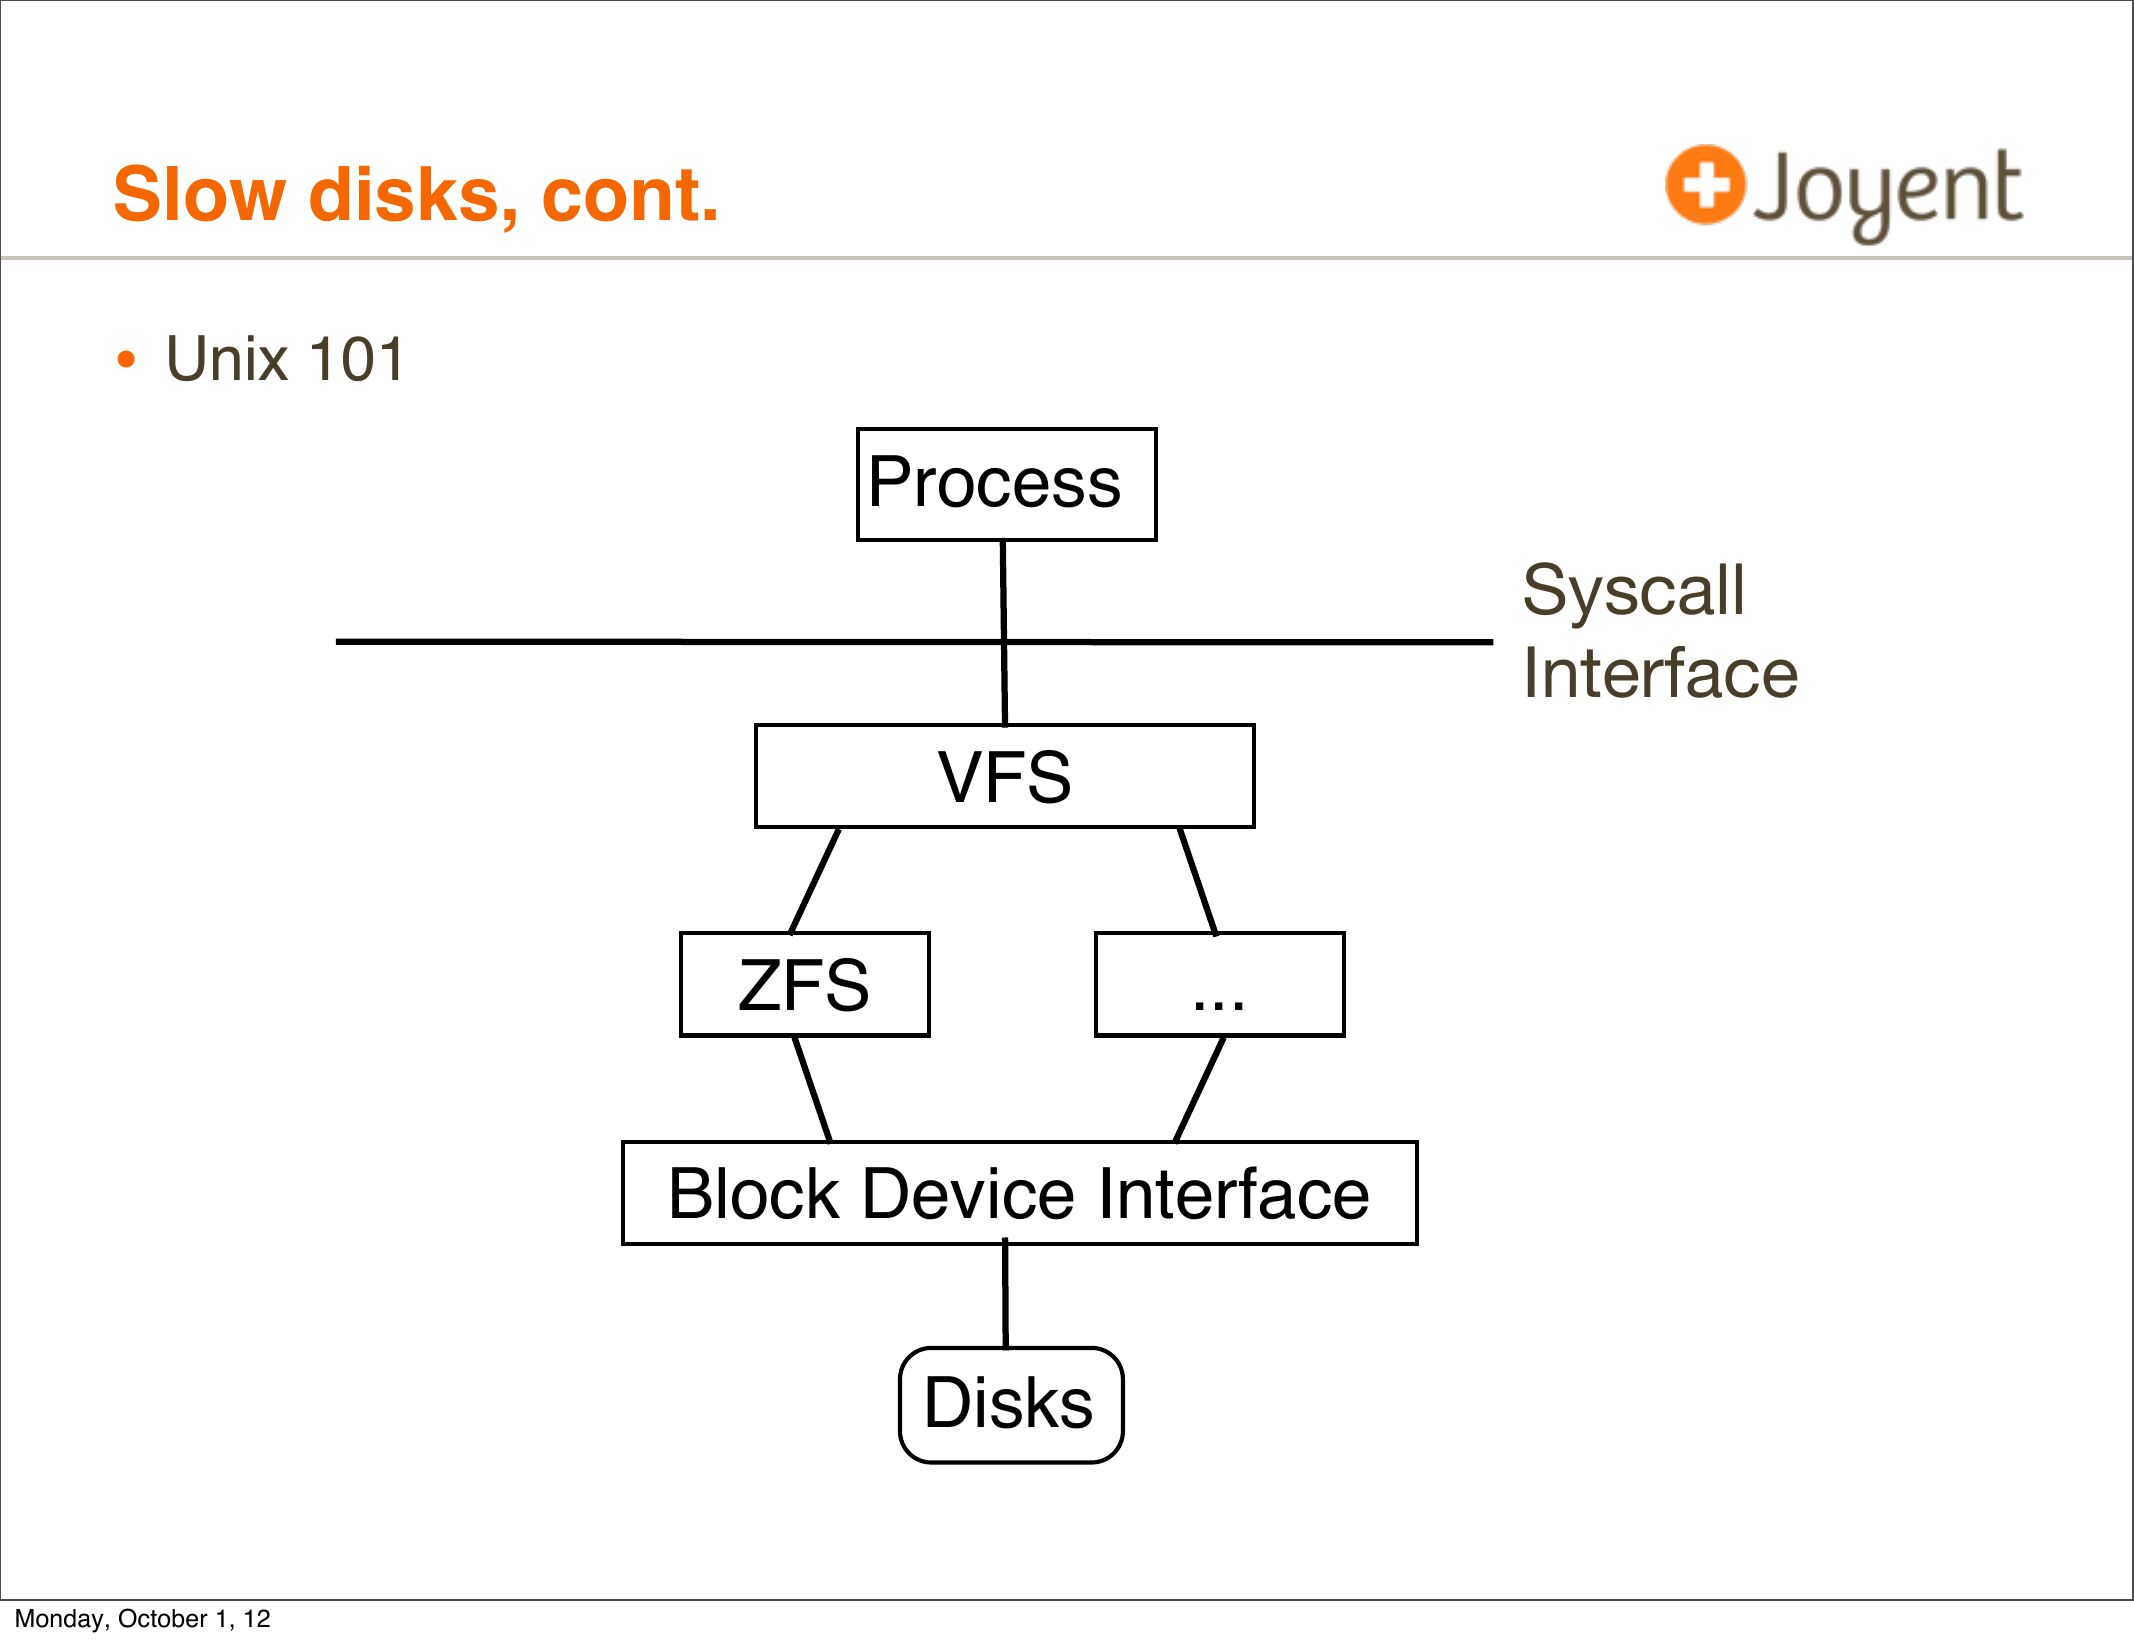
• Unix 101
Process
Syscall
Interface
VFS
ZFS
Block Device Interface
Disks
Monday, October 1, 12
slide 53:
Slow disks, cont.
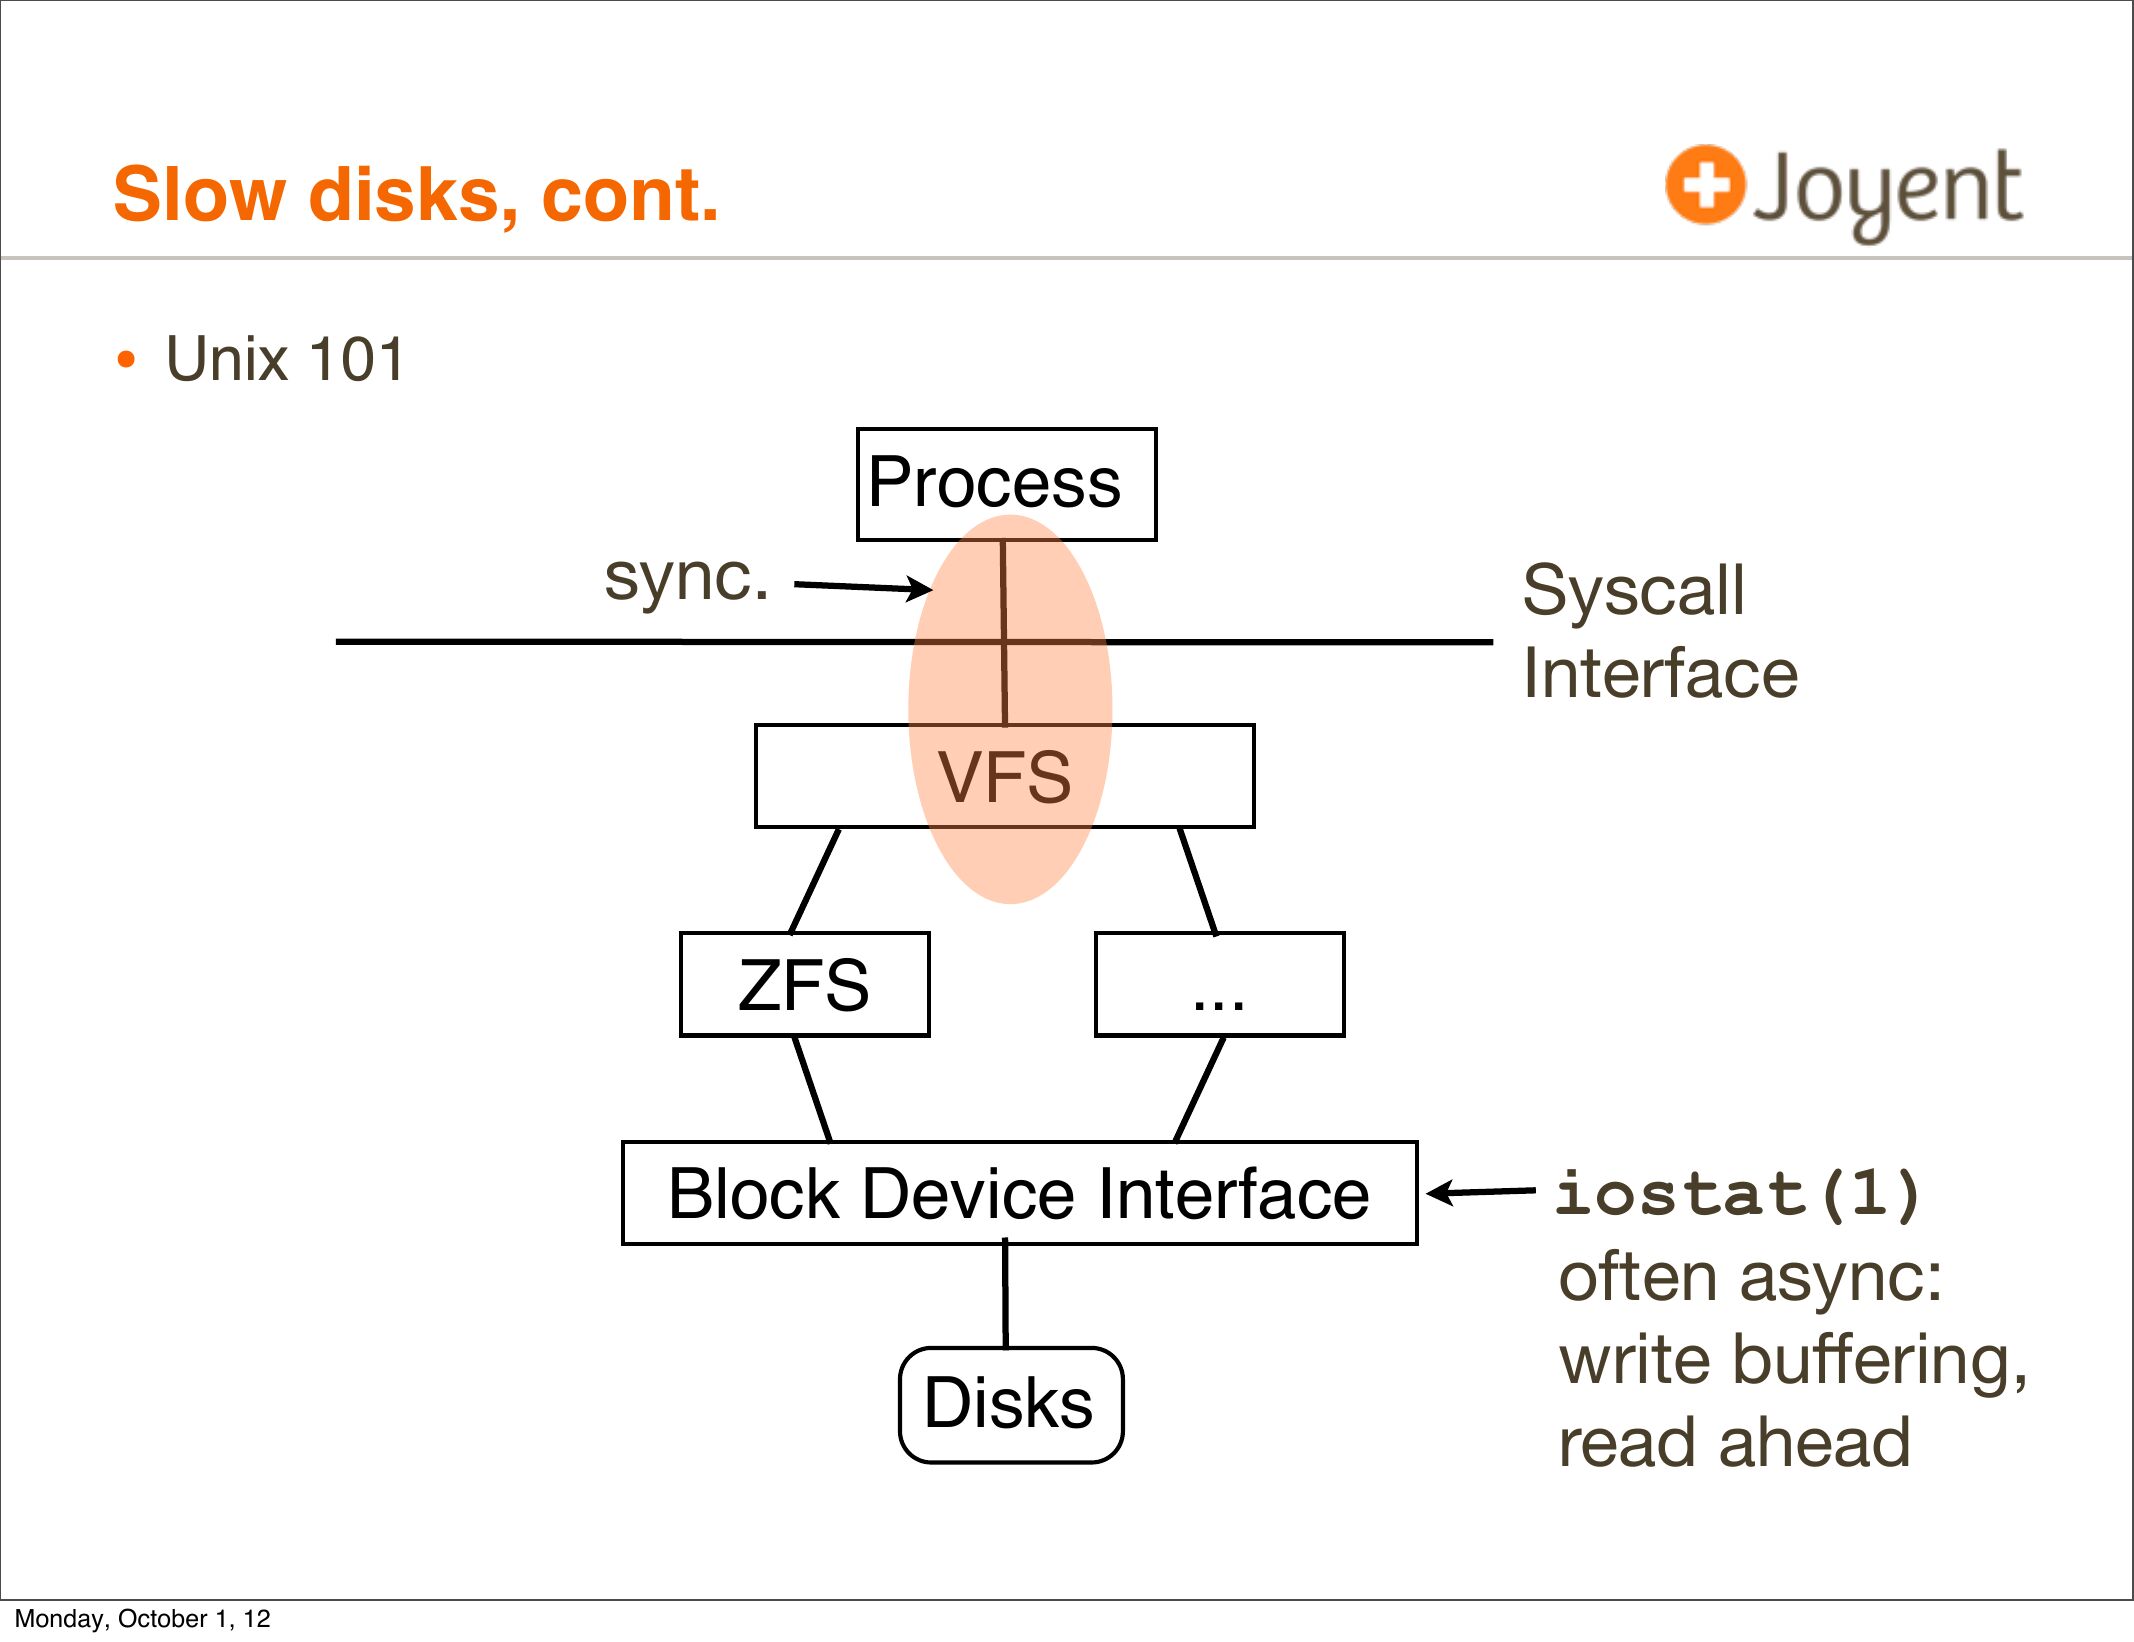
• Unix 101
Process
sync.
Syscall
Interface
VFS
ZFS
Block Device Interface
Disks
Monday, October 1, 12
iostat(1)
often async:
write buffering,
read ahead
slide 54:
Slow disks, cont.
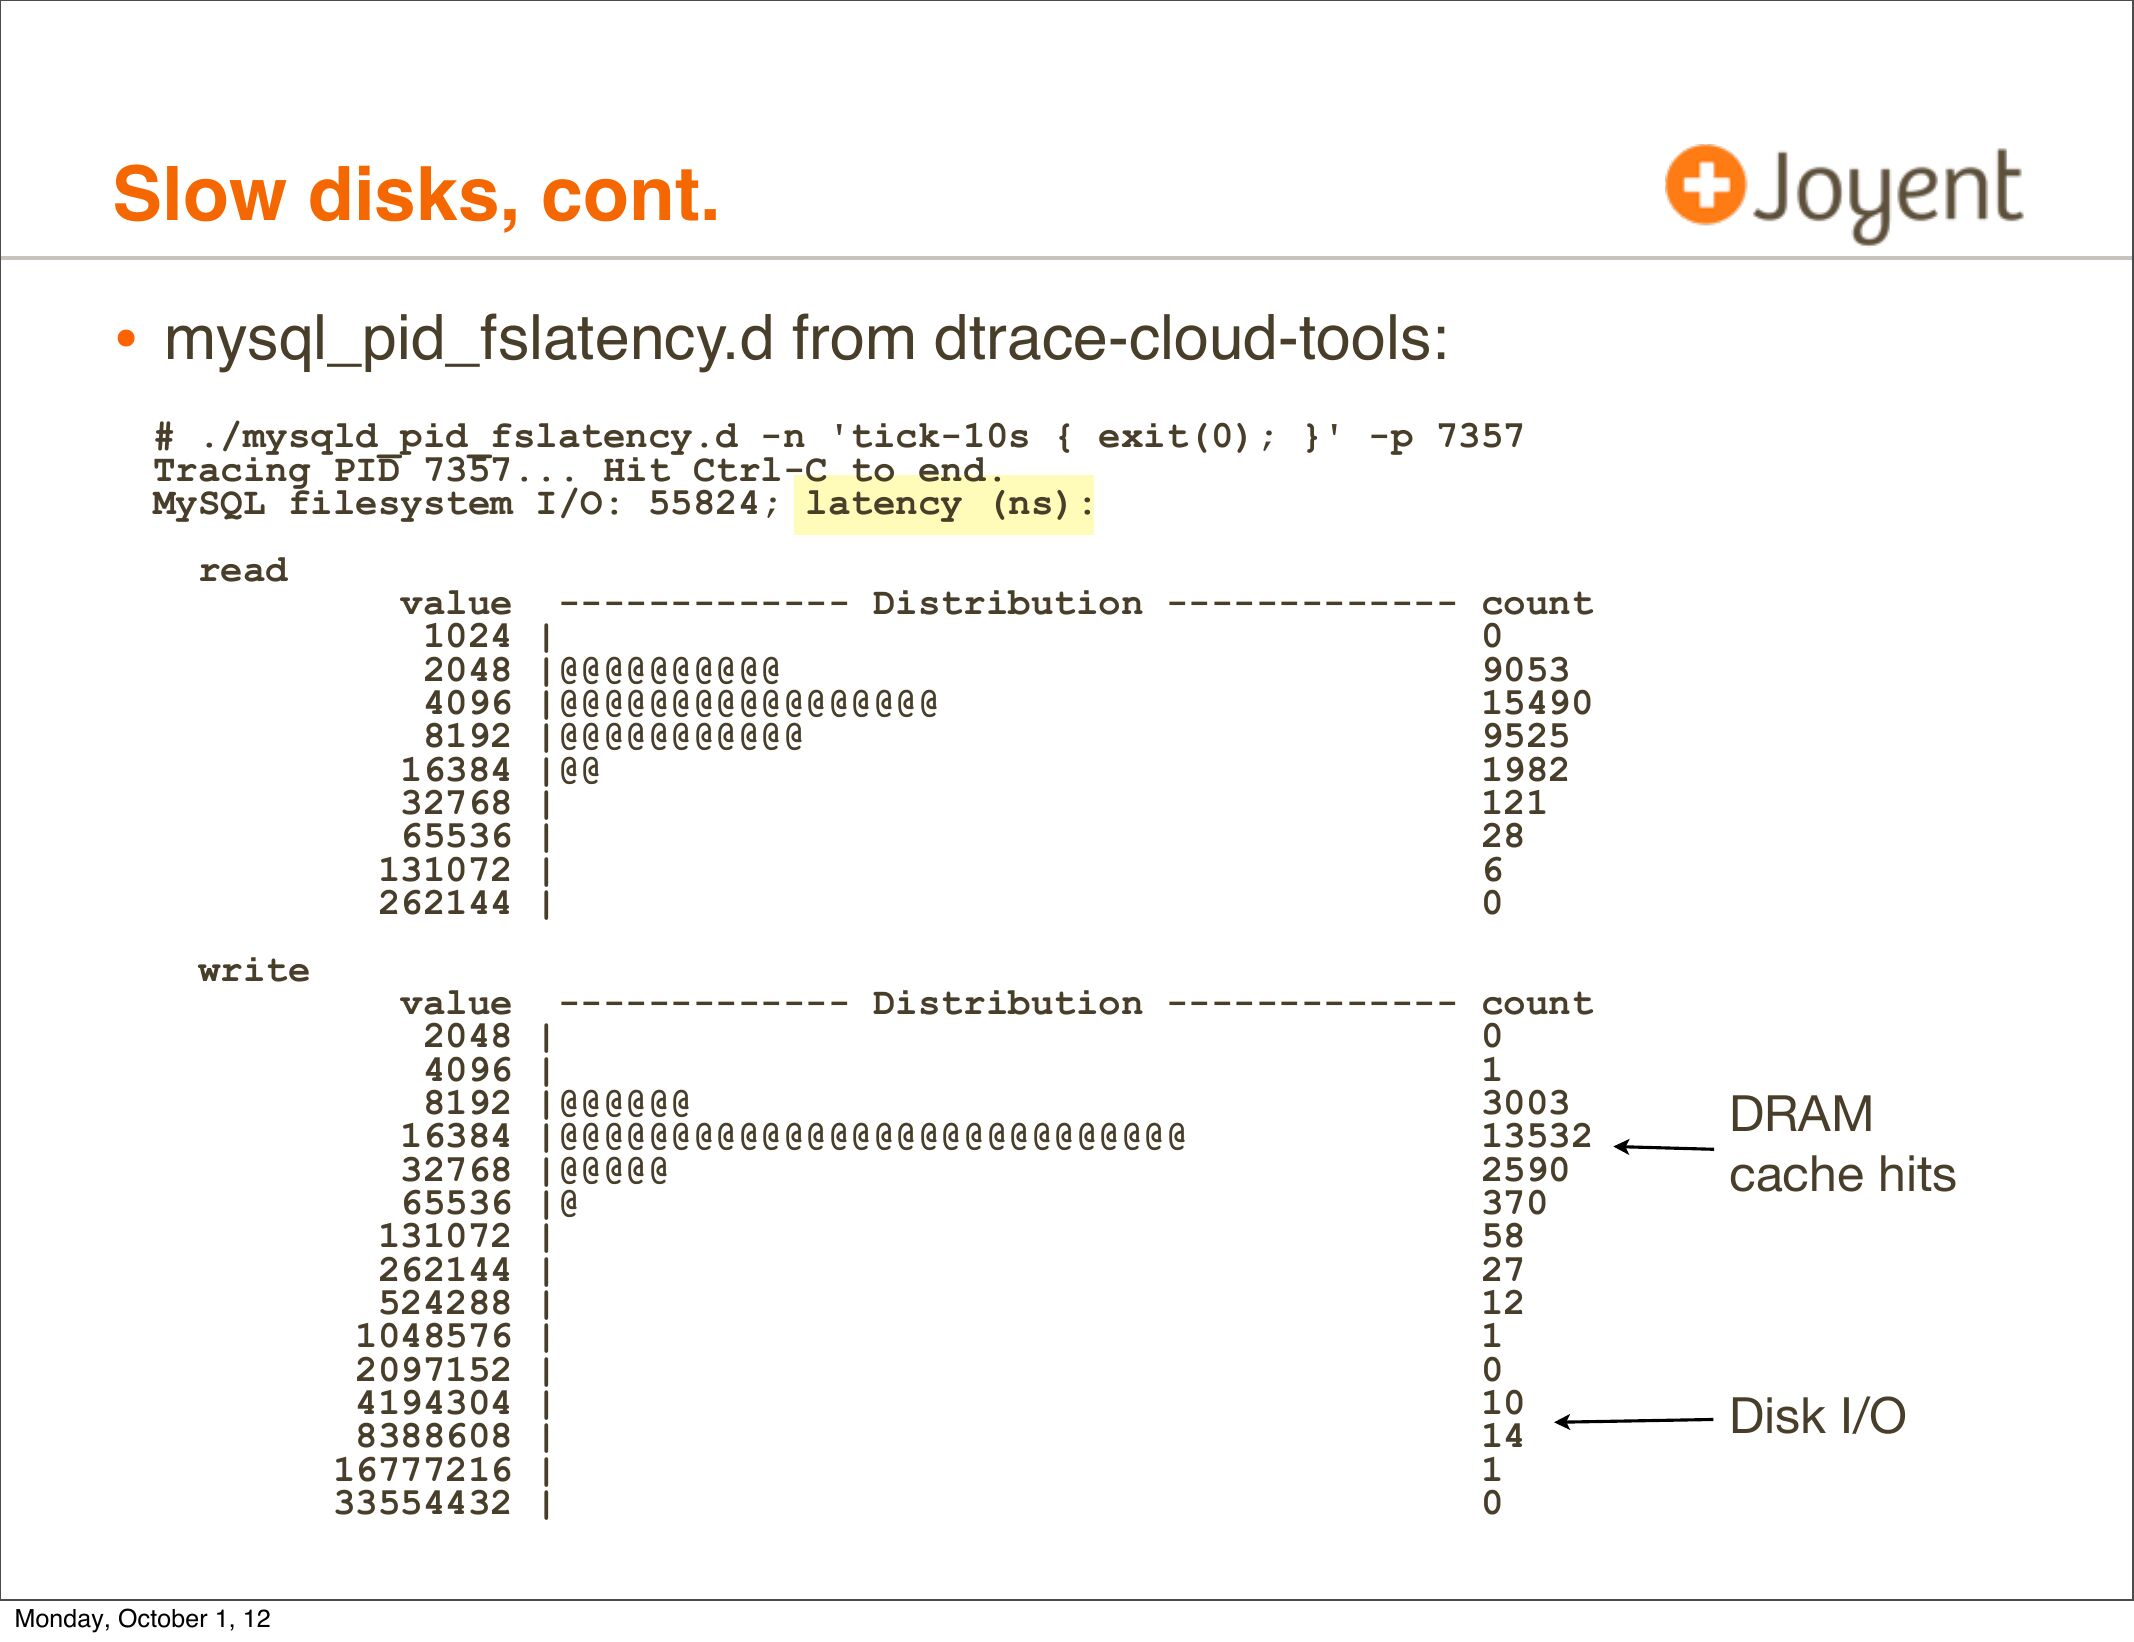
• By measuring FS latency in application-synchronous context we
can either confirm or rule-out FS/disk origin latency.
• Including expressing FS latency during MySQL query, so that
the issue can be quantified, and speedup calculated.
• Ideally, this would be possible from within the SmartMachine, so
both customer and operator can run the DTrace script. This is
possible using:
• pid provider: trace and time MySQL FS functions
• syscall provider: trace and time read/write syscalls for FS file
descriptors (hence needing fds[].fi_fs; otherwise cache open())
Monday, October 1, 12
slide 55:
Slow disks, cont.
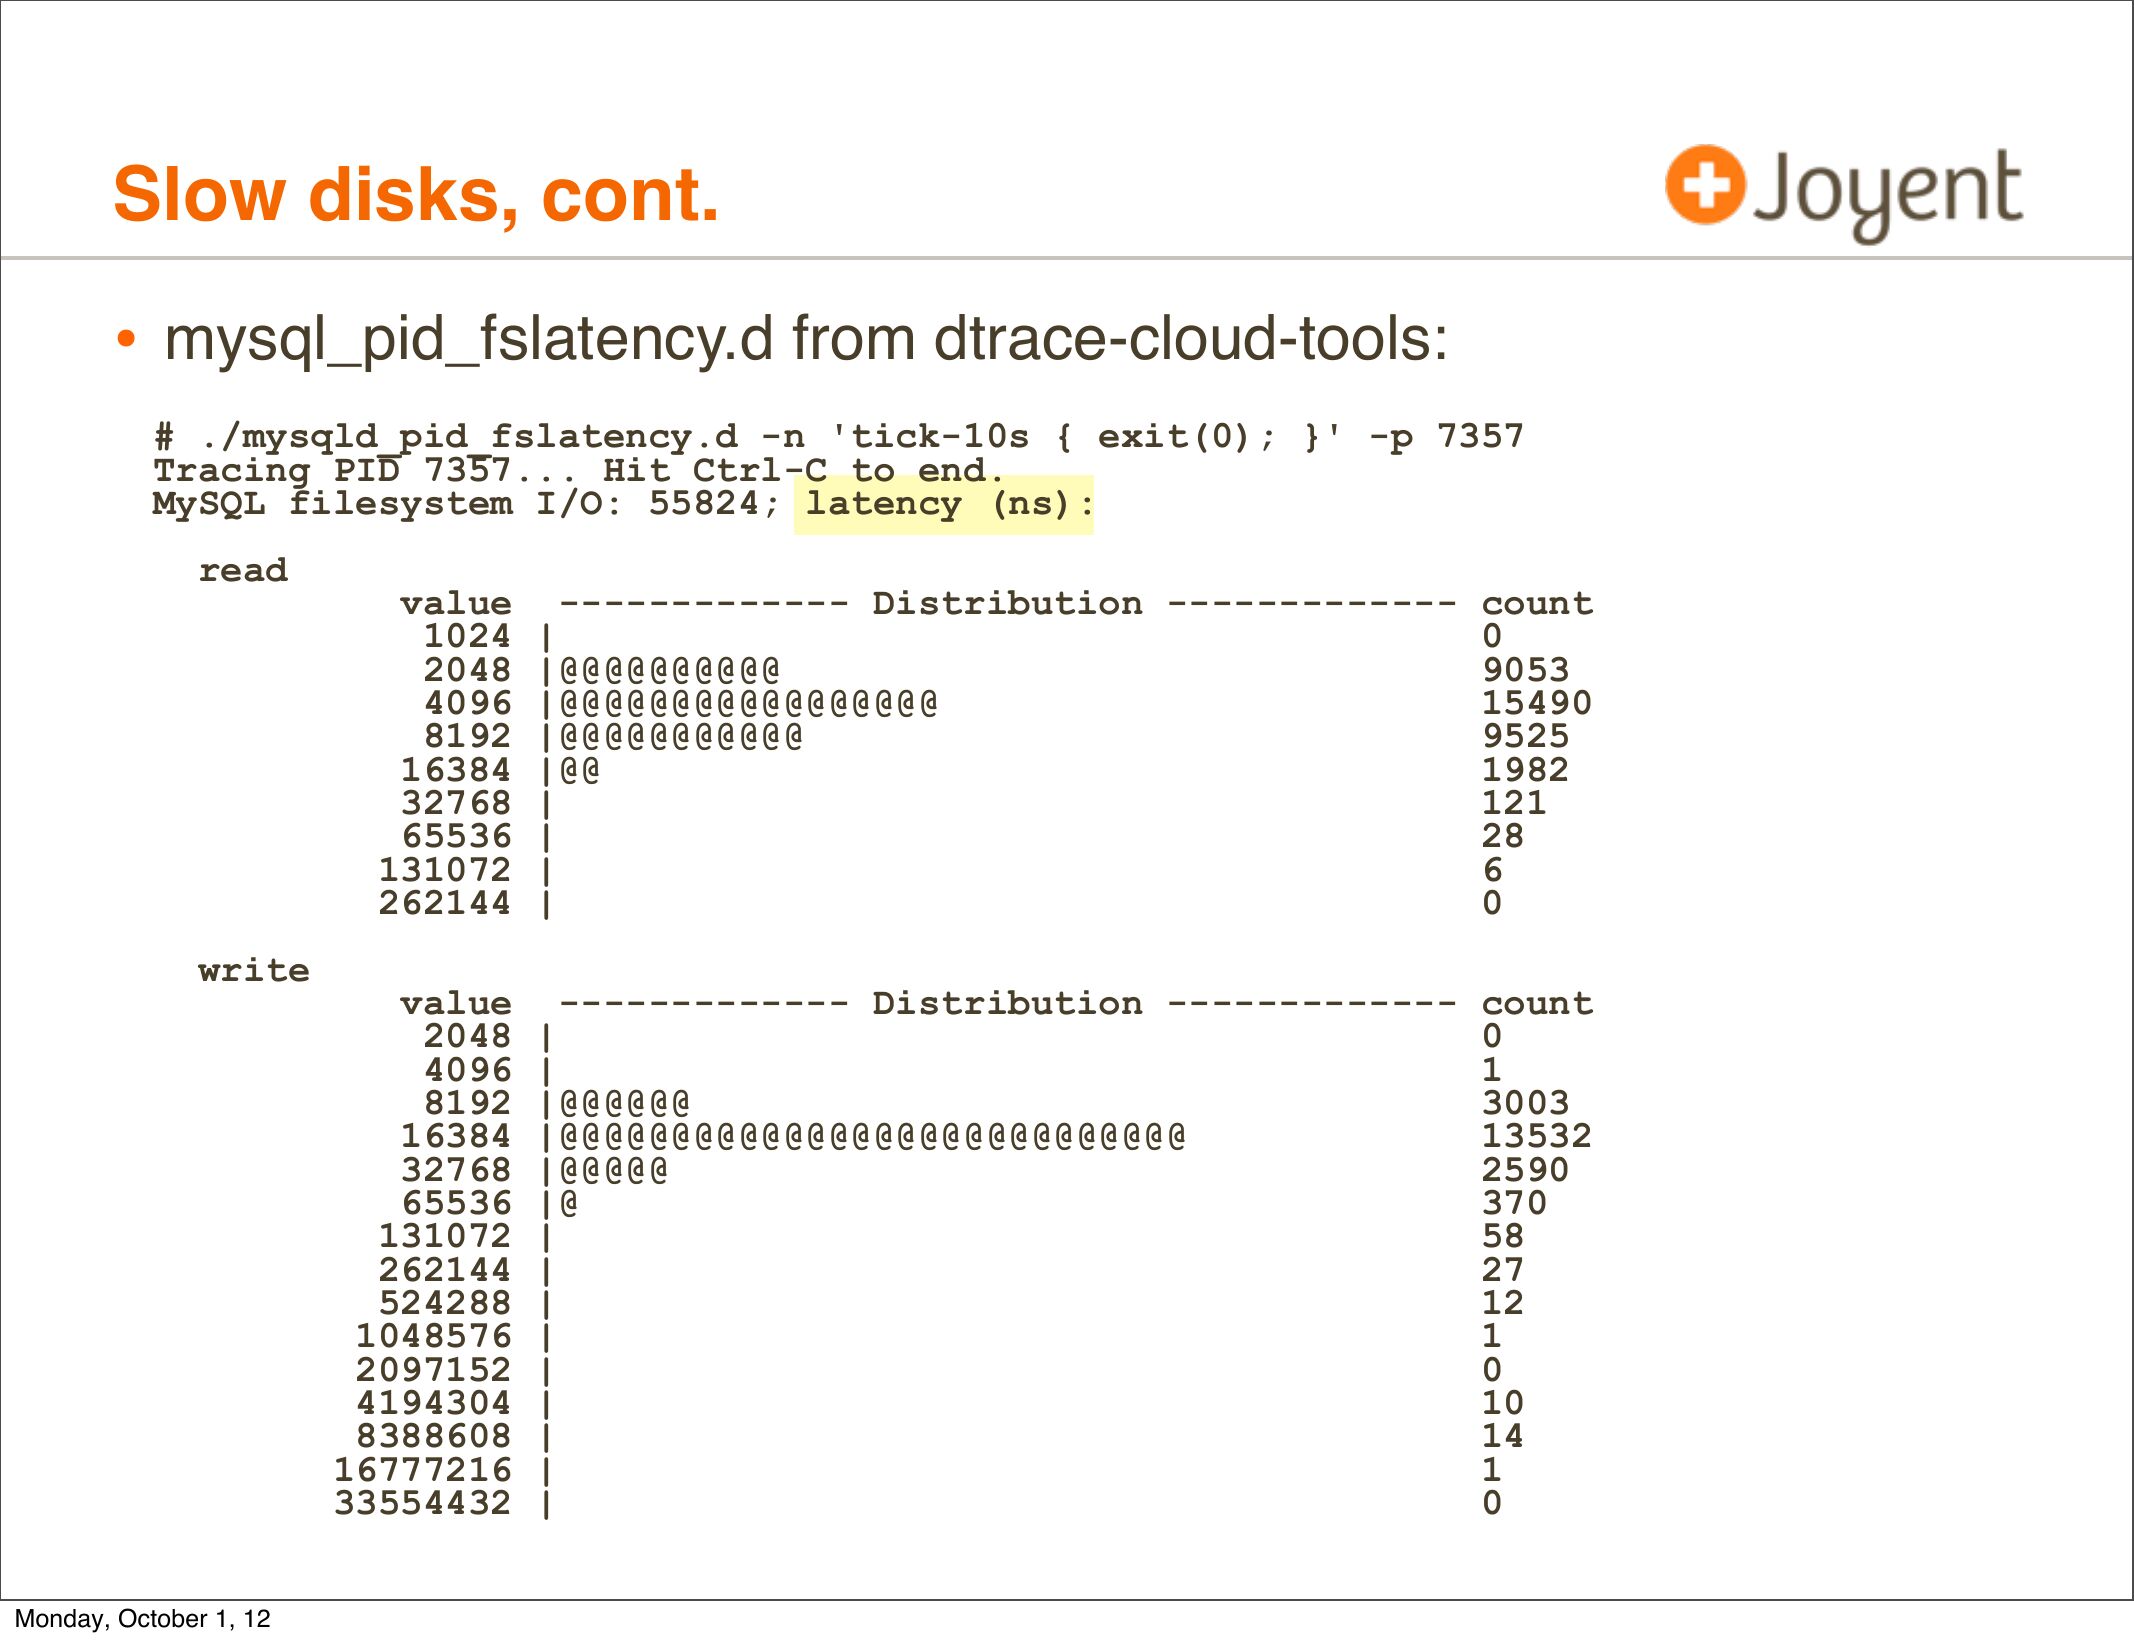
• mysql_pid_fslatency.d from dtrace-cloud-tools:
# ./mysqld_pid_fslatency.d -n 'tick-10s { exit(0); }' -p 7357
Tracing PID 7357... Hit Ctrl-C to end.
MySQL filesystem I/O: 55824; latency (ns):
read
write
Monday, October 1, 12
value ------------- Distribution ------------- count
1024 |
2048 |@@@@@@@@@@
4096 |@@@@@@@@@@@@@@@@@
8192 |@@@@@@@@@@@
16384 |@@
32768 |
65536 |
131072 |
262144 |
value ------------- Distribution ------------- count
2048 |
4096 |
8192 |@@@@@@
16384 |@@@@@@@@@@@@@@@@@@@@@@@@@@@@
32768 |@@@@@
65536 |@
131072 |
262144 |
524288 |
1048576 |
2097152 |
4194304 |
8388608 |
16777216 |
33554432 |
slide 56:
Slow disks, cont.
• mysql_pid_fslatency.d from dtrace-cloud-tools:
# ./mysqld_pid_fslatency.d -n 'tick-10s { exit(0); }' -p 7357
Tracing PID 7357... Hit Ctrl-C to end.
MySQL filesystem I/O: 55824; latency (ns):
read
write
Monday, October 1, 12
value ------------- Distribution ------------- count
1024 |
2048 |@@@@@@@@@@
4096 |@@@@@@@@@@@@@@@@@
8192 |@@@@@@@@@@@
16384 |@@
32768 |
65536 |
131072 |
262144 |
value ------------- Distribution ------------- count
2048 |
4096 |
8192 |@@@@@@
16384 |@@@@@@@@@@@@@@@@@@@@@@@@@@@@
32768 |@@@@@
65536 |@
131072 |
262144 |
524288 |
1048576 |
2097152 |
4194304 |
8388608 |
16777216 |
33554432 |
DRAM
cache hits
Disk I/O
slide 57:
Slow disks, cont.
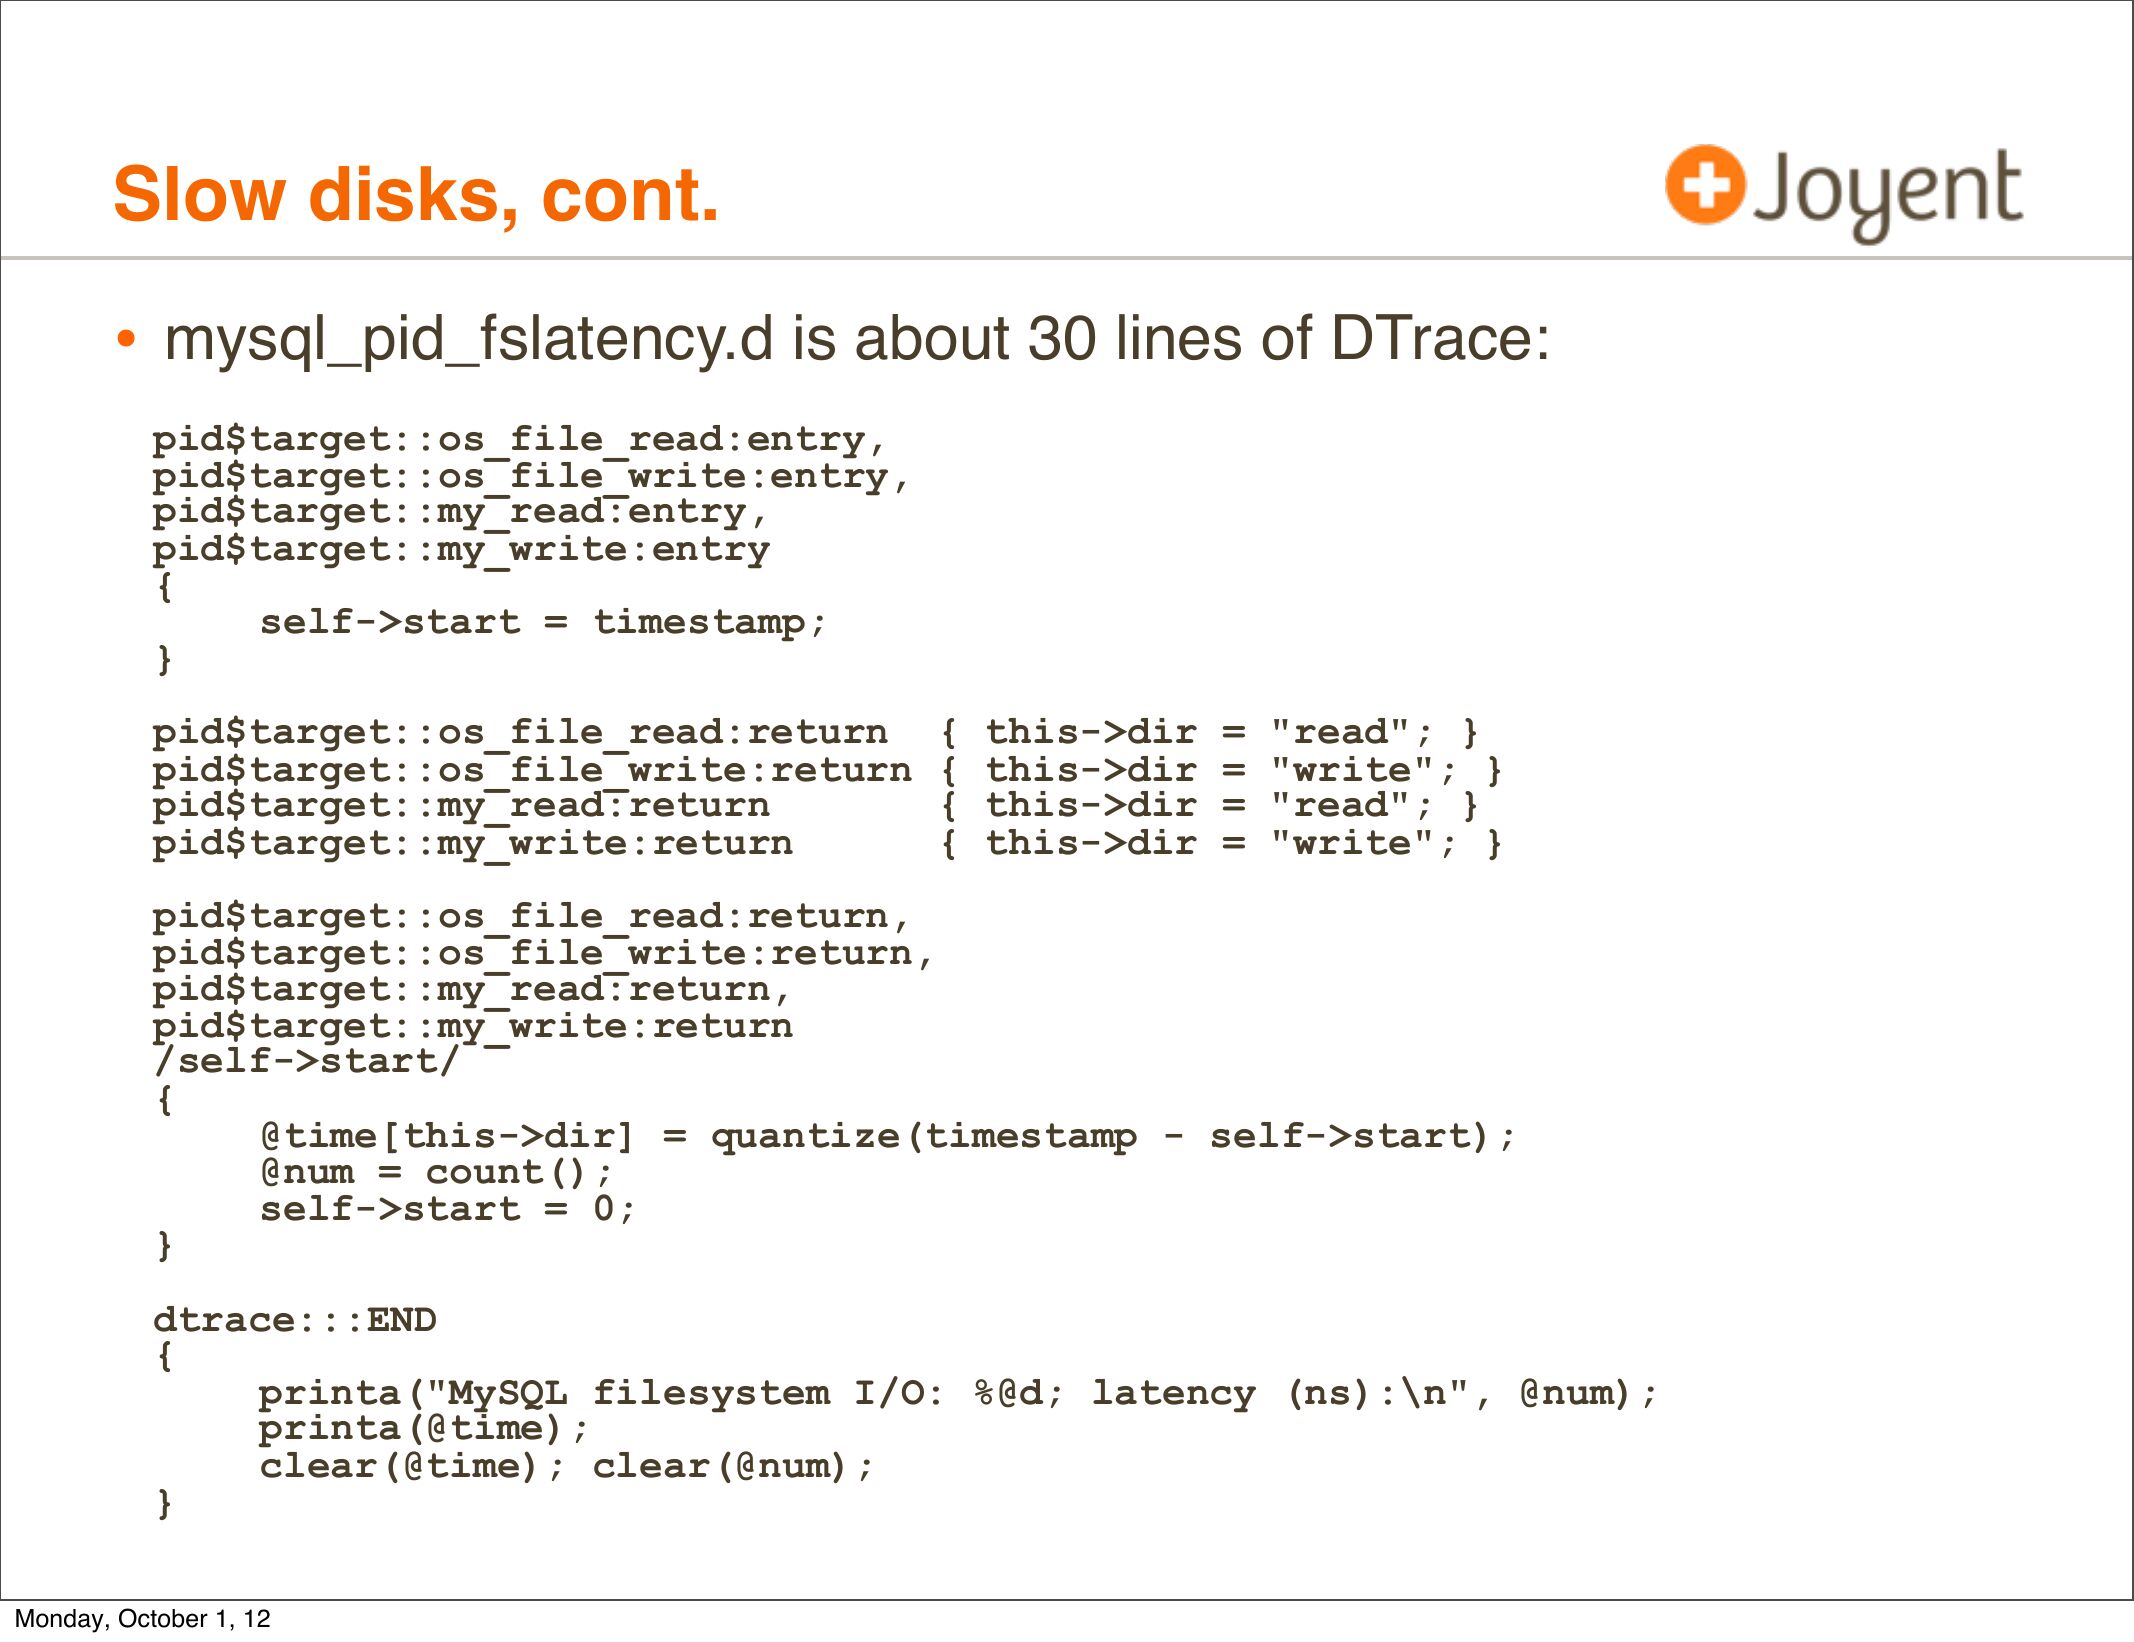
• mysql_pid_fslatency.d is about 30 lines of DTrace:
pid$target::os_file_read:entry,
pid$target::os_file_write:entry,
pid$target::my_read:entry,
pid$target::my_write:entry
self->gt;start = timestamp;
pid$target::os_file_read:return { this->gt;dir = "read"; }
pid$target::os_file_write:return { this->gt;dir = "write"; }
pid$target::my_read:return
{ this->gt;dir = "read"; }
pid$target::my_write:return
{ this->gt;dir = "write"; }
pid$target::os_file_read:return,
pid$target::os_file_write:return,
pid$target::my_read:return,
pid$target::my_write:return
/self->gt;start/
@time[this->gt;dir] = quantize(timestamp - self->gt;start);
@num = count();
self->gt;start = 0;
dtrace:::END
printa("MySQL filesystem I/O: %@d; latency (ns):\n", @num);
printa(@time);
clear(@time); clear(@num);
Monday, October 1, 12
slide 58:
Slow disks, cont.
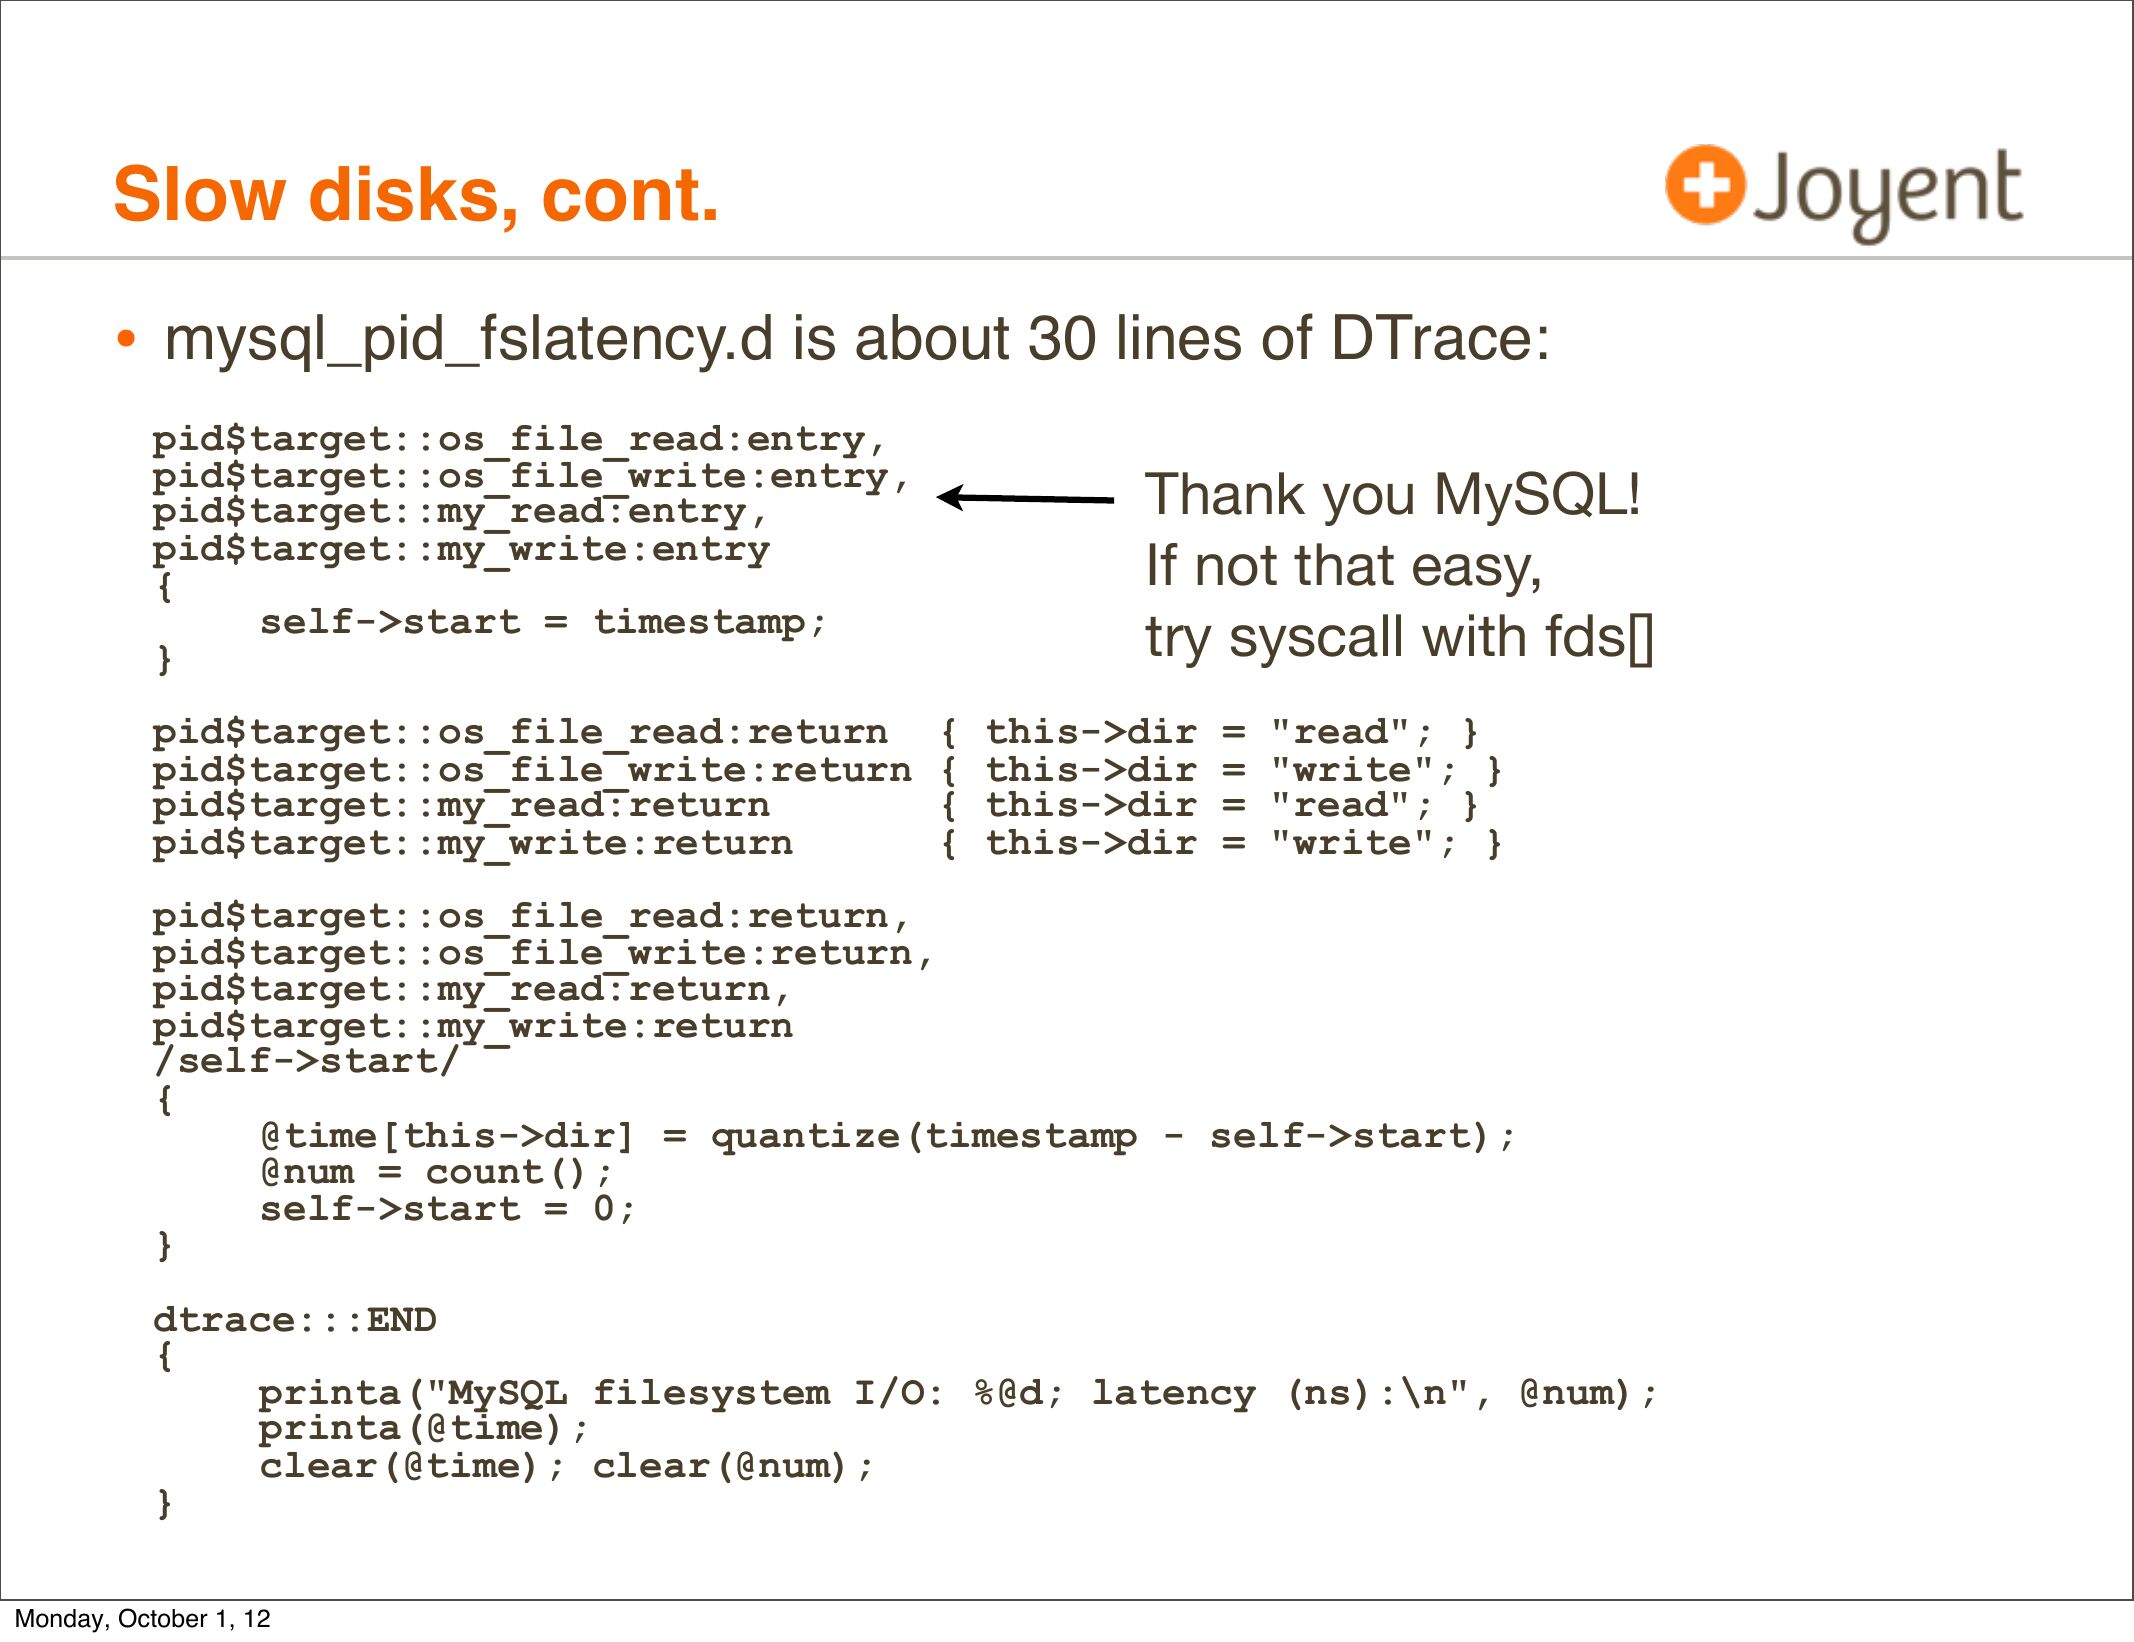
• mysql_pid_fslatency.d is about 30 lines of DTrace:
pid$target::os_file_read:entry,
pid$target::os_file_write:entry,
pid$target::my_read:entry,
pid$target::my_write:entry
self->gt;start = timestamp;
Thank you MySQL!
If not that easy,
try syscall with fds[]
pid$target::os_file_read:return { this->gt;dir = "read"; }
pid$target::os_file_write:return { this->gt;dir = "write"; }
pid$target::my_read:return
{ this->gt;dir = "read"; }
pid$target::my_write:return
{ this->gt;dir = "write"; }
pid$target::os_file_read:return,
pid$target::os_file_write:return,
pid$target::my_read:return,
pid$target::my_write:return
/self->gt;start/
@time[this->gt;dir] = quantize(timestamp - self->gt;start);
@num = count();
self->gt;start = 0;
dtrace:::END
printa("MySQL filesystem I/O: %@d; latency (ns):\n", @num);
printa(@time);
clear(@time); clear(@num);
Monday, October 1, 12
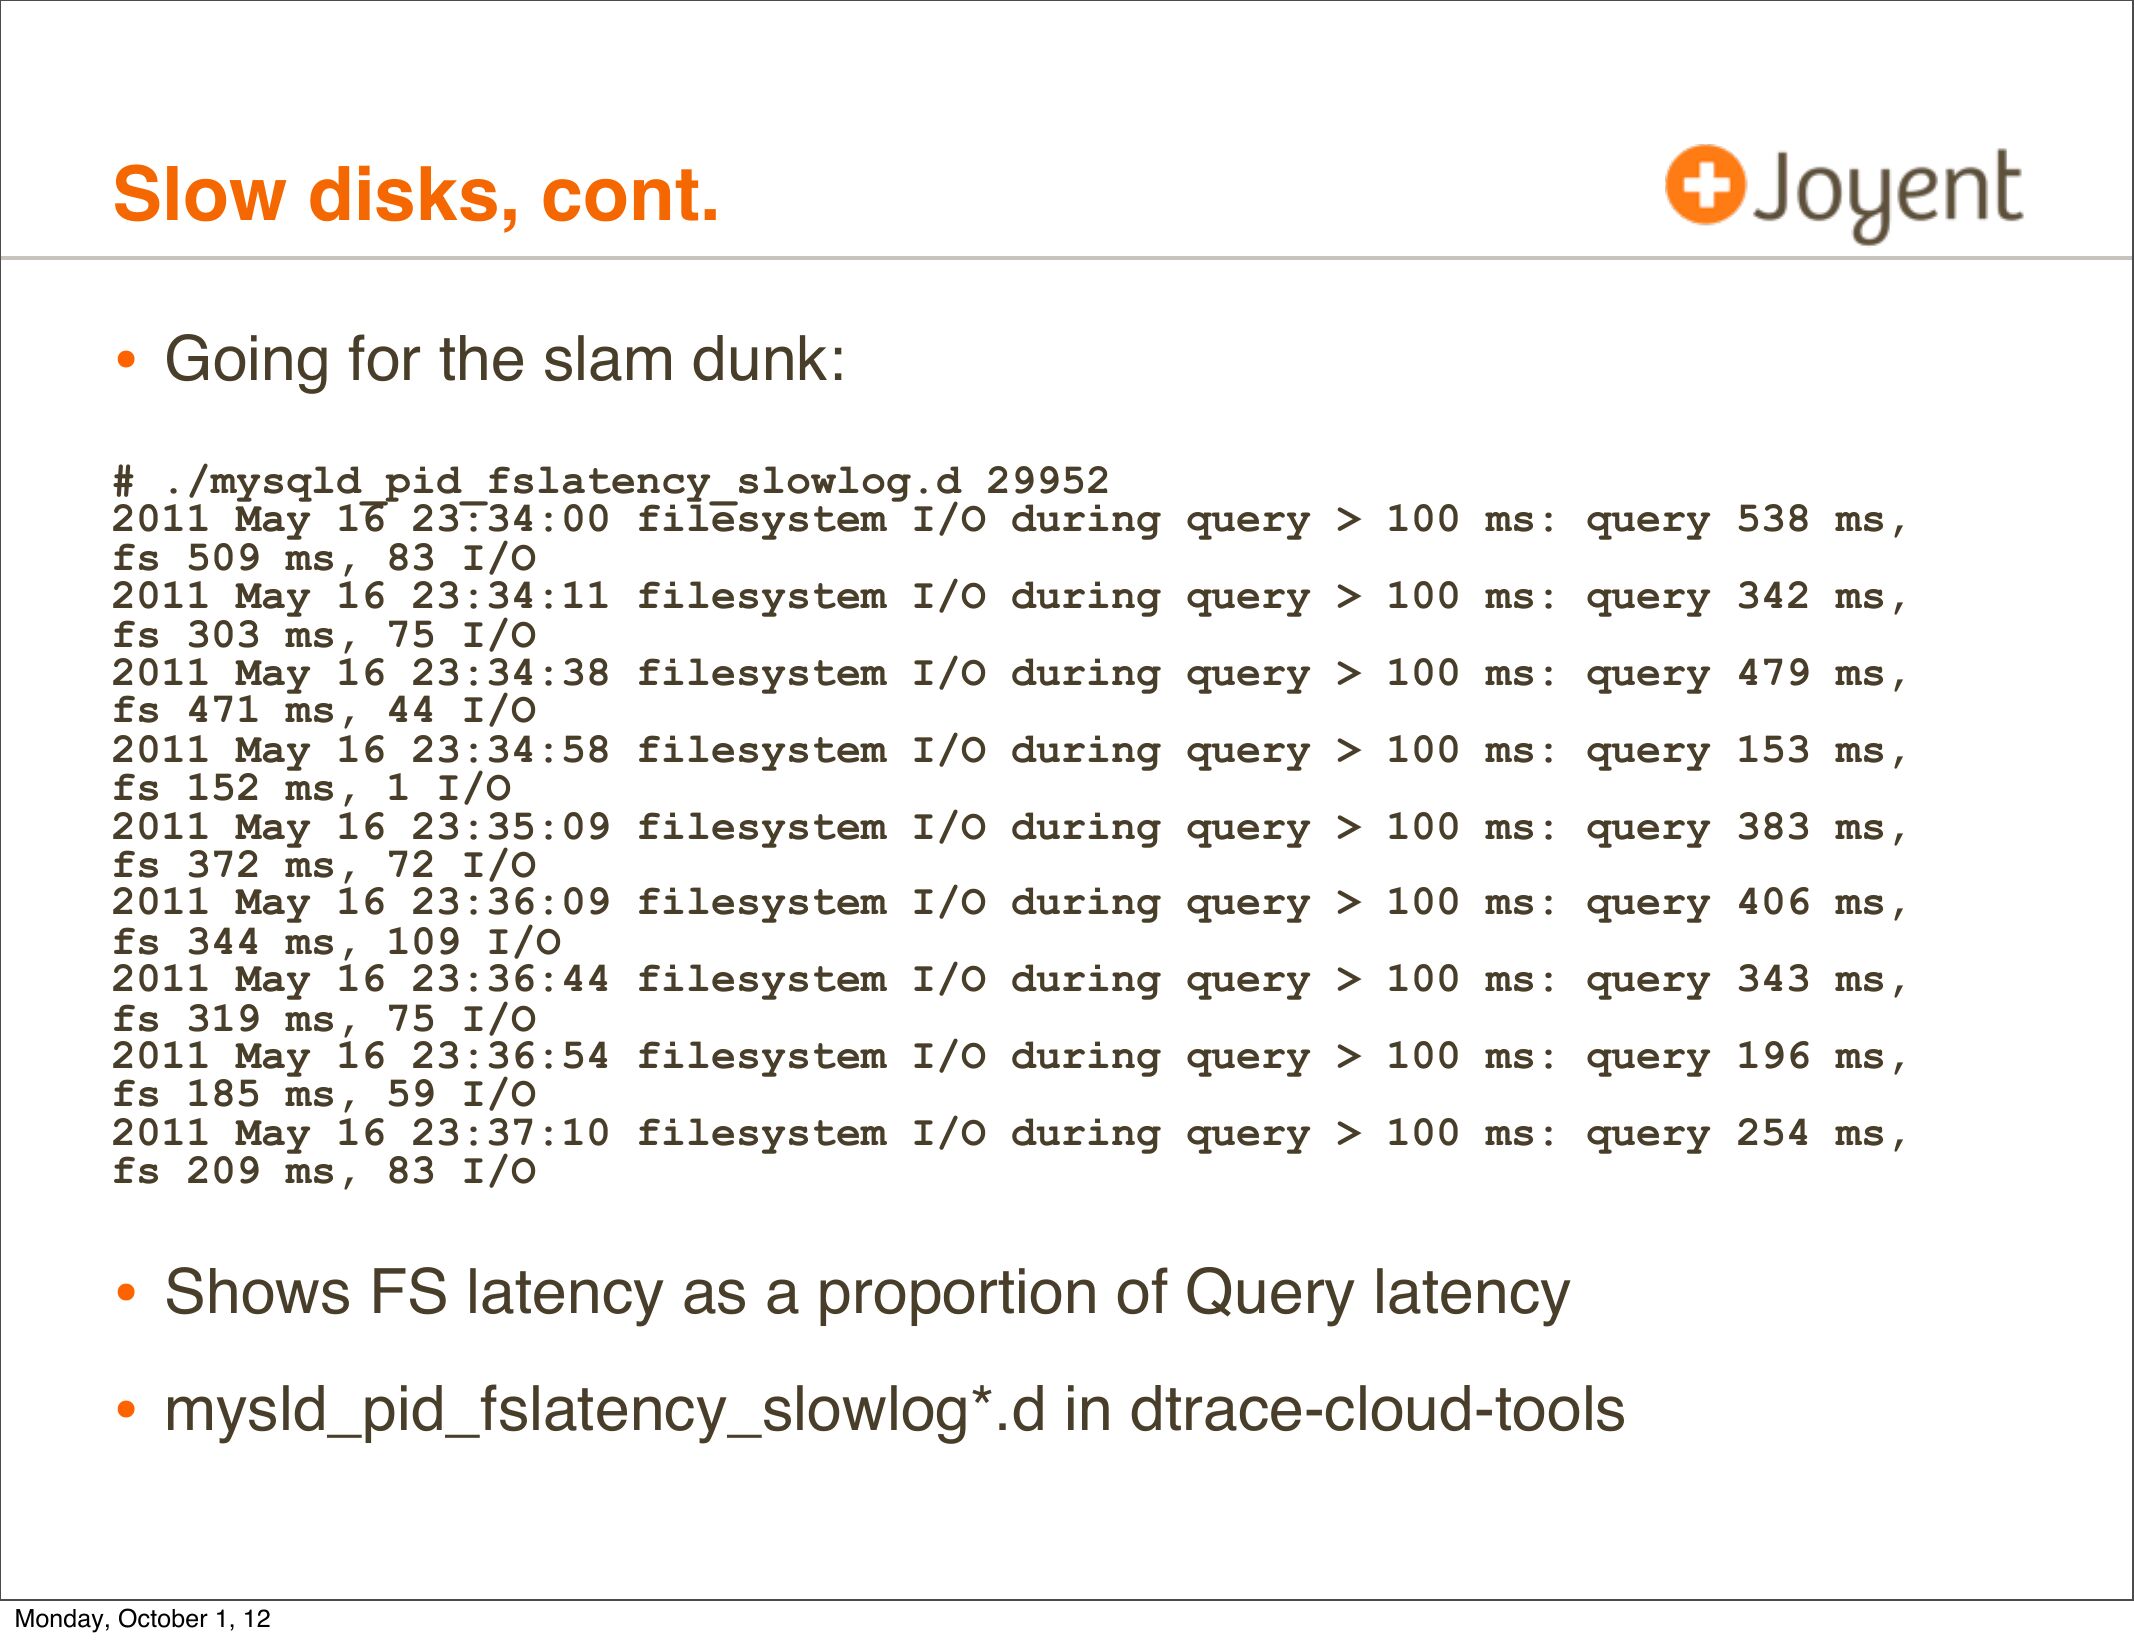
slide 59:Slow disks, cont. • Going for the slam dunk: # ./mysqld_pid_fslatency_slowlog.d 29952 2011 May 16 23:34:00 filesystem I/O during query >gt; 100 ms: query 538 ms, fs 509 ms, 83 I/O 2011 May 16 23:34:11 filesystem I/O during query >gt; 100 ms: query 342 ms, fs 303 ms, 75 I/O 2011 May 16 23:34:38 filesystem I/O during query >gt; 100 ms: query 479 ms, fs 471 ms, 44 I/O 2011 May 16 23:34:58 filesystem I/O during query >gt; 100 ms: query 153 ms, fs 152 ms, 1 I/O 2011 May 16 23:35:09 filesystem I/O during query >gt; 100 ms: query 383 ms, fs 372 ms, 72 I/O 2011 May 16 23:36:09 filesystem I/O during query >gt; 100 ms: query 406 ms, fs 344 ms, 109 I/O 2011 May 16 23:36:44 filesystem I/O during query >gt; 100 ms: query 343 ms, fs 319 ms, 75 I/O 2011 May 16 23:36:54 filesystem I/O during query >gt; 100 ms: query 196 ms, fs 185 ms, 59 I/O 2011 May 16 23:37:10 filesystem I/O during query >gt; 100 ms: query 254 ms, fs 209 ms, 83 I/O • Shows FS latency as a proportion of Query latency • mysld_pid_fslatency_slowlog*.d in dtrace-cloud-tools Monday, October 1, 12slide 60:
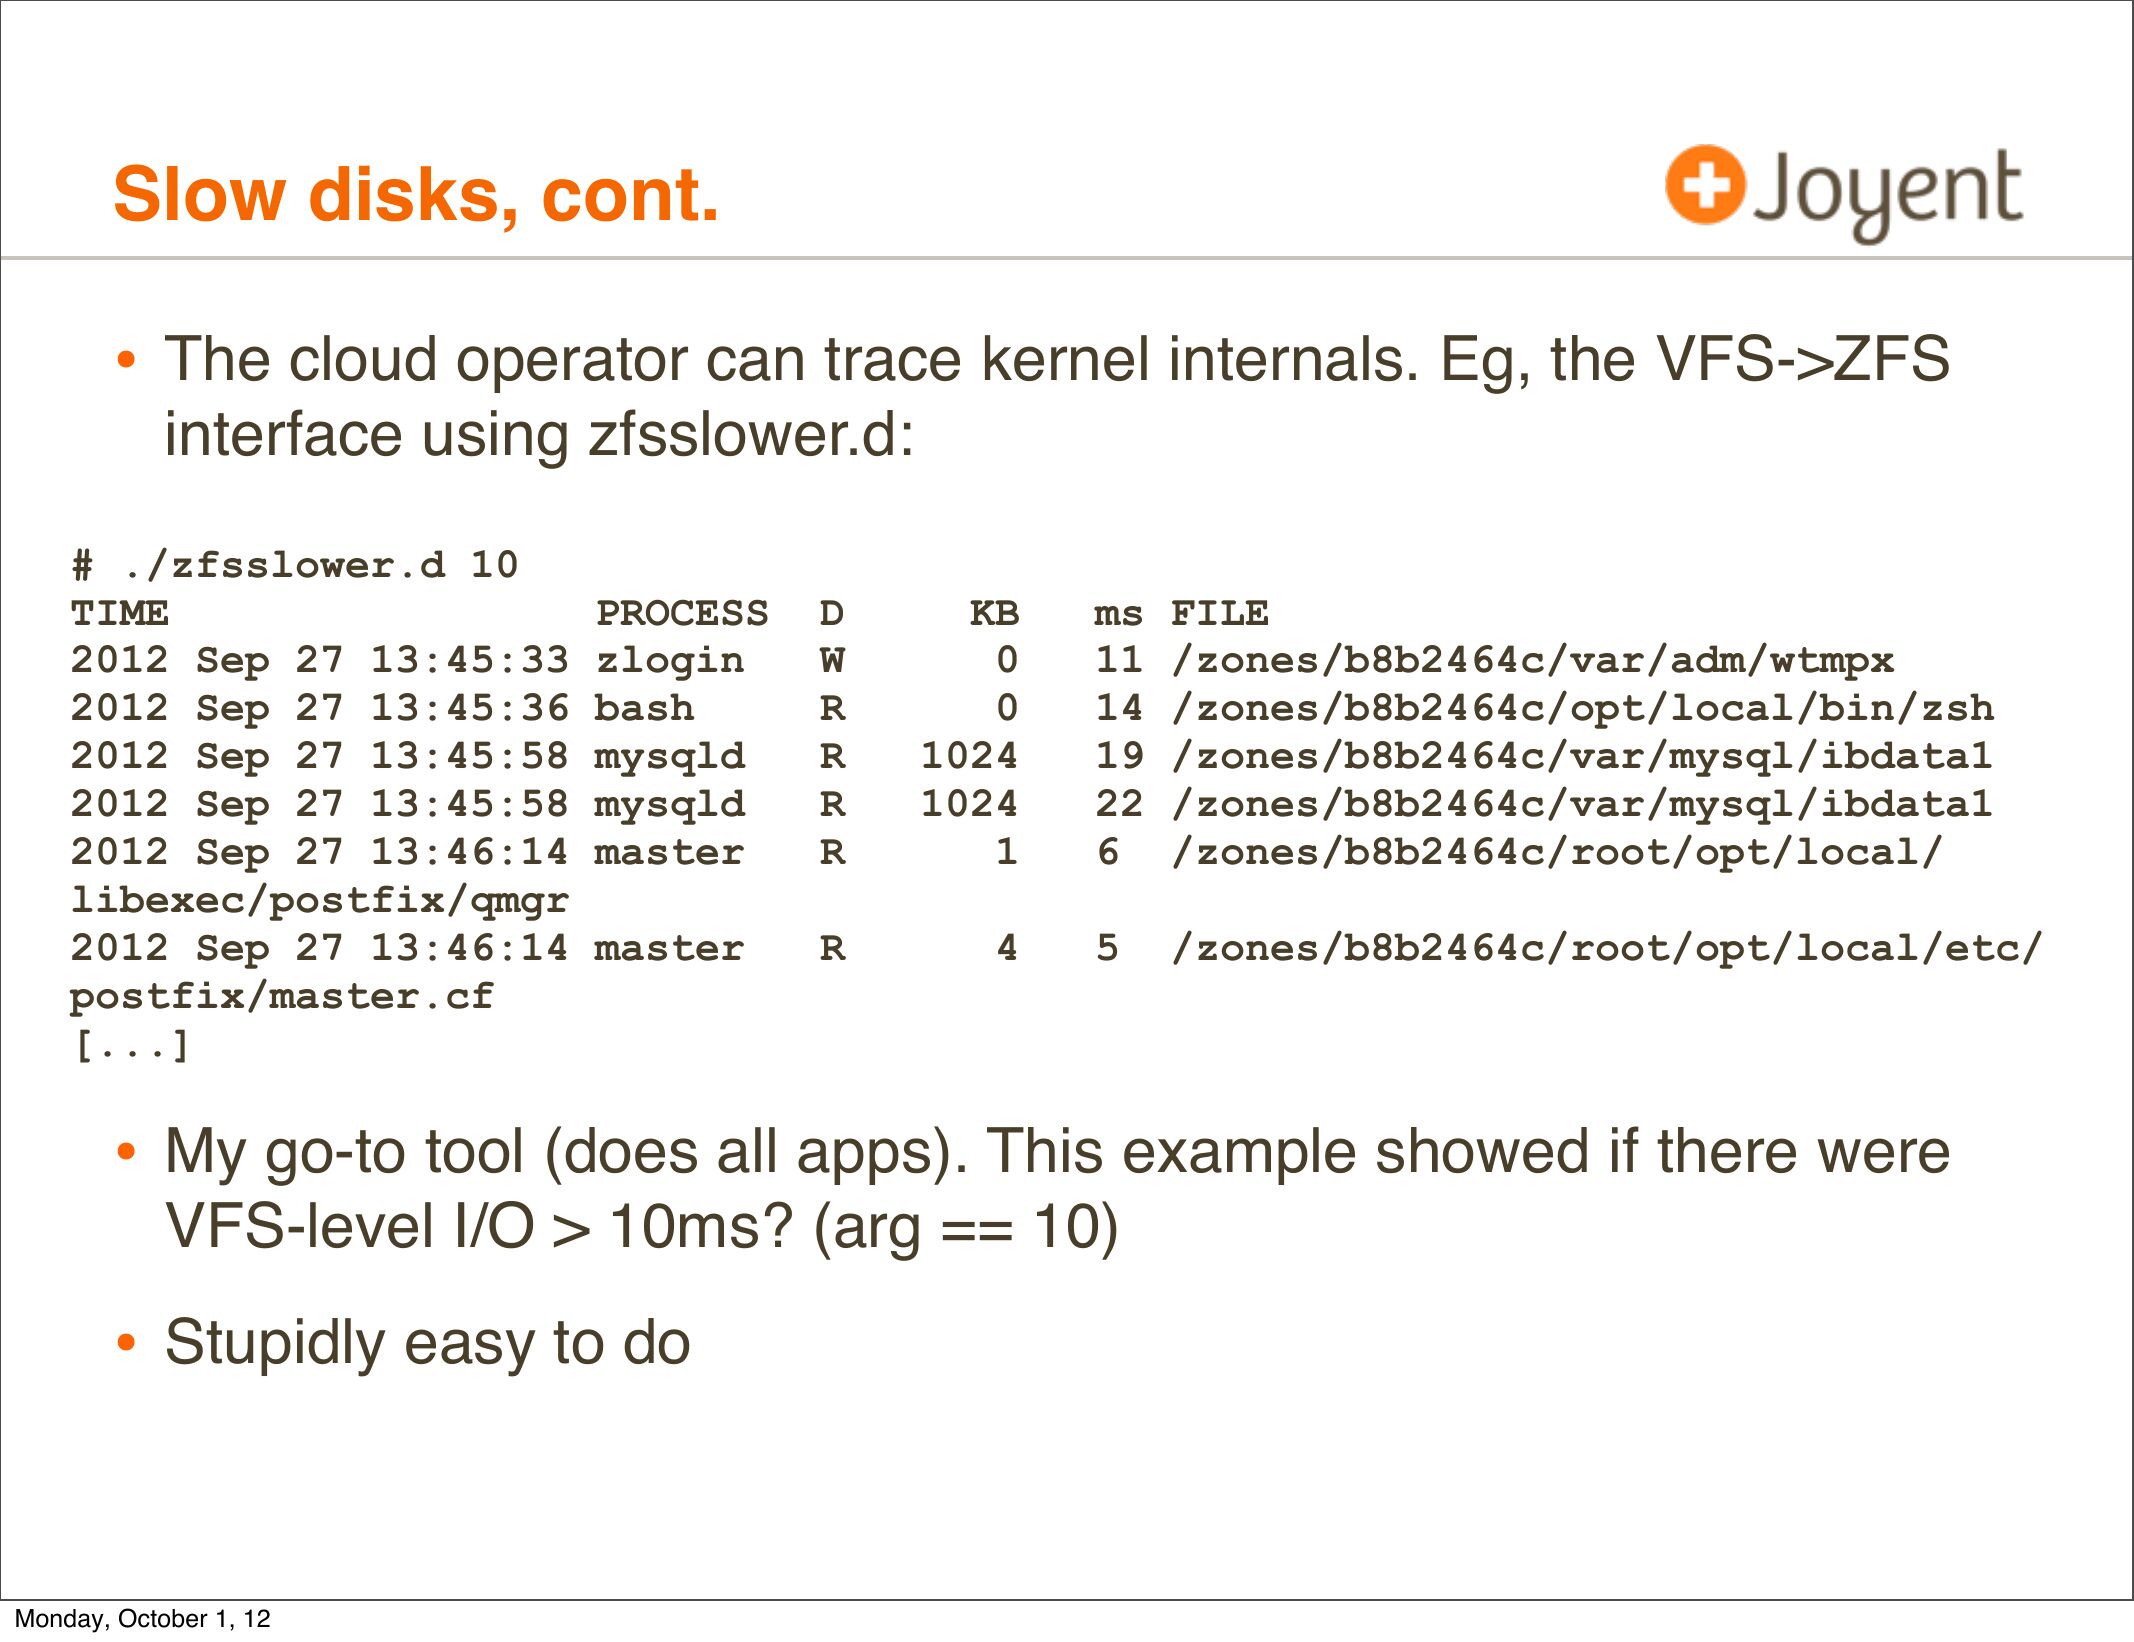
Slow disks, cont.
• The cloud operator can trace kernel internals. Eg, the VFS->gt;ZFS
interface using zfsslower.d:
# ./zfsslower.d 10
TIME
PROCESS
2012 Sep 27 13:45:33 zlogin
2012 Sep 27 13:45:36 bash
2012 Sep 27 13:45:58 mysqld
2012 Sep 27 13:45:58 mysqld
2012 Sep 27 13:46:14 master
libexec/postfix/qmgr
2012 Sep 27 13:46:14 master
postfix/master.cf
[...]
ms FILE
11 /zones/b8b2464c/var/adm/wtmpx
14 /zones/b8b2464c/opt/local/bin/zsh
19 /zones/b8b2464c/var/mysql/ibdata1
22 /zones/b8b2464c/var/mysql/ibdata1
6 /zones/b8b2464c/root/opt/local/
/zones/b8b2464c/root/opt/local/etc/
• My go-to tool (does all apps). This example showed if there were
VFS-level I/O >gt; 10ms? (arg == 10)
• Stupidly easy to do
Monday, October 1, 12
slide 61:
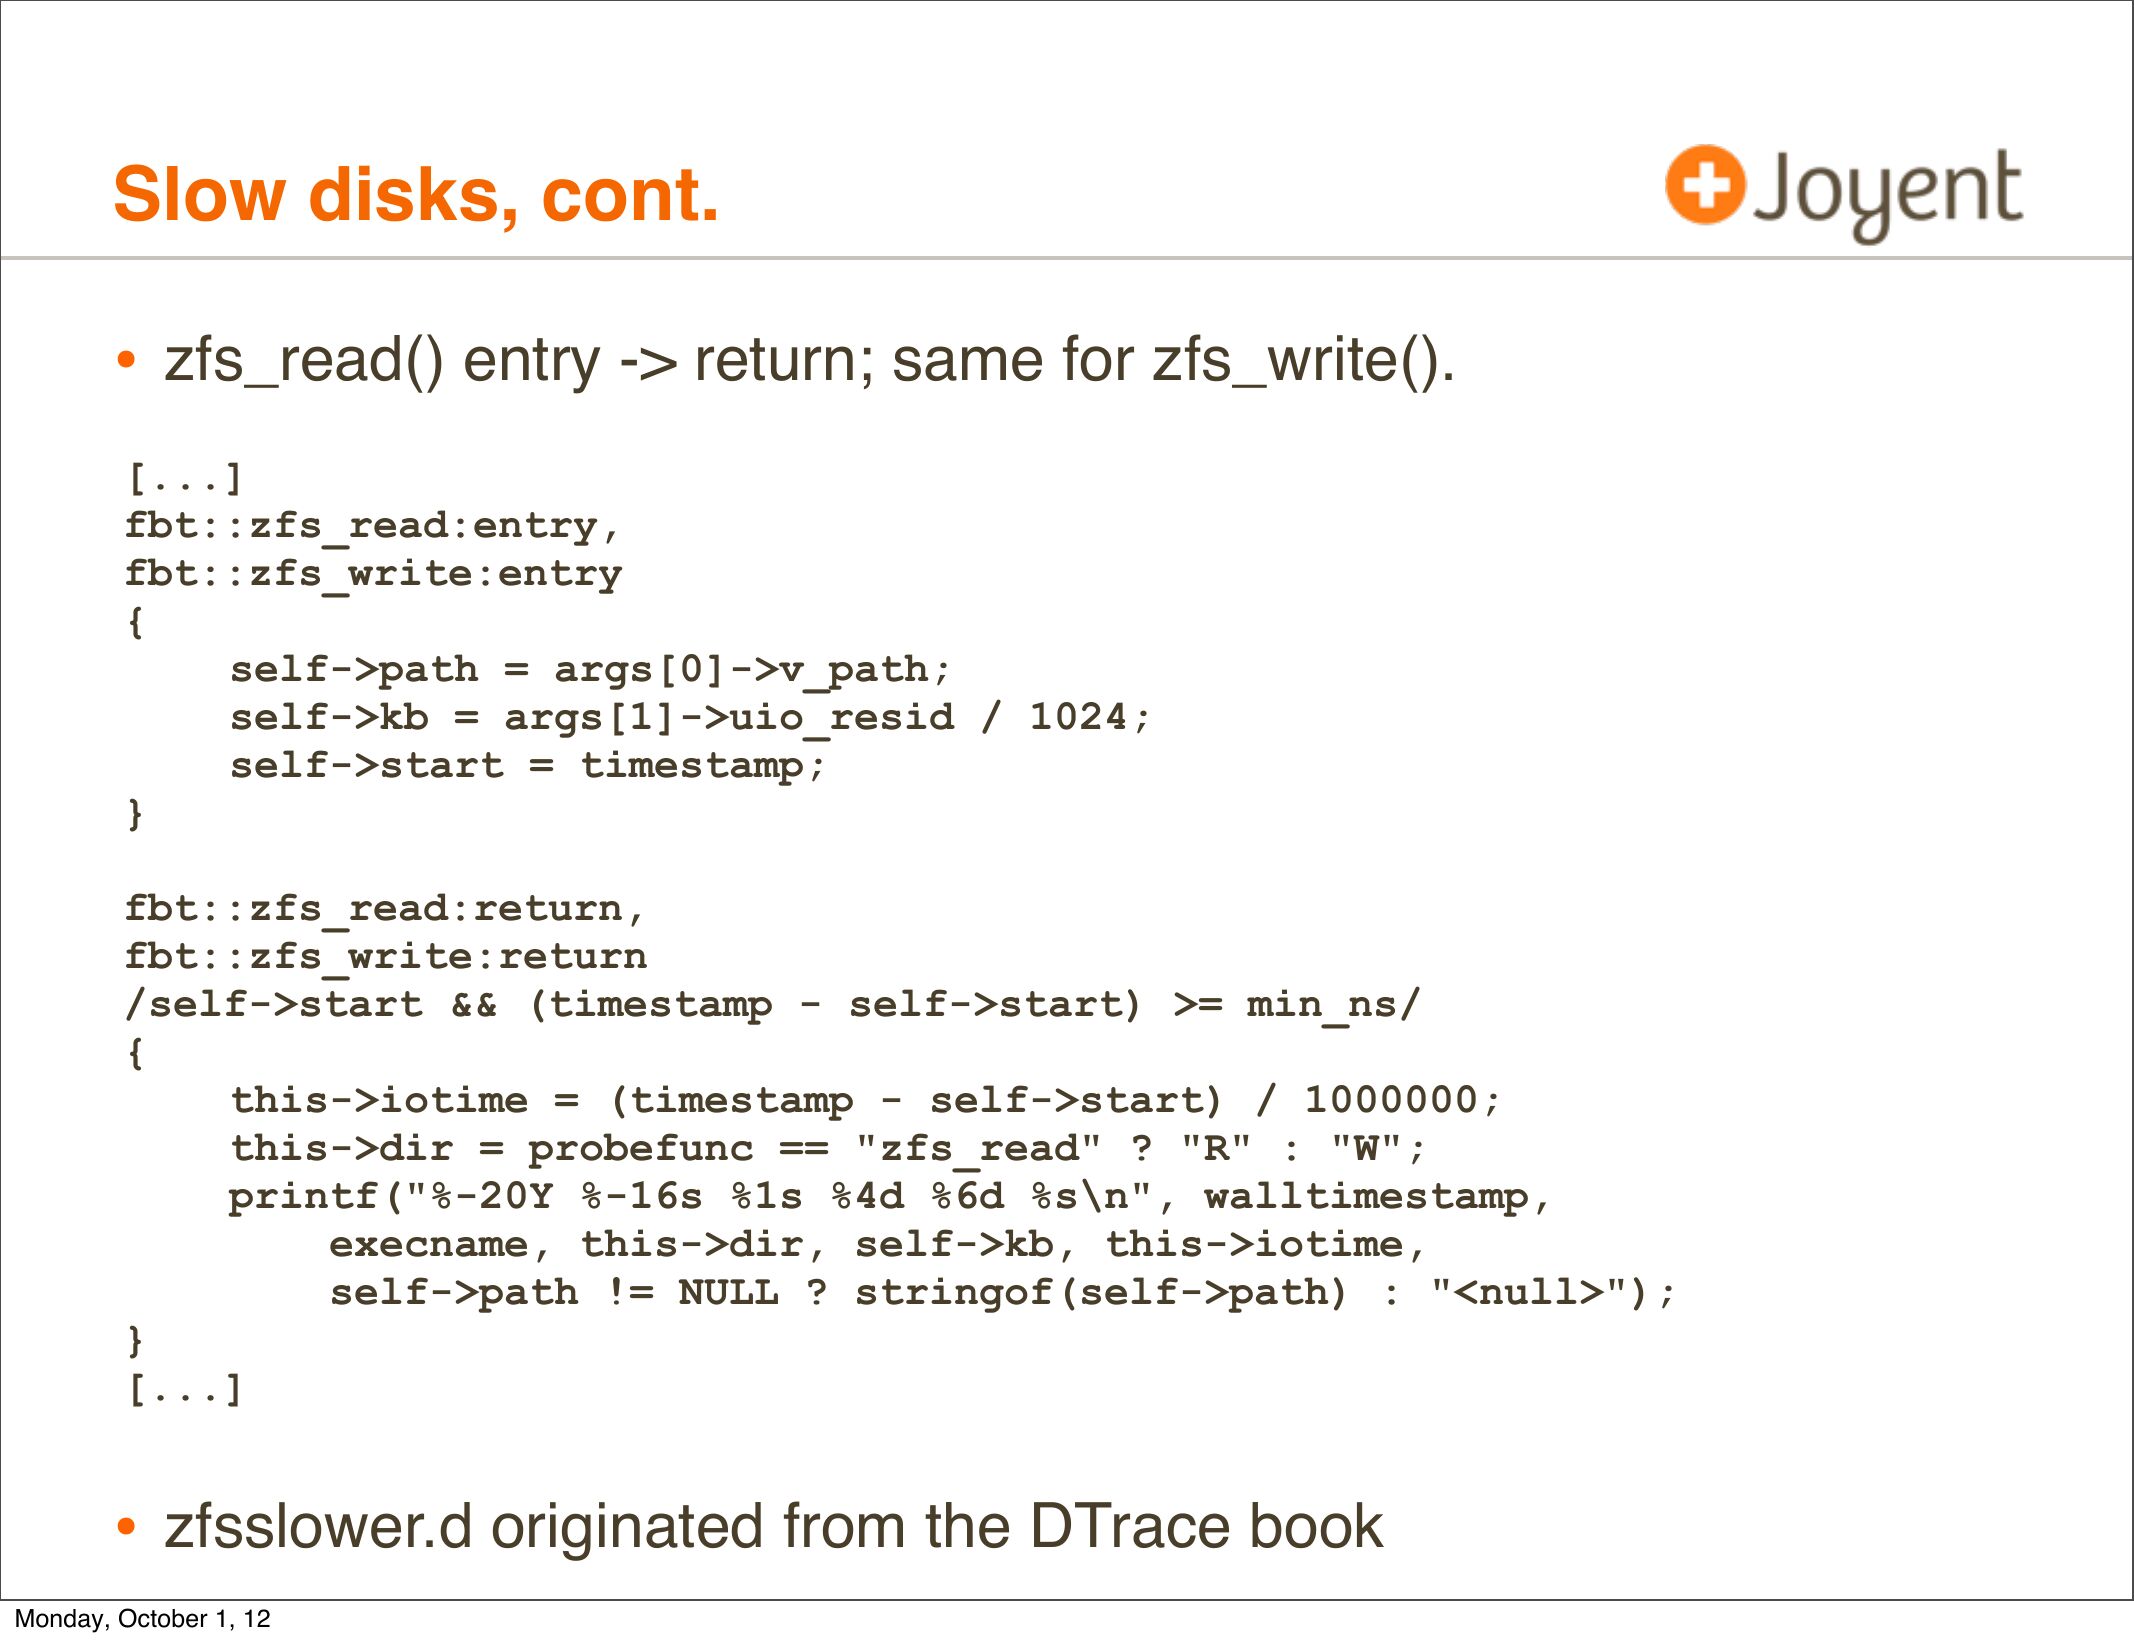
Slow disks, cont.
• zfs_read() entry ->gt; return; same for zfs_write().
[...]
fbt::zfs_read:entry,
fbt::zfs_write:entry
self->gt;path = args[0]->gt;v_path;
self->gt;kb = args[1]->gt;uio_resid / 1024;
self->gt;start = timestamp;
fbt::zfs_read:return,
fbt::zfs_write:return
/self->gt;start && (timestamp - self->gt;start) >gt;= min_ns/
this->gt;iotime = (timestamp - self->gt;start) / 1000000;
this->gt;dir = probefunc == "zfs_read" ? "R" : "W";
printf("%-20Y %-16s %1s %4d %6d %s\n", walltimestamp,
execname, this->gt;dir, self->gt;kb, this->gt;iotime,
self->gt;path != NULL ? stringof(self->gt;path) : "gt;");
[...]
• zfsslower.d originated from the DTrace book
Monday, October 1, 12
slide 62:
Slow disks, cont.
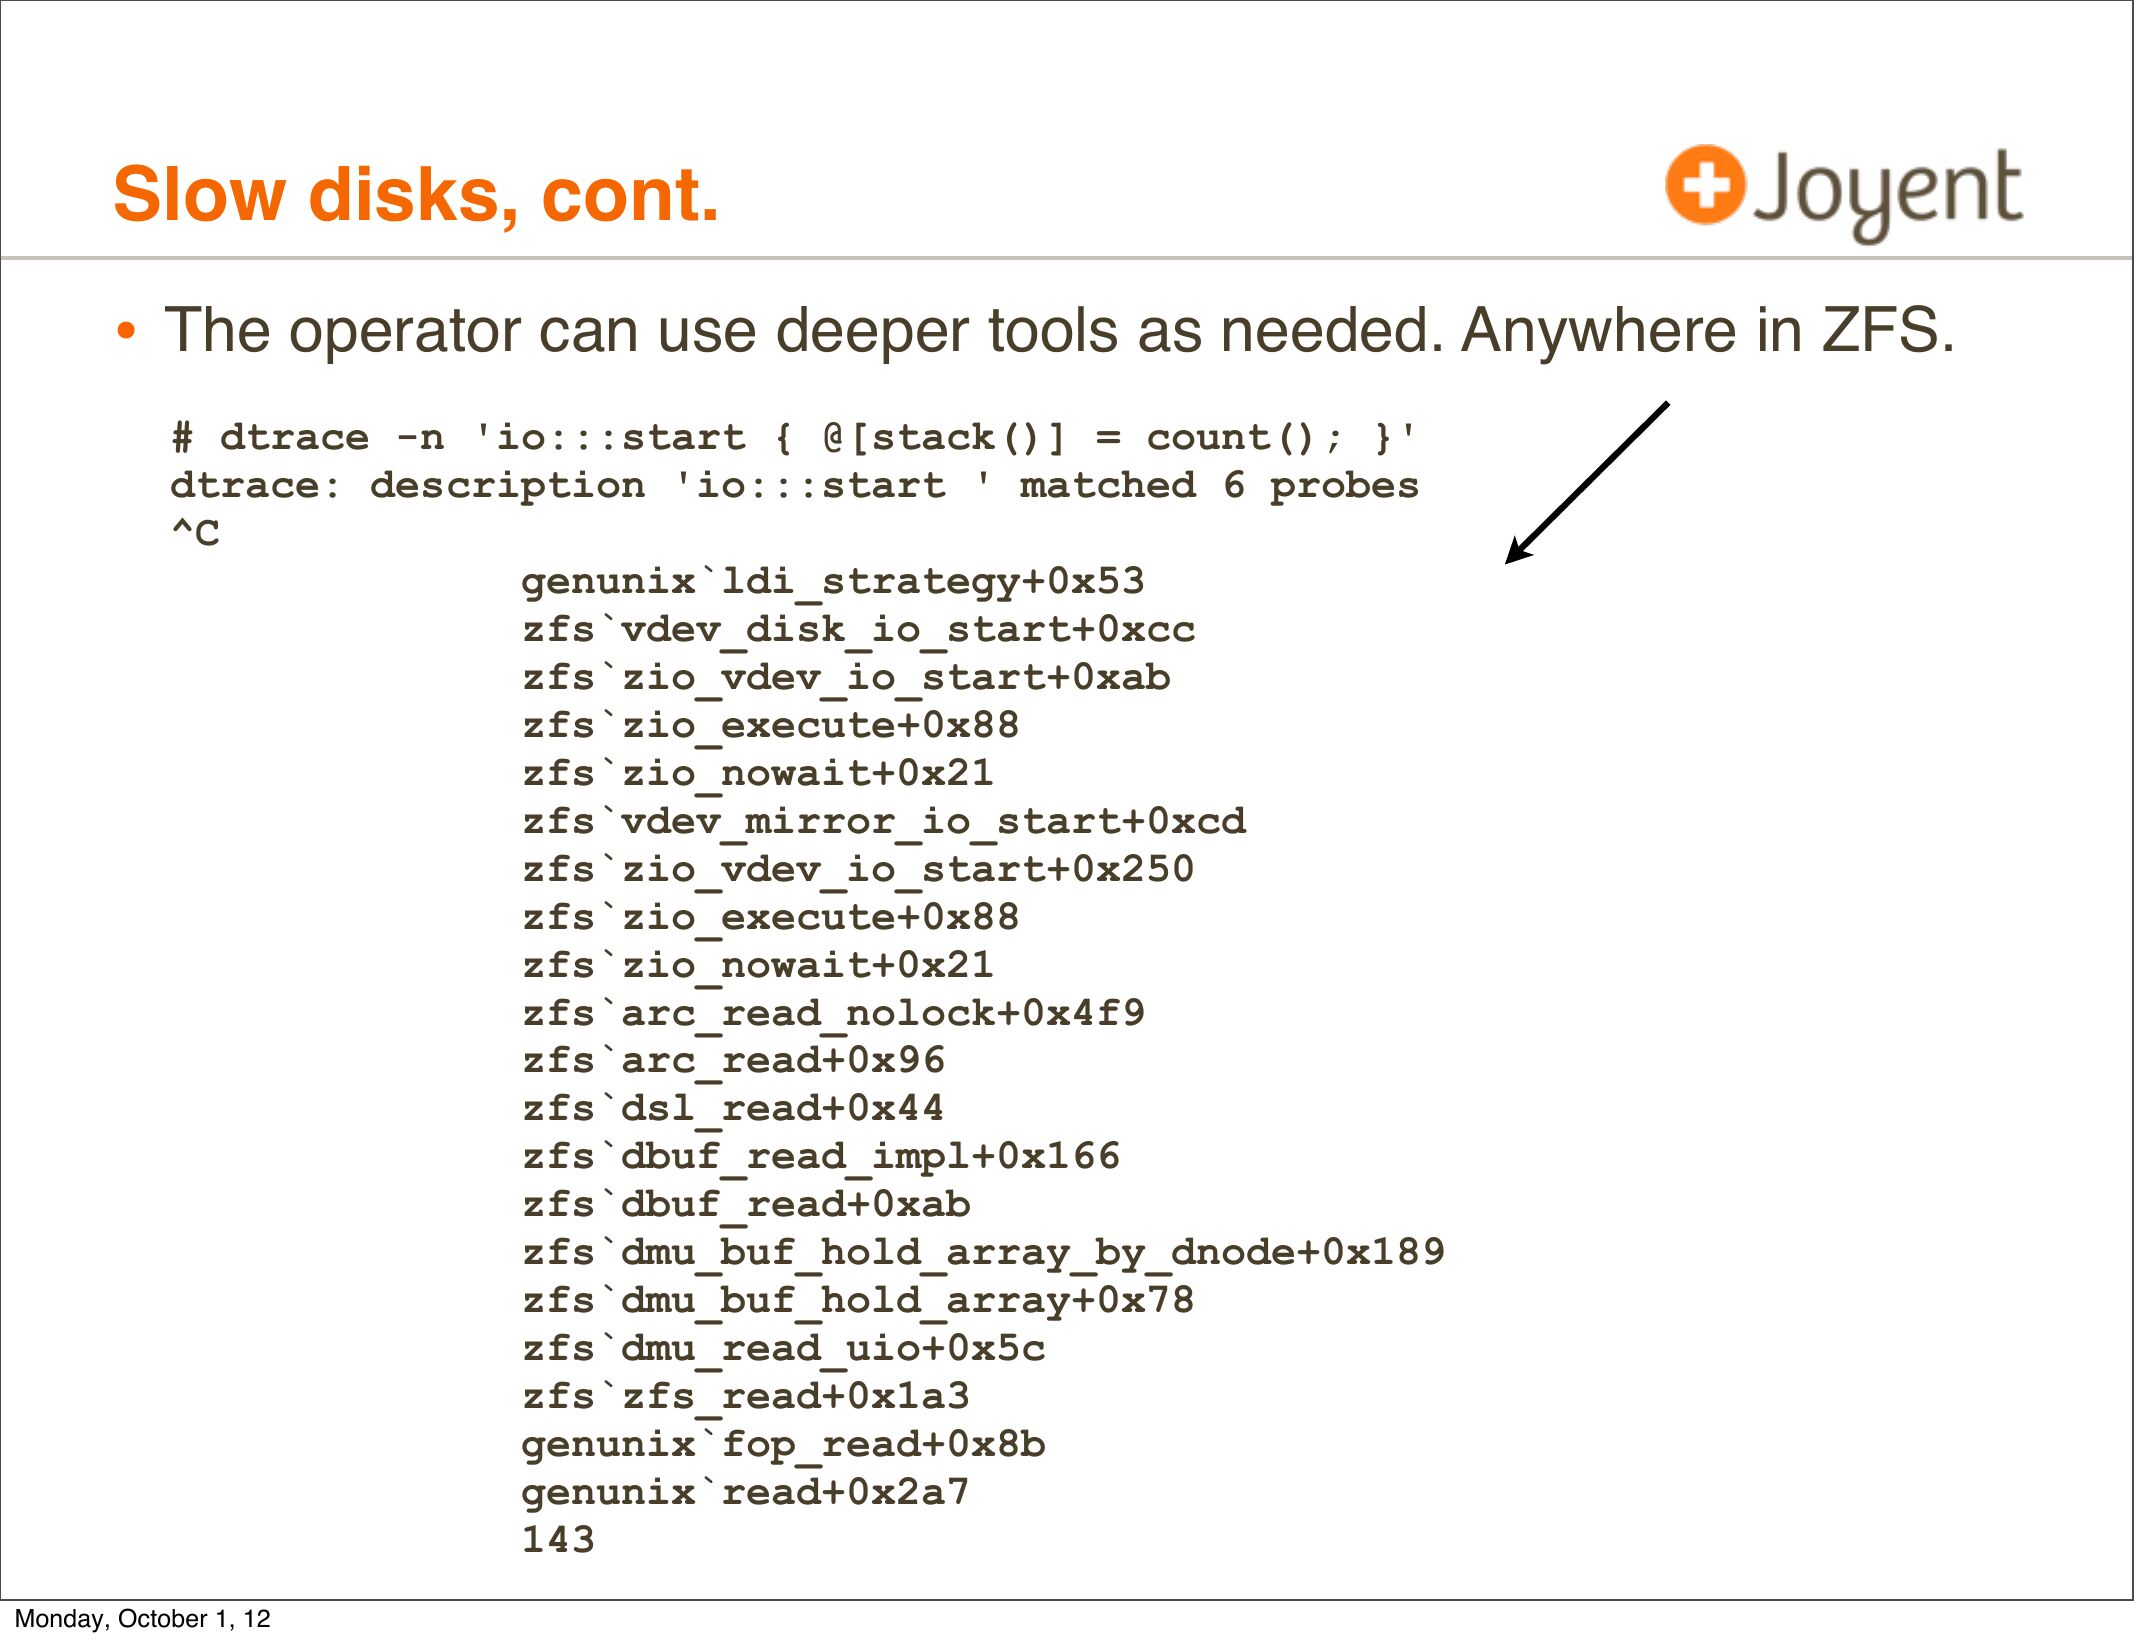
• The operator can use deeper tools as needed. Anywhere in ZFS.
# dtrace -n 'io:::start { @[stack()] = count(); }'
dtrace: description 'io:::start ' matched 6 probes
genunix`ldi_strategy+0x53
zfs`vdev_disk_io_start+0xcc
zfs`zio_vdev_io_start+0xab
zfs`zio_execute+0x88
zfs`zio_nowait+0x21
zfs`vdev_mirror_io_start+0xcd
zfs`zio_vdev_io_start+0x250
zfs`zio_execute+0x88
zfs`zio_nowait+0x21
zfs`arc_read_nolock+0x4f9
zfs`arc_read+0x96
zfs`dsl_read+0x44
zfs`dbuf_read_impl+0x166
zfs`dbuf_read+0xab
zfs`dmu_buf_hold_array_by_dnode+0x189
zfs`dmu_buf_hold_array+0x78
zfs`dmu_read_uio+0x5c
zfs`zfs_read+0x1a3
genunix`fop_read+0x8b
genunix`read+0x2a7
Monday, October 1, 12
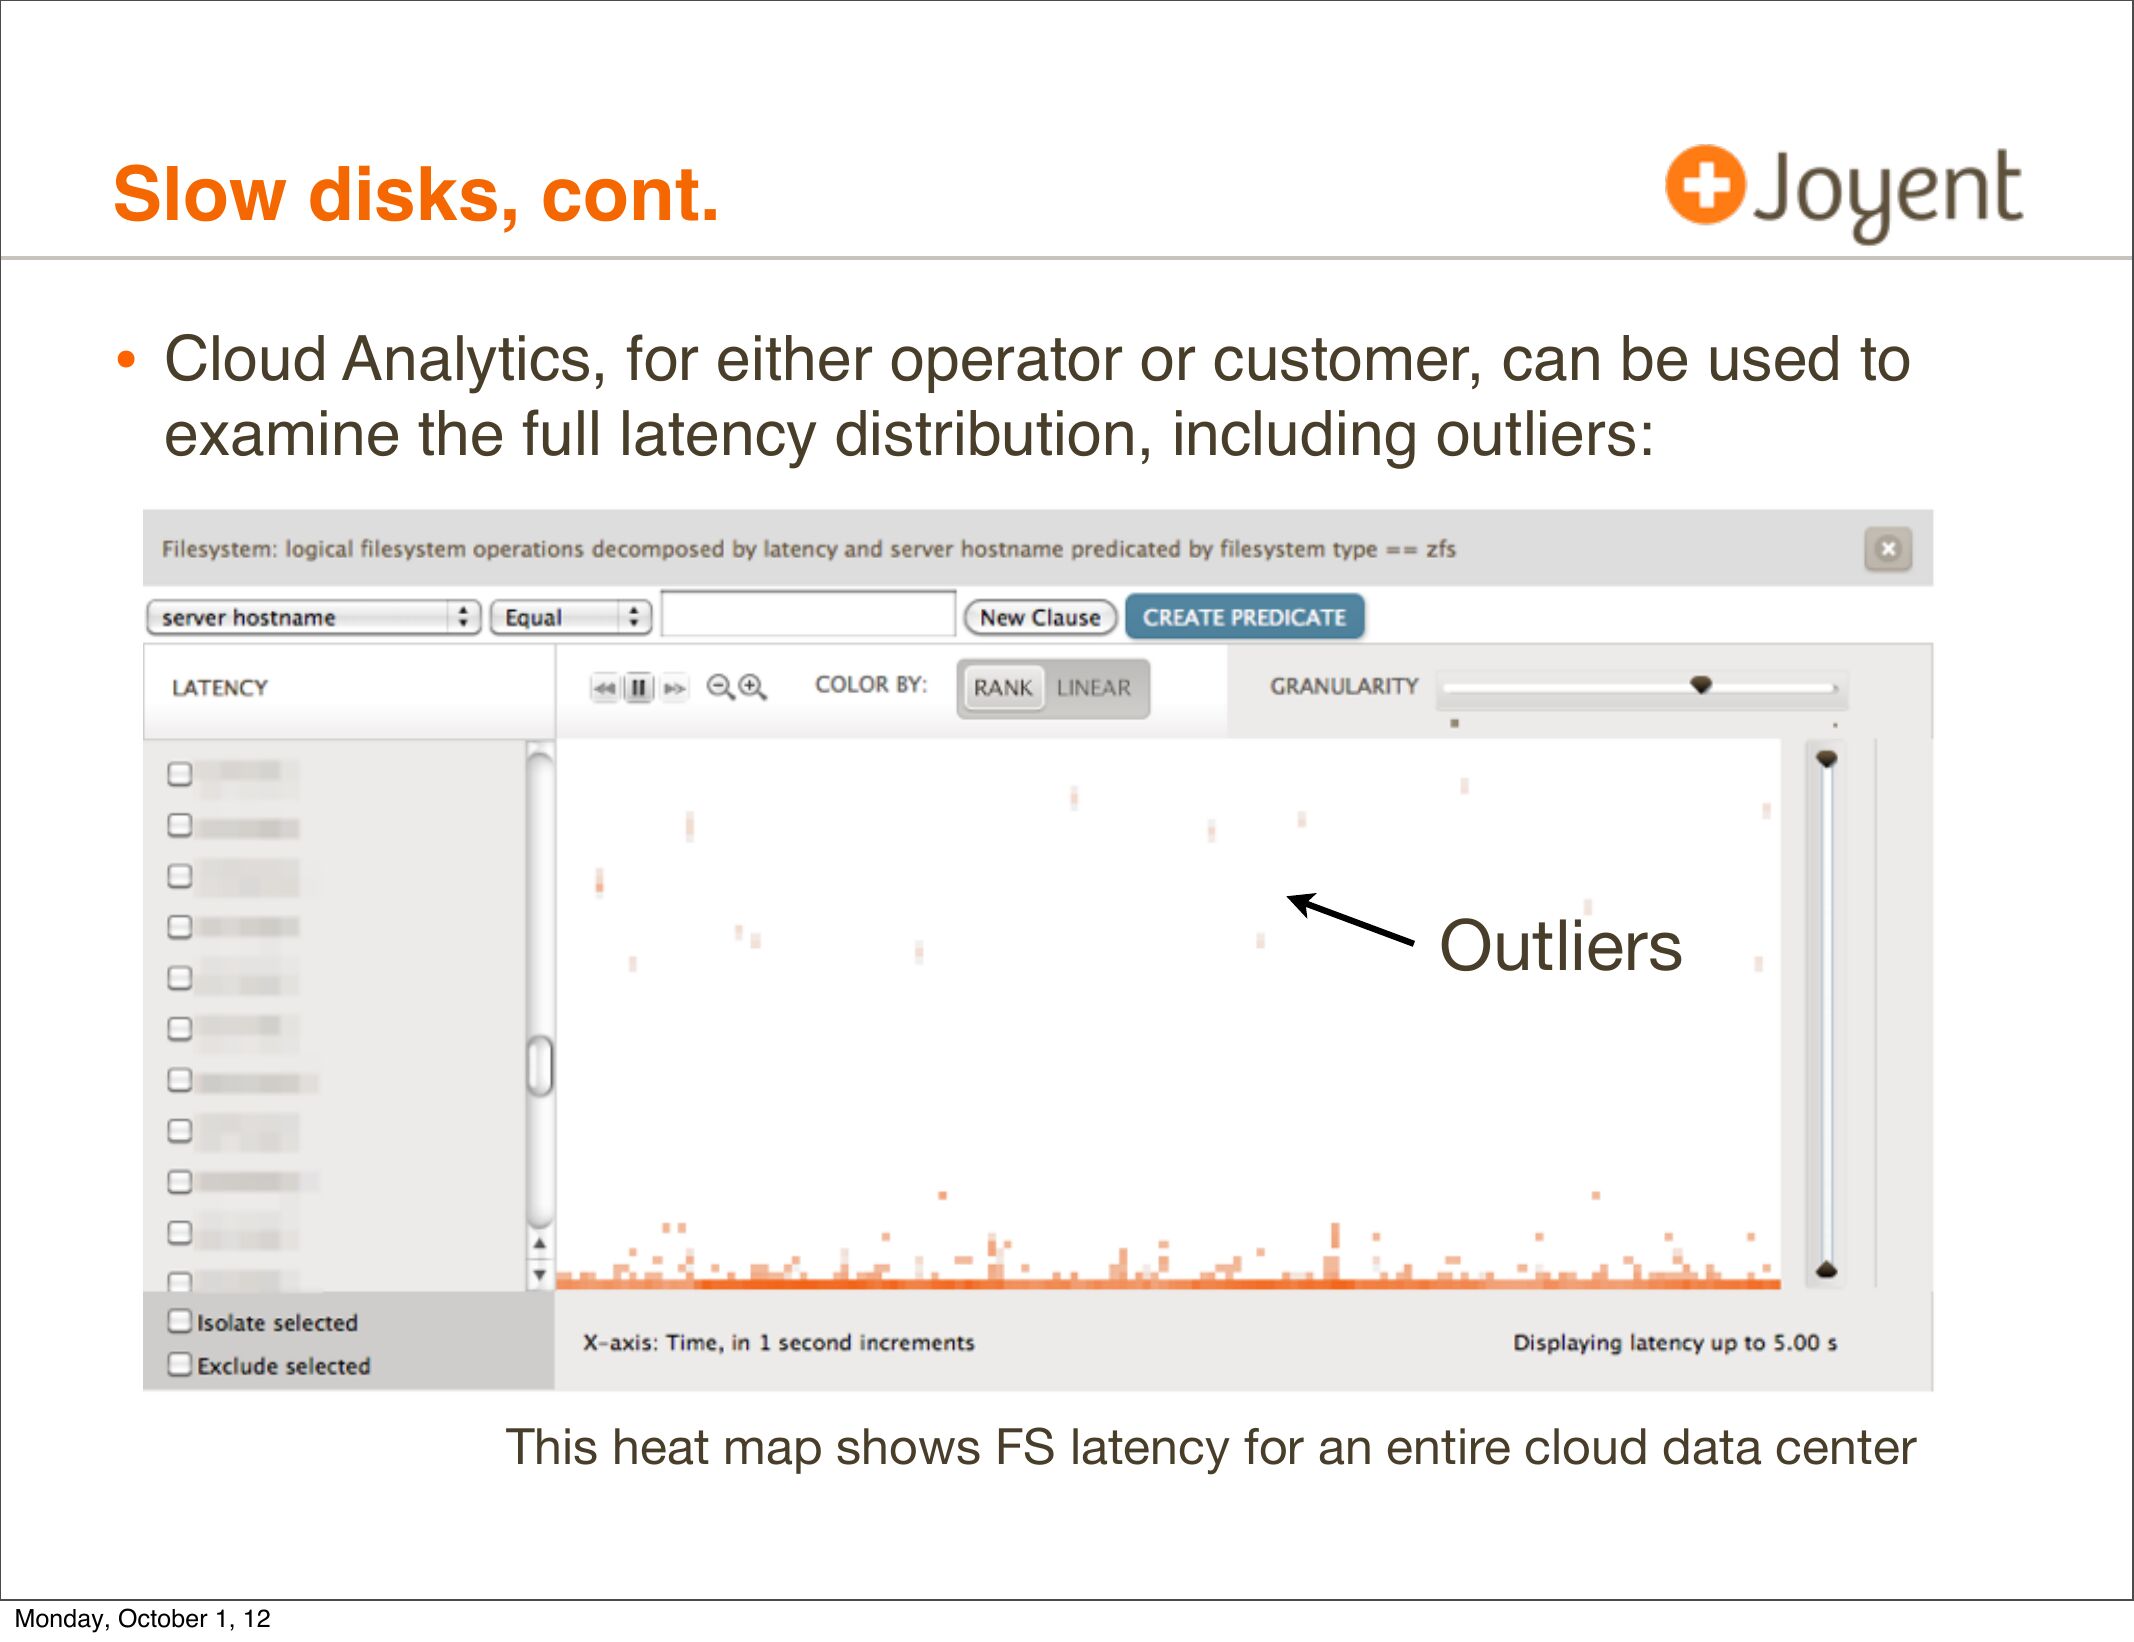
slide 63:Slow disks, cont. • Cloud Analytics, for either operator or customer, can be used to examine the full latency distribution, including outliers: Outliers This heat map shows FS latency for an entire cloud data center Monday, October 1, 12slide 64:
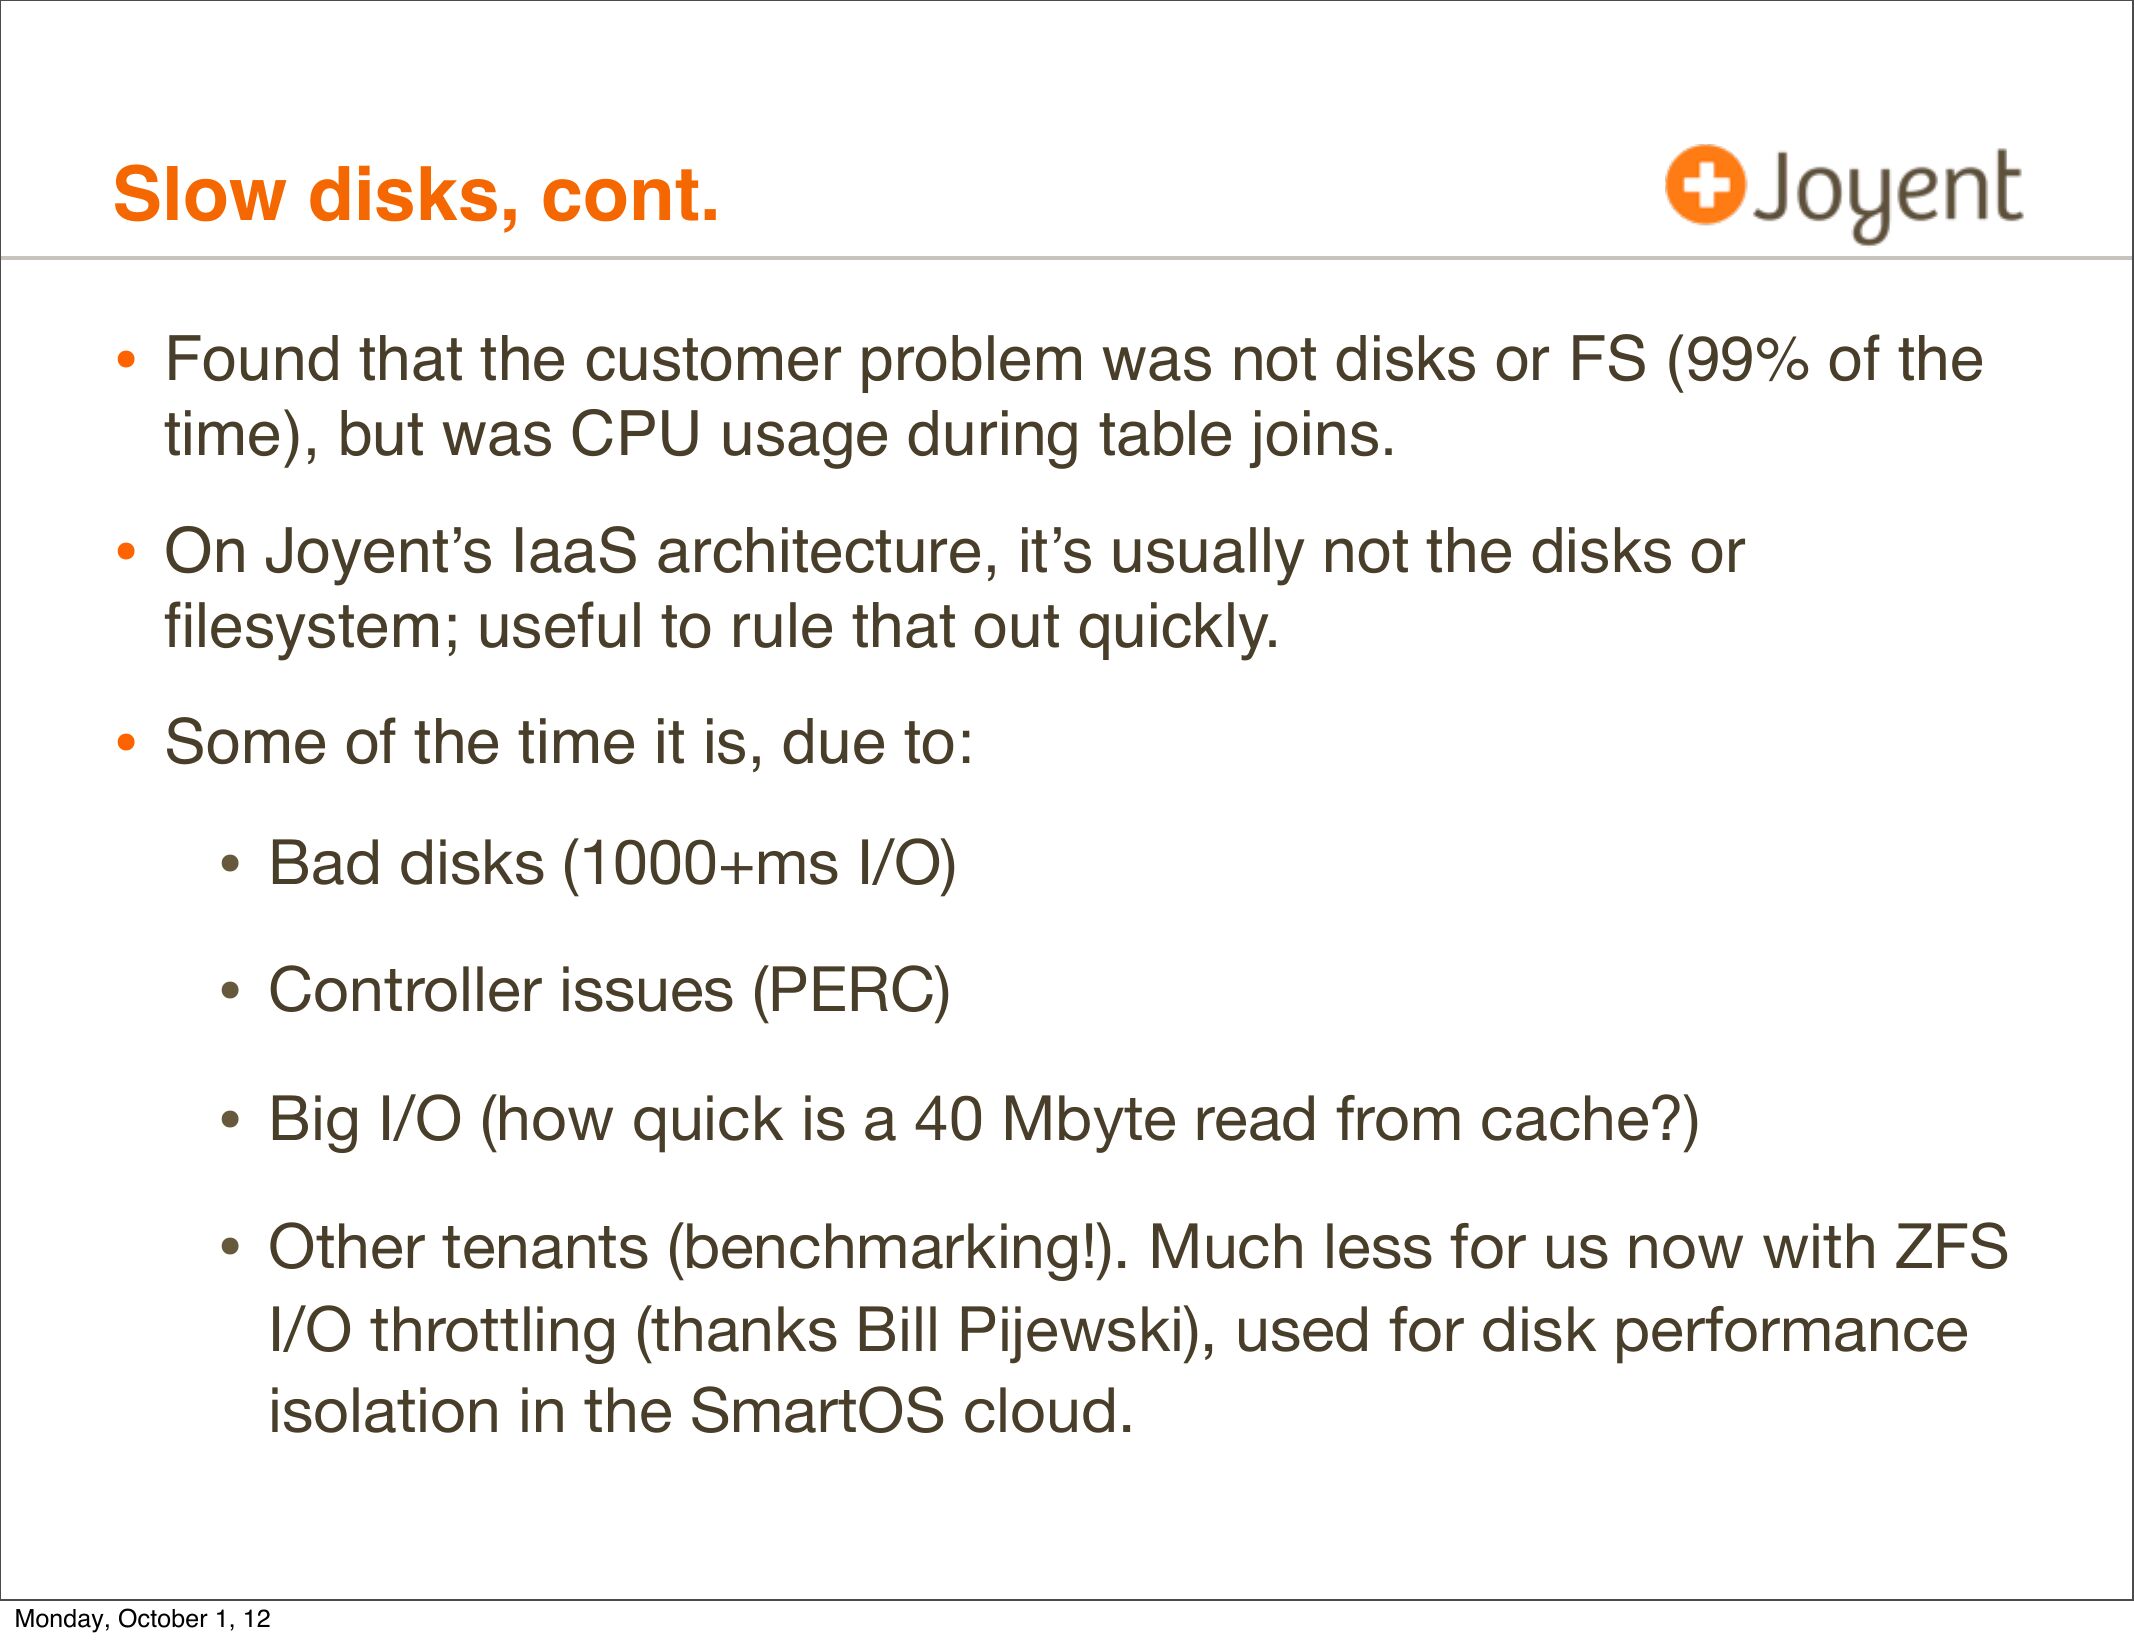
Slow disks, cont.
• Found that the customer problem was not disks or FS (99% of the
time), but was CPU usage during table joins.
• On Joyent’s IaaS architecture, it’s usually not the disks or
filesystem; useful to rule that out quickly.
• Some of the time it is, due to:
• Bad disks (1000+ms I/O)
• Controller issues (PERC)
• Big I/O (how quick is a 40 Mbyte read from cache?)
• Other tenants (benchmarking!). Much less for us now with ZFS
I/O throttling (thanks Bill Pijewski), used for disk performance
isolation in the SmartOS cloud.
Monday, October 1, 12
slide 65:
Slow disks, cont.
• Customer resolved real issue
• Prior to DTrace analysis, had spent months of poor performance
believing disks were to blame
Monday, October 1, 12
slide 66:
Kernel scheduler
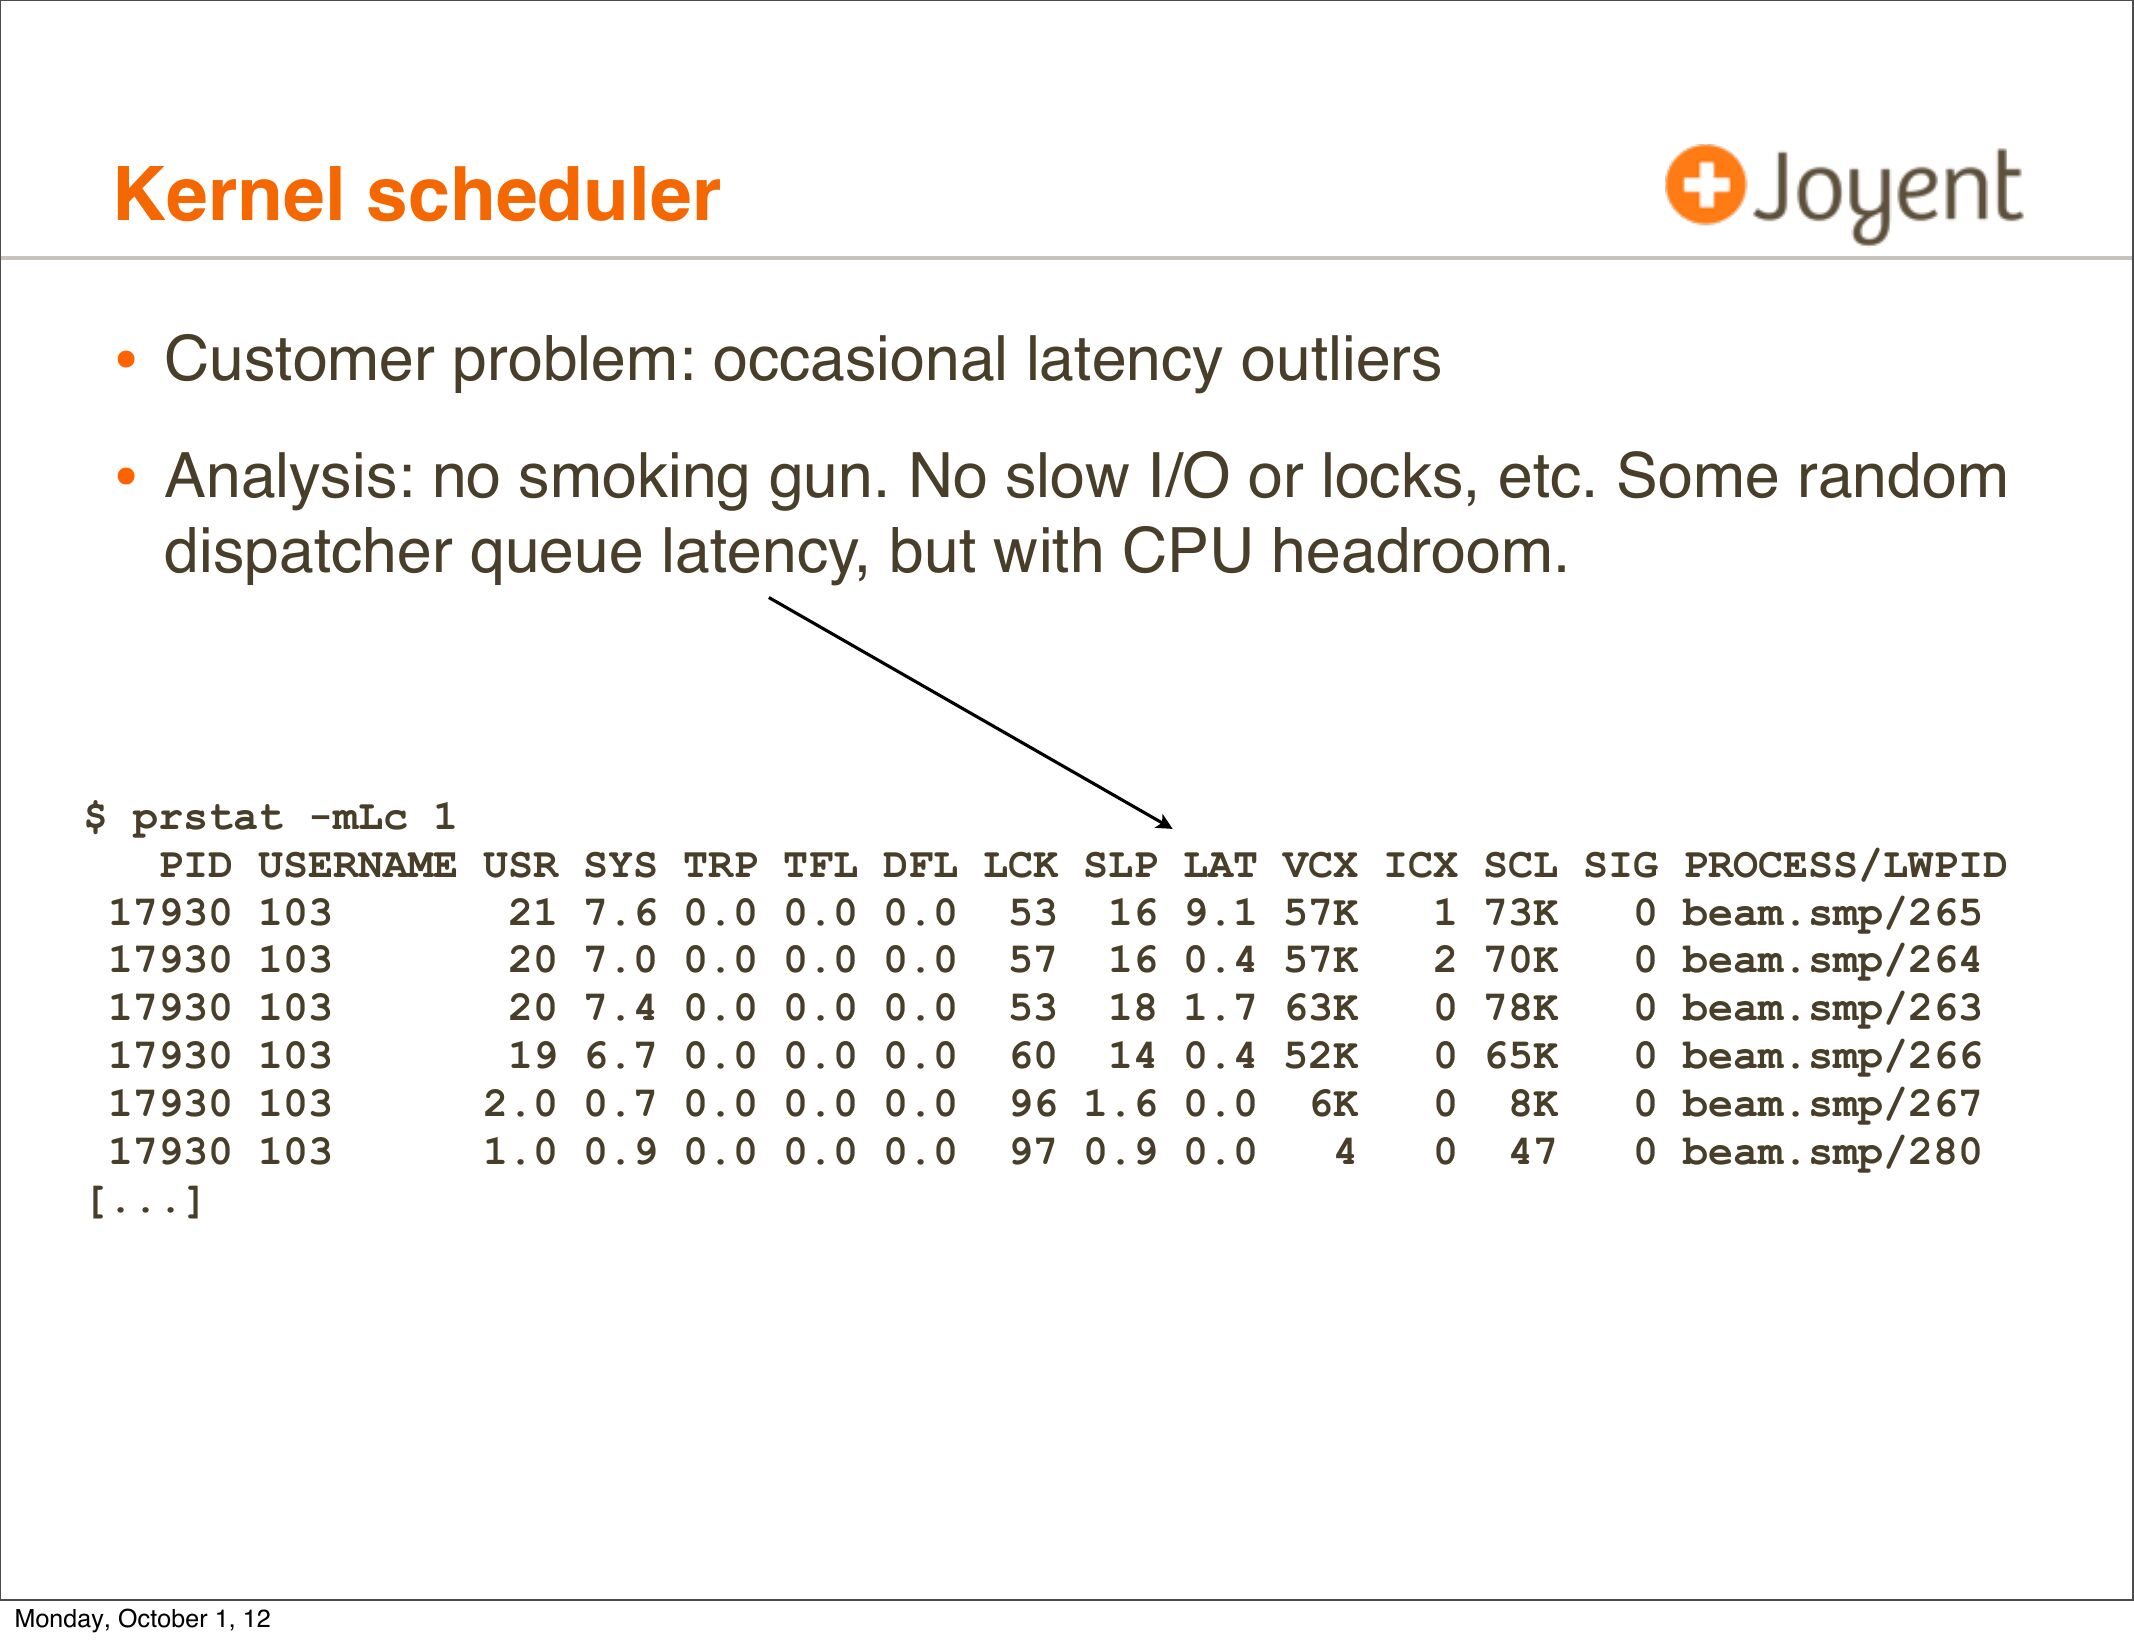
• Customer problem: occasional latency outliers
• Analysis: no smoking gun. No slow I/O or locks, etc. Some random
dispatcher queue latency, but with CPU headroom.
$ prstat -mLc 1
PID USERNAME USR SYS TRP TFL DFL LCK SLP LAT VCX ICX SCL SIG PROCESS/LWPID
17930 103
21 7.6 0.0 0.0 0.0 53 16 9.1 57K
1 73K
0 beam.smp/265
17930 103
20 7.0 0.0 0.0 0.0 57 16 0.4 57K
2 70K
0 beam.smp/264
17930 103
20 7.4 0.0 0.0 0.0 53 18 1.7 63K
0 78K
0 beam.smp/263
17930 103
19 6.7 0.0 0.0 0.0 60 14 0.4 52K
0 65K
0 beam.smp/266
17930 103
2.0 0.7 0.0 0.0 0.0 96 1.6 0.0 6K
0 8K
0 beam.smp/267
17930 103
1.0 0.9 0.0 0.0 0.0 97 0.9 0.0
0 47
0 beam.smp/280
[...]
Monday, October 1, 12
slide 67:
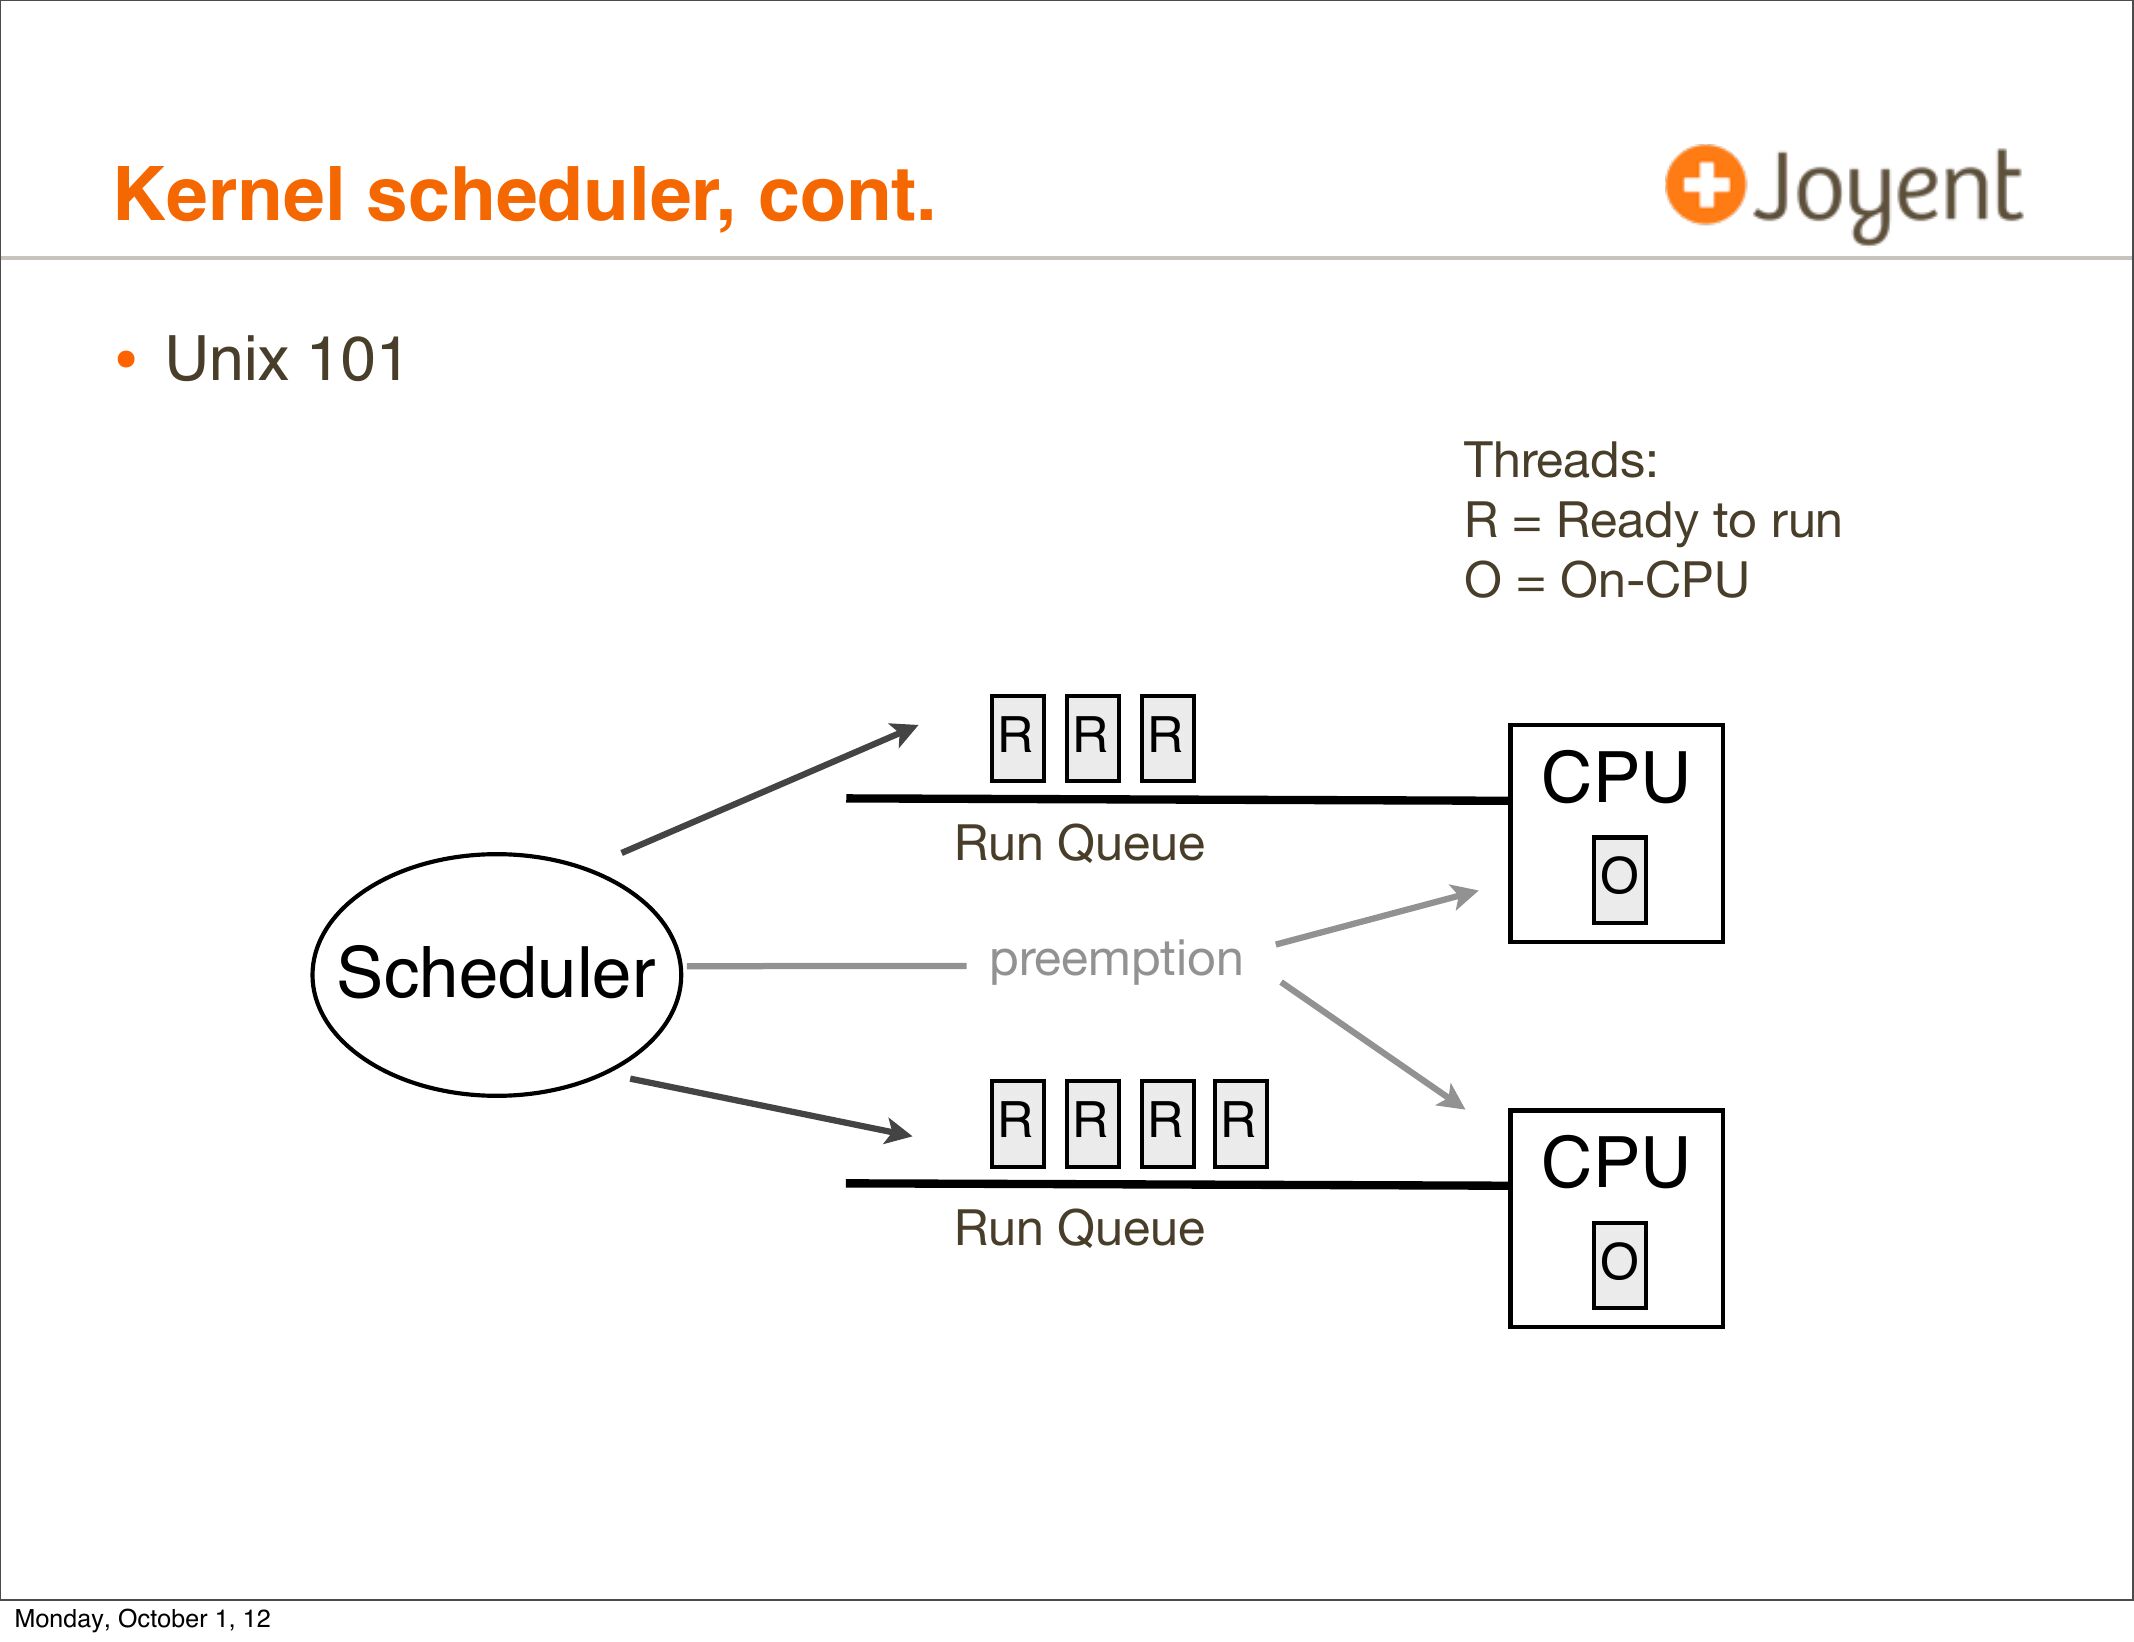
Kernel scheduler, cont.
• Unix 101
Threads:
R = Ready to run
O = On-CPU
R R R
Run Queue
Scheduler
preemption
R R R R
Run Queue
Monday, October 1, 12
CPU
CPU
slide 68:
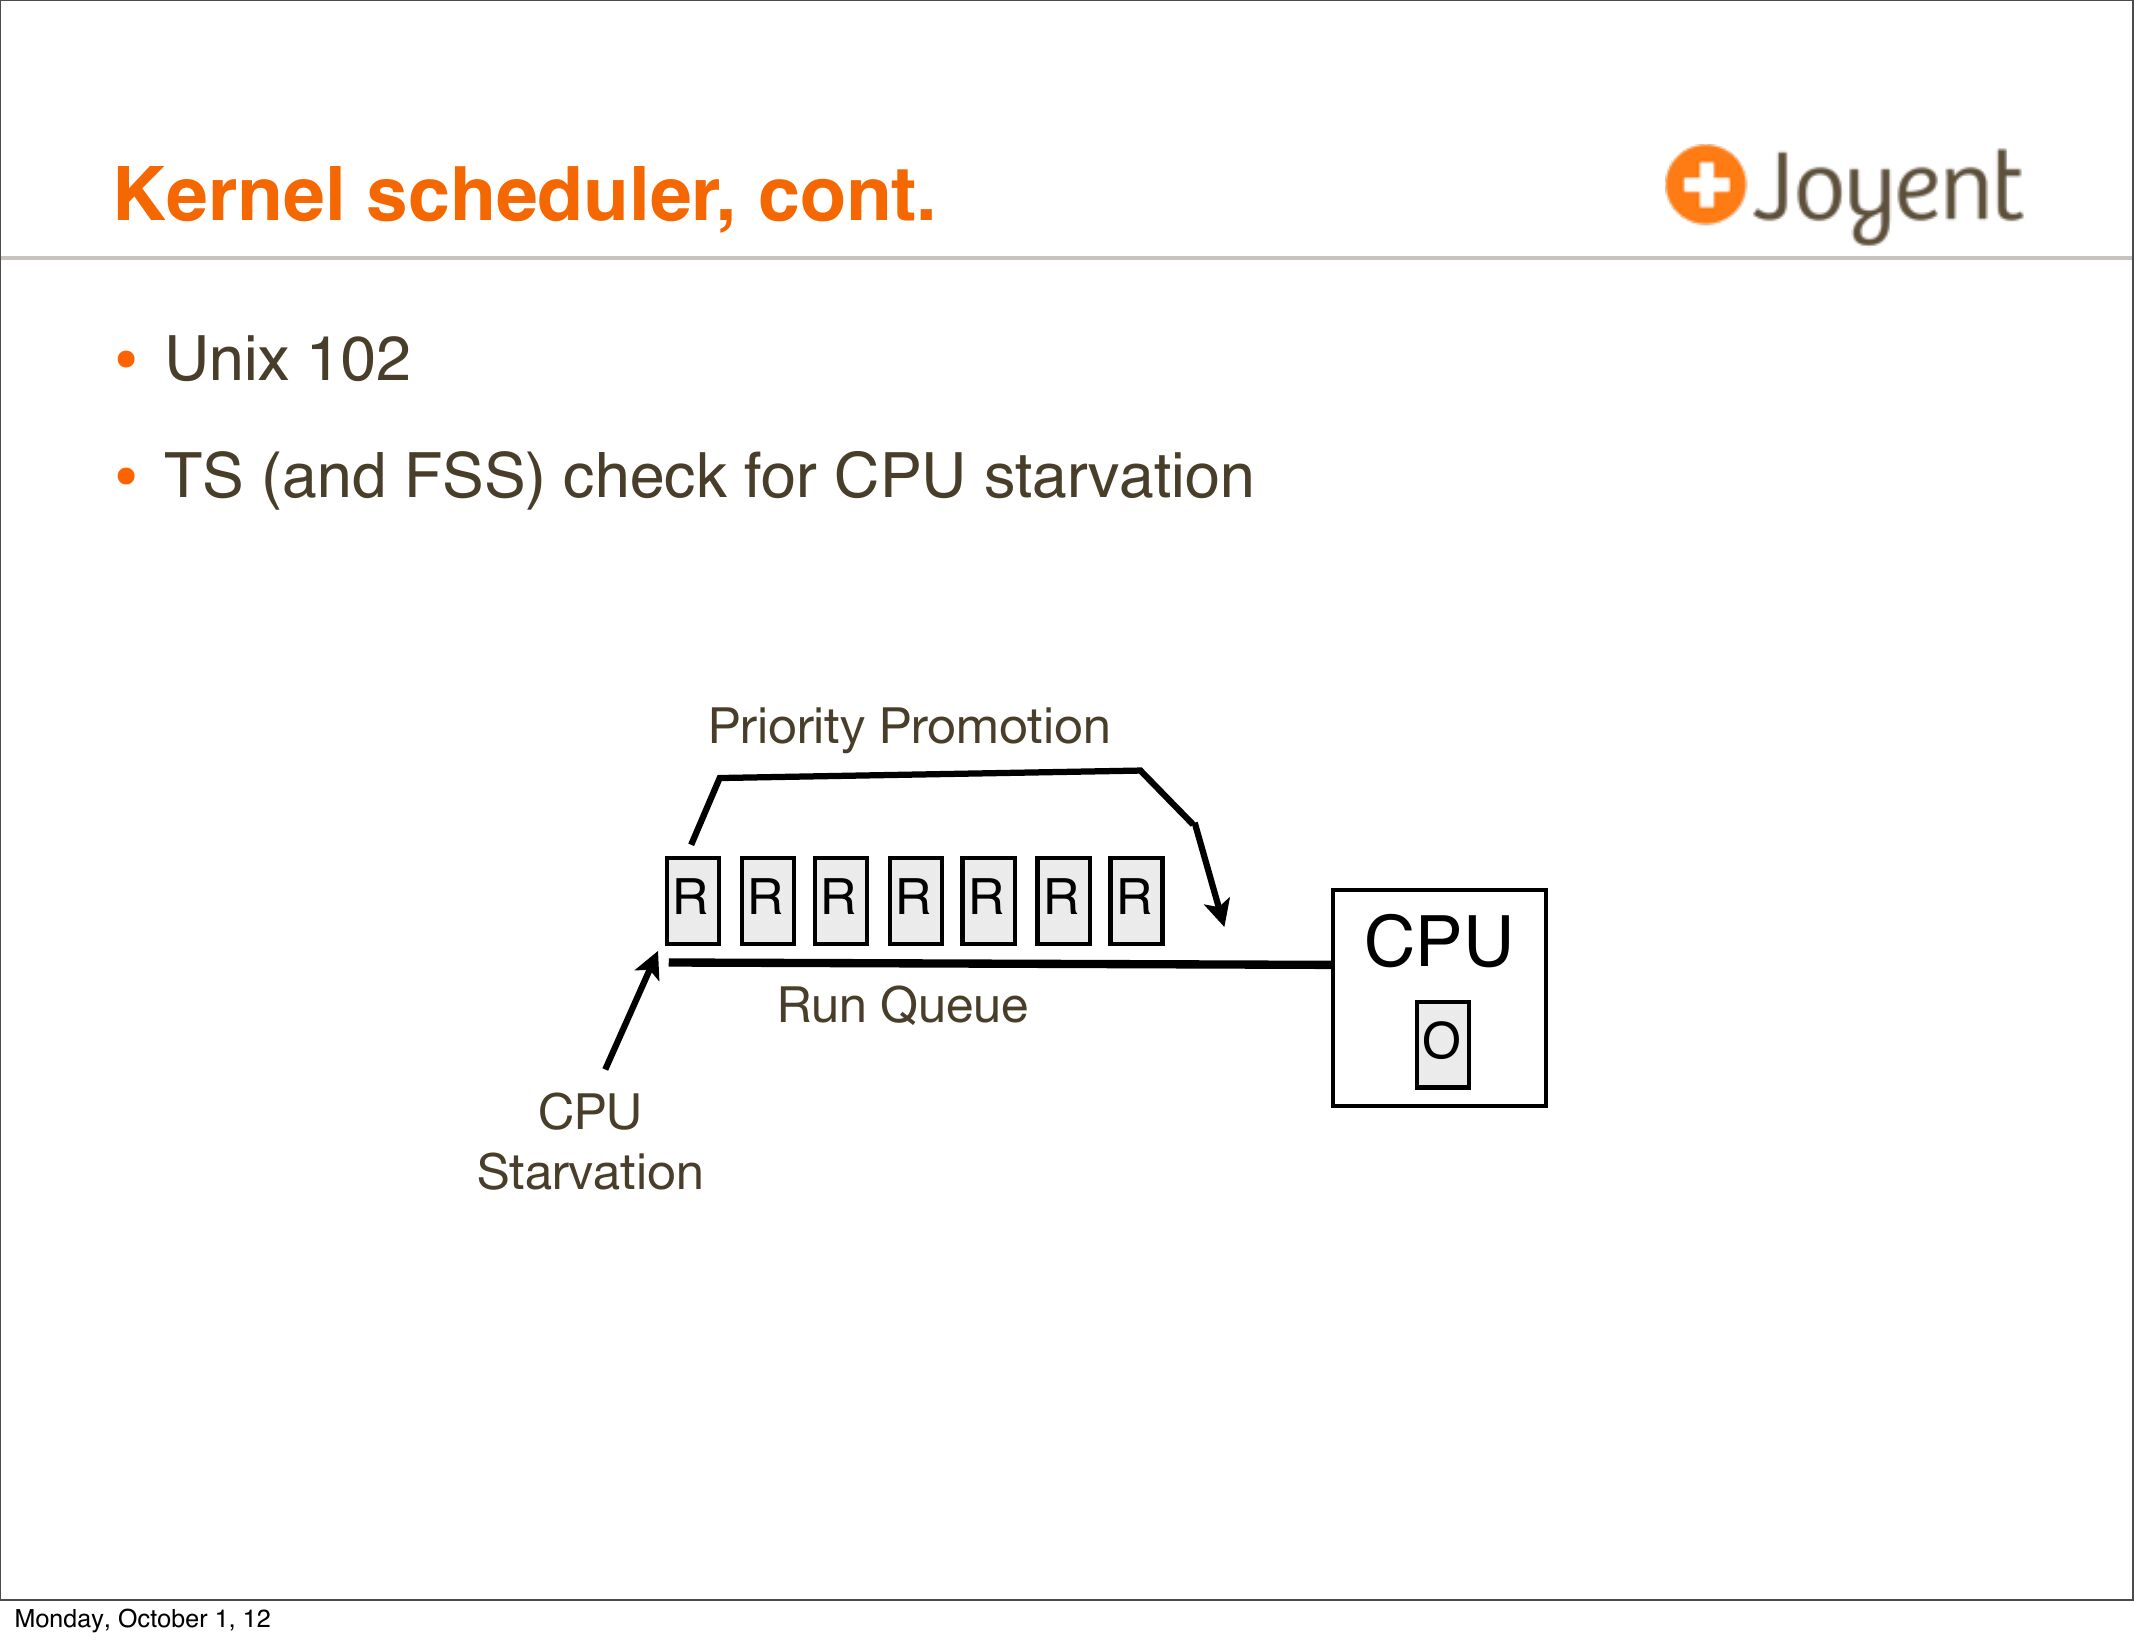
Kernel scheduler, cont.
• Unix 102
• TS (and FSS) check for CPU starvation
Priority Promotion
R R R R R R R
Run Queue
CPU
Starvation
Monday, October 1, 12
CPU
slide 69:
Kernel scheduler, cont.
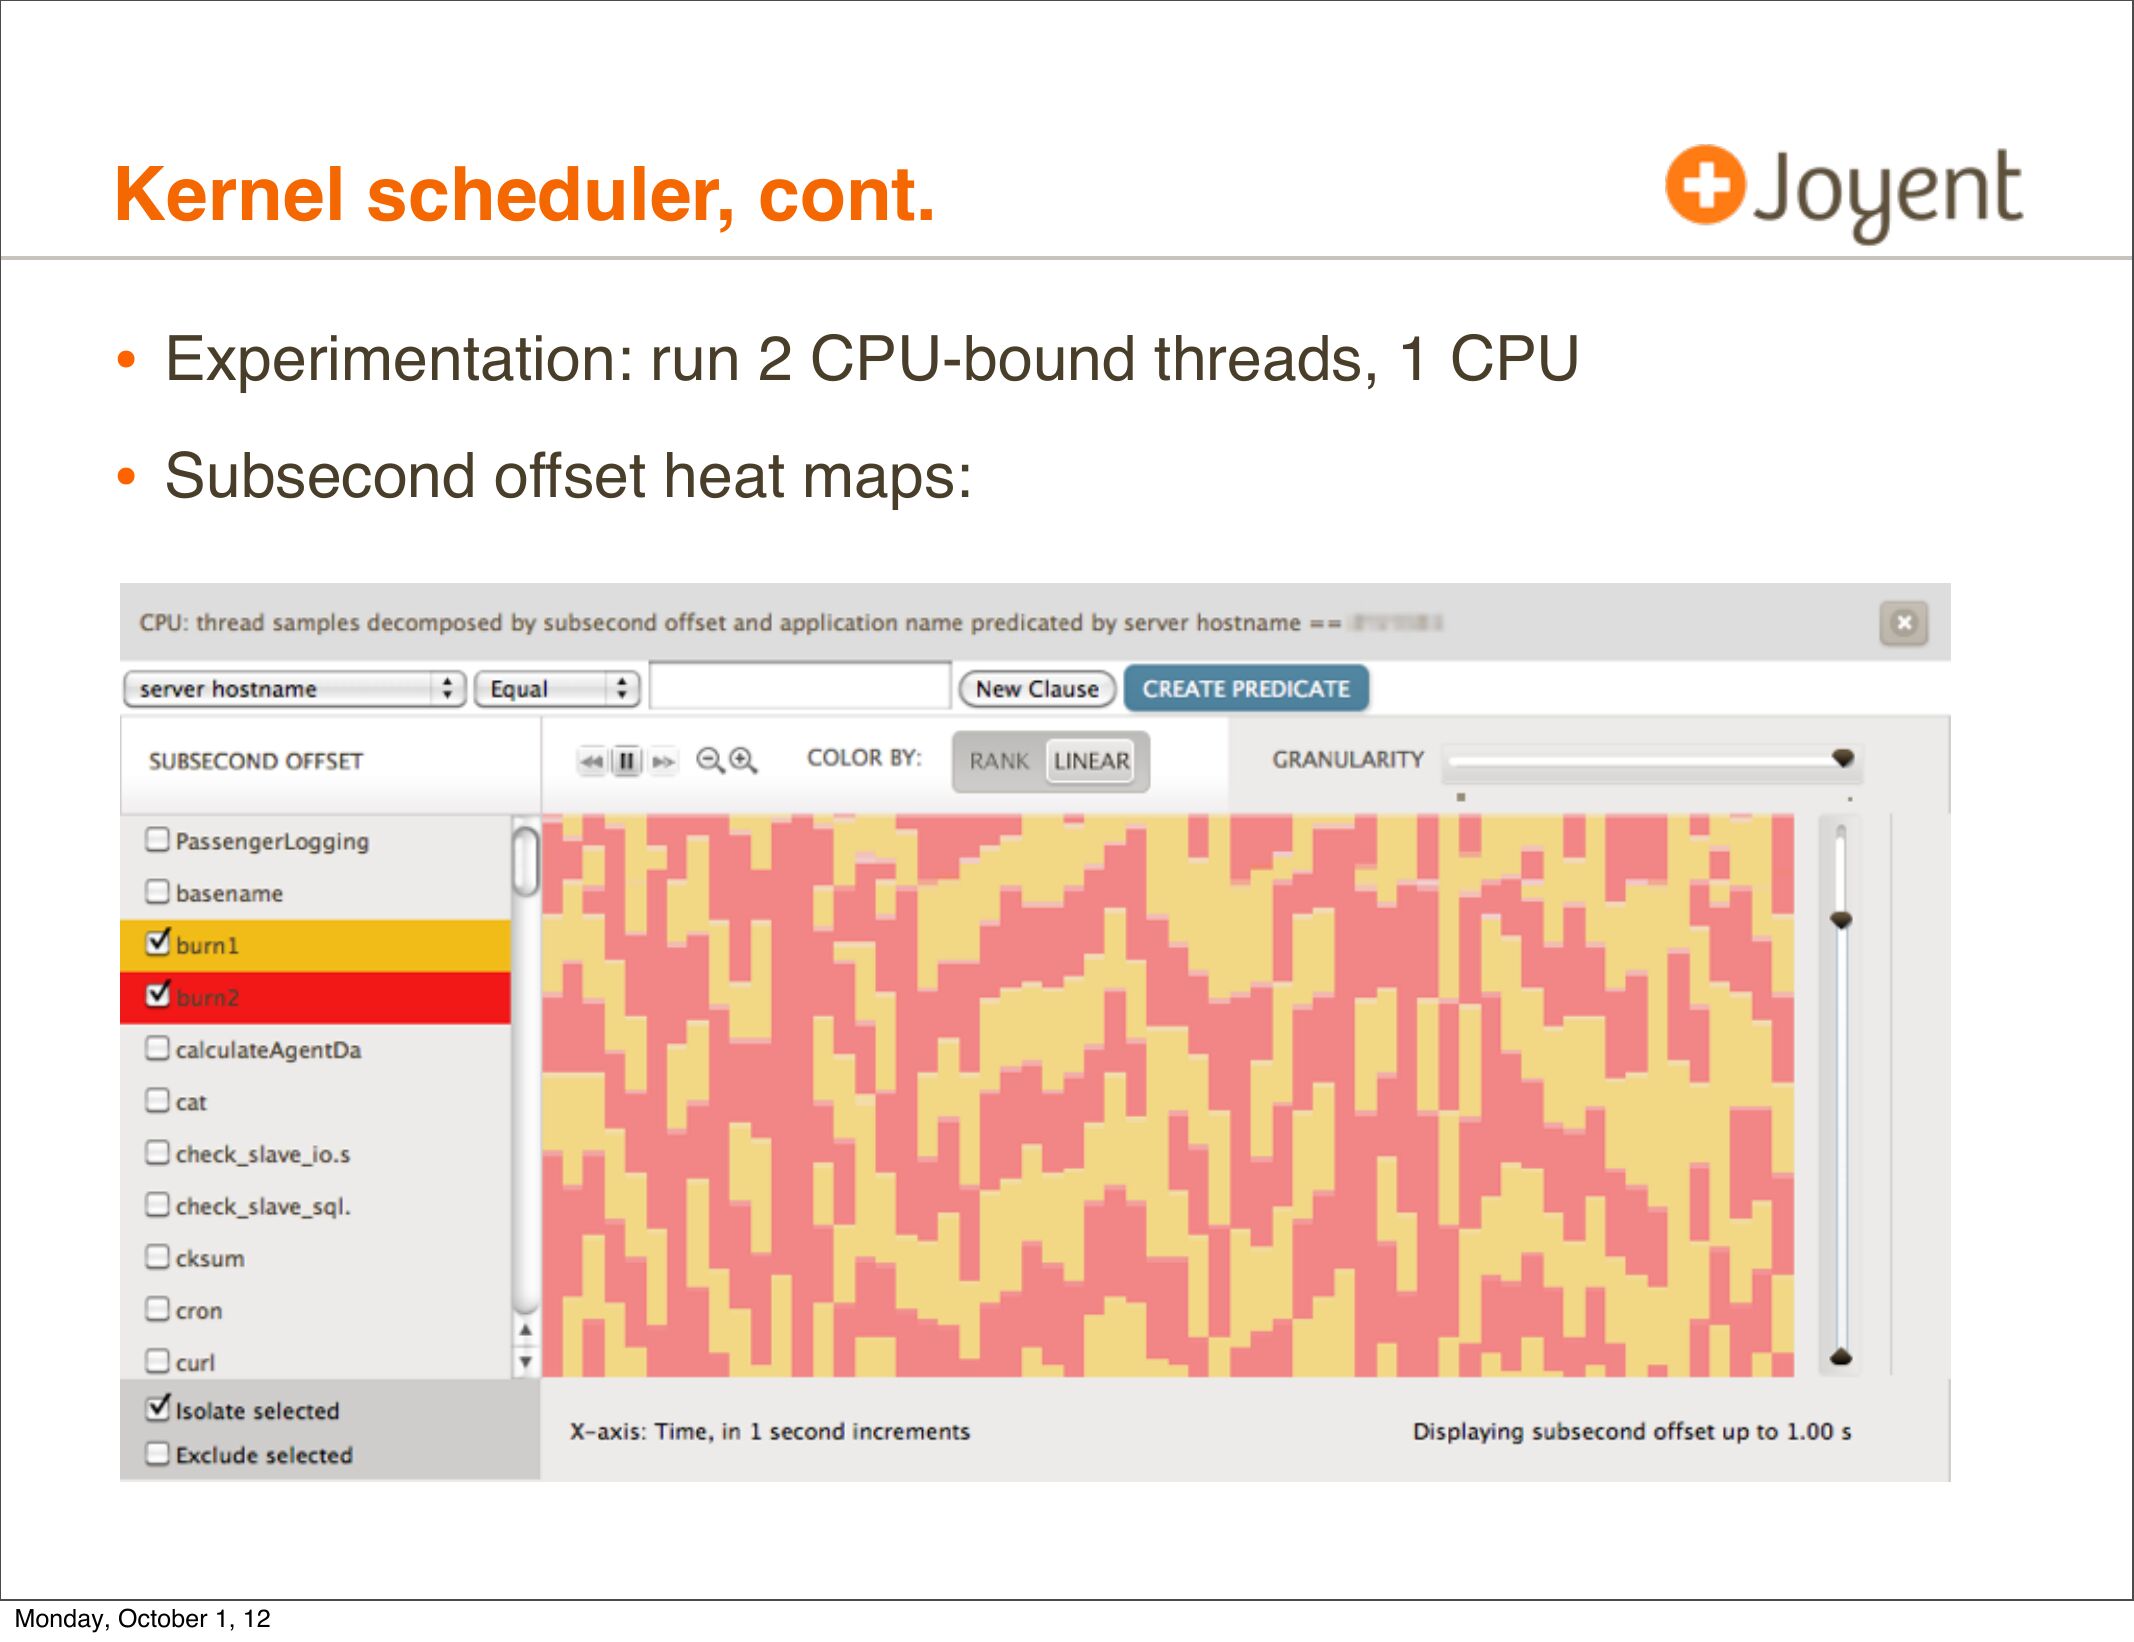
• Experimentation: run 2 CPU-bound threads, 1 CPU
• Subsecond offset heat maps:
Monday, October 1, 12
slide 70:
Kernel scheduler, cont.
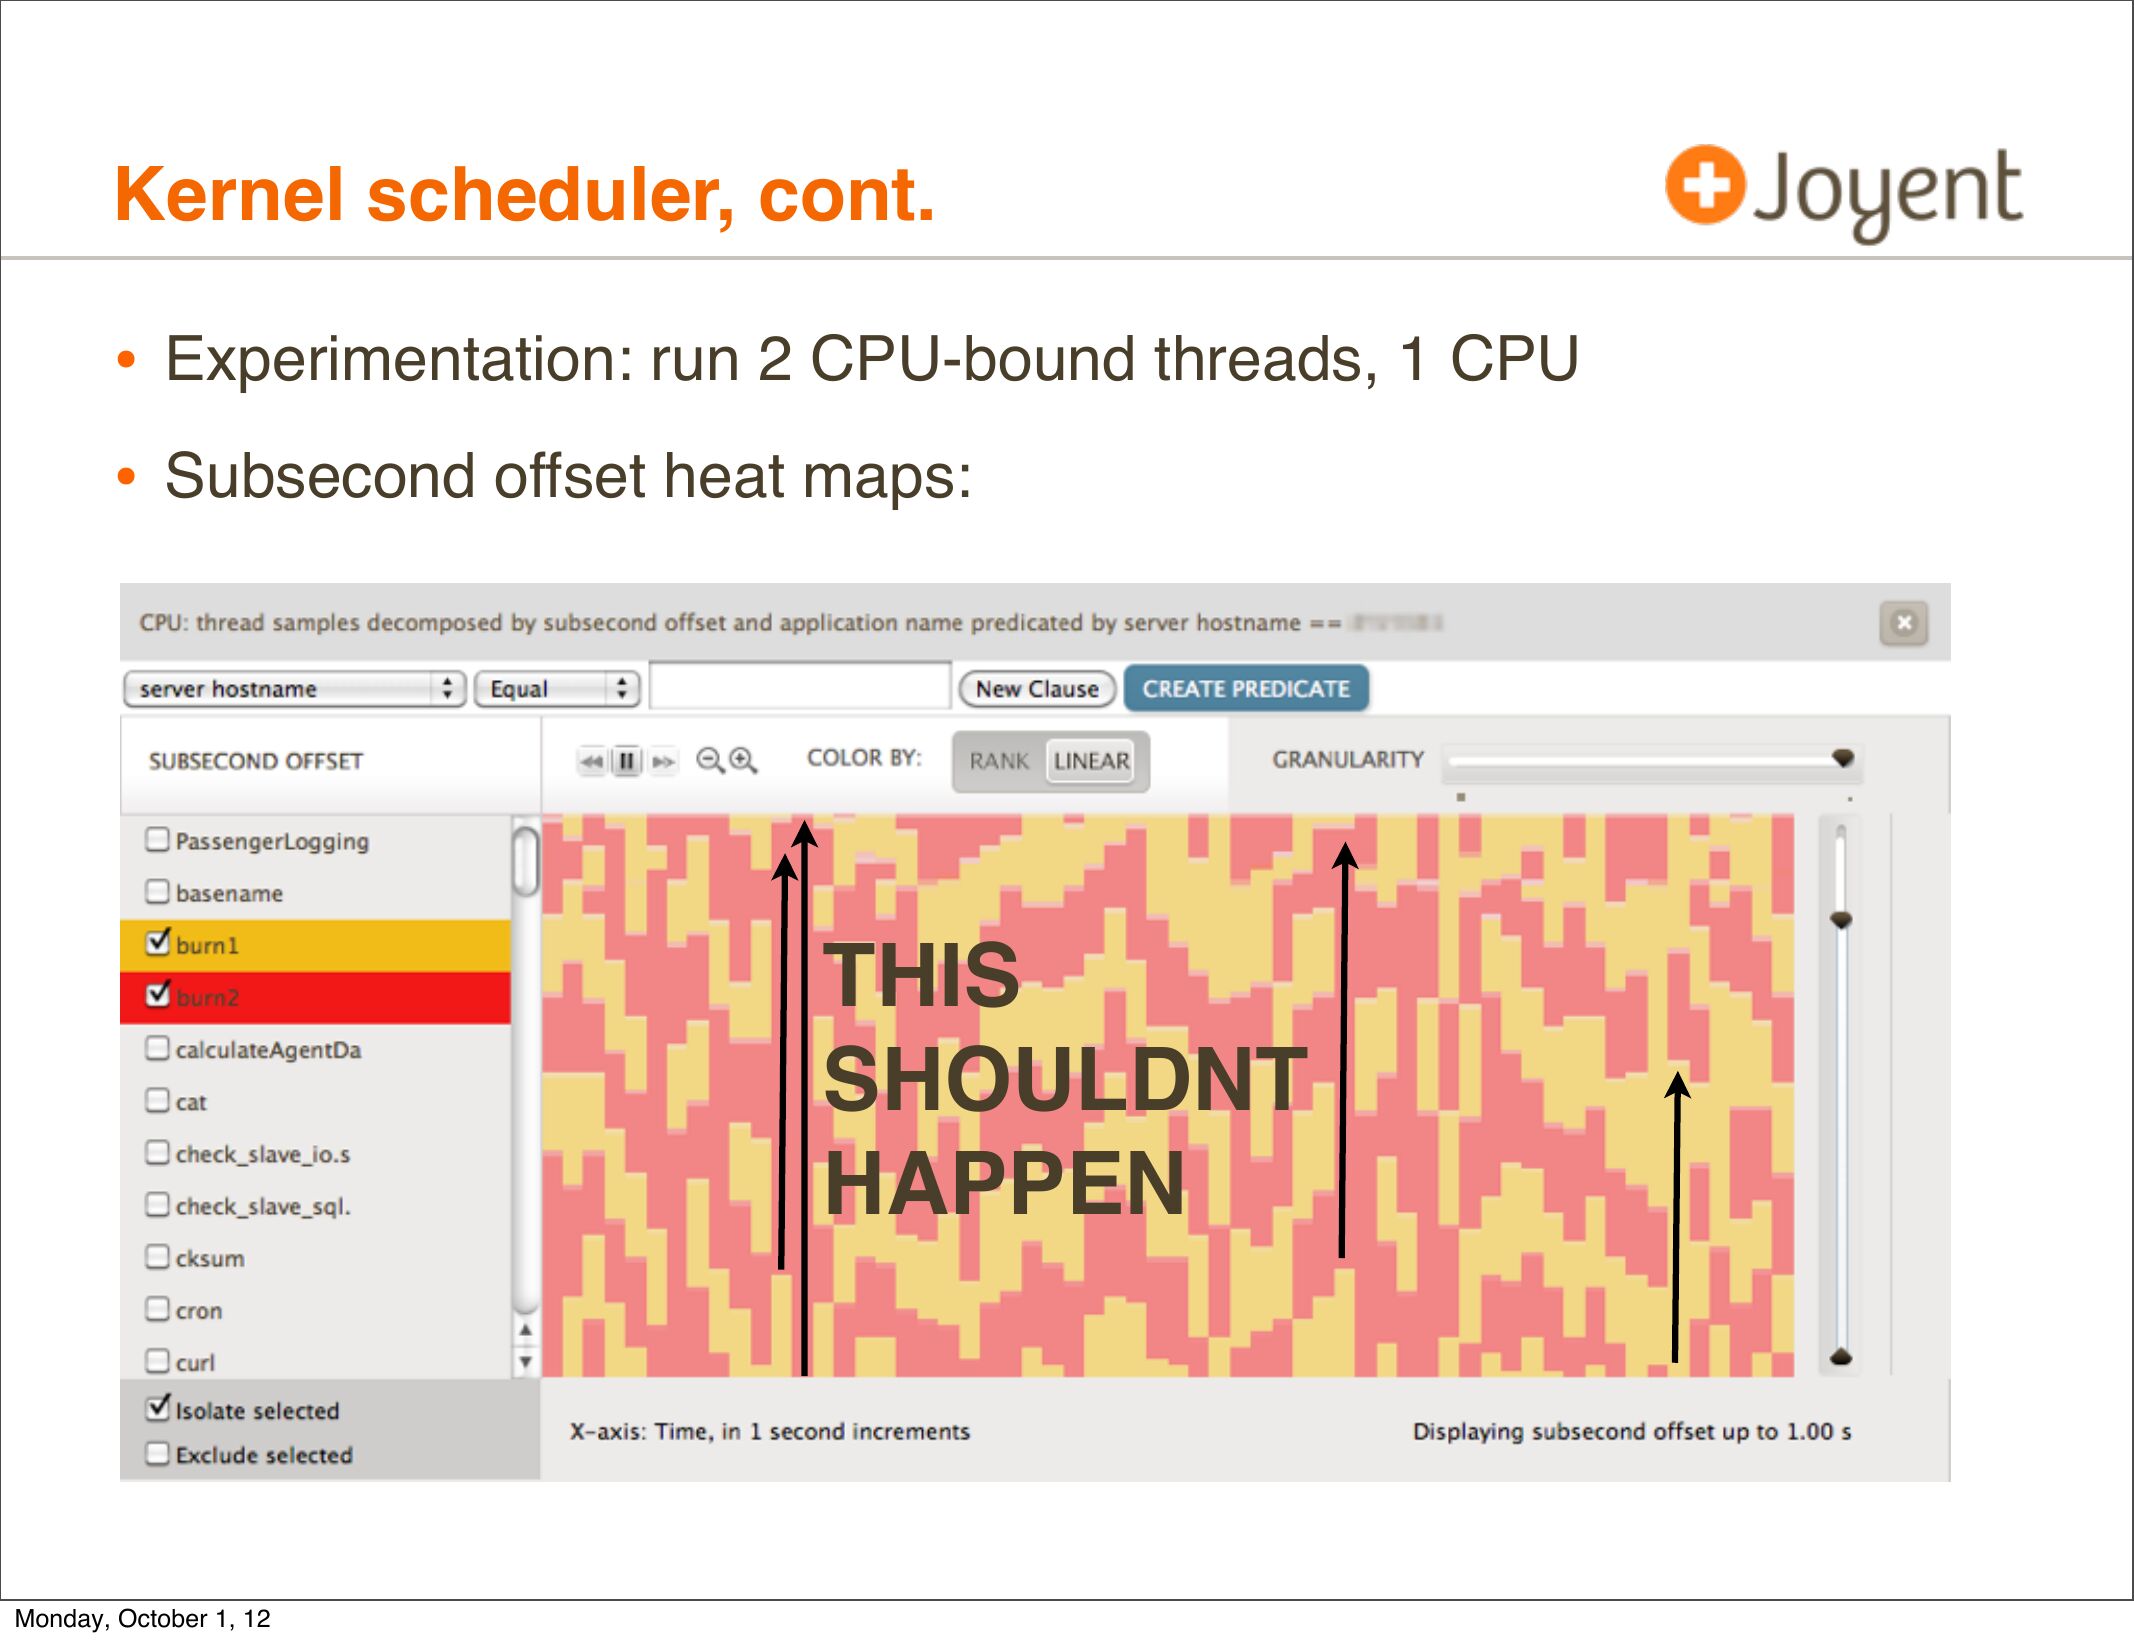
• Experimentation: run 2 CPU-bound threads, 1 CPU
• Subsecond offset heat maps:
THIS
SHOULDNT
HAPPEN
Monday, October 1, 12
slide 71:
Kernel scheduler, cont.
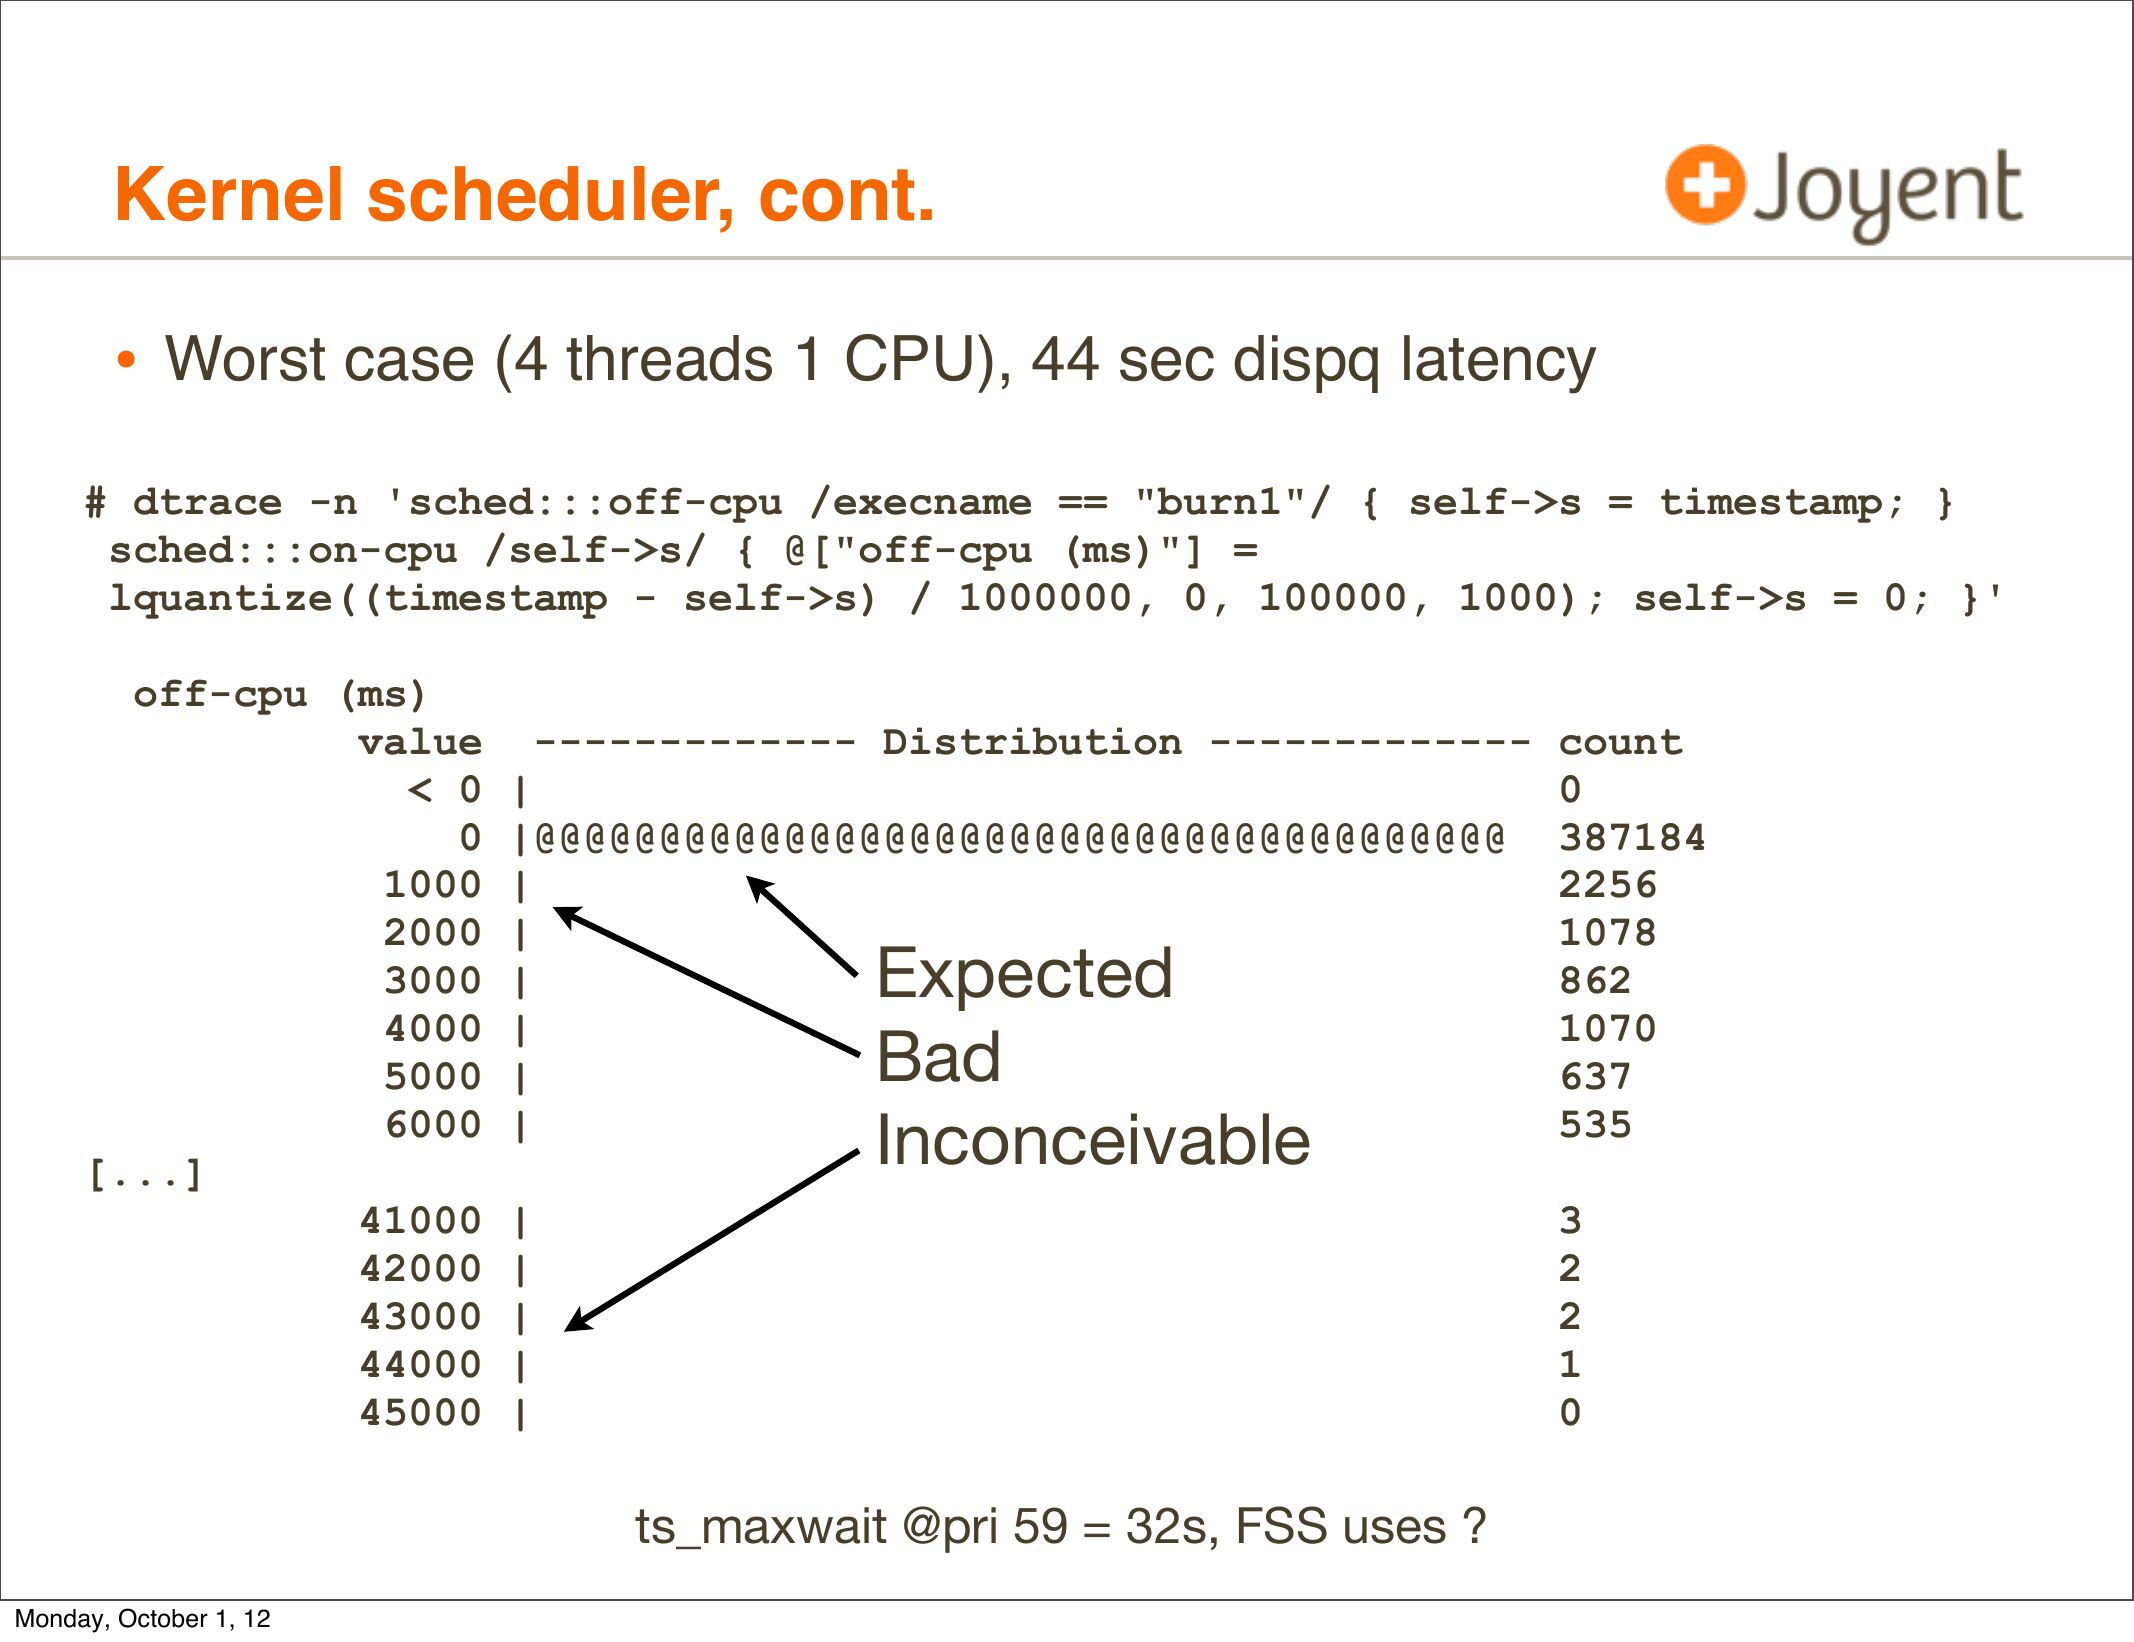
• Worst case (4 threads 1 CPU), 44 sec dispq latency
# dtrace -n 'sched:::off-cpu /execname == "burn1"/ { self->gt;s = timestamp; }
sched:::on-cpu /self->gt;s/ { @["off-cpu (ms)"] =
lquantize((timestamp - self->gt;s) / 1000000, 0, 100000, 1000); self->gt;s = 0; }'
off-cpu (ms)
value ------------- Distribution ------------- count

slide 72:
Kernel scheduler, cont.
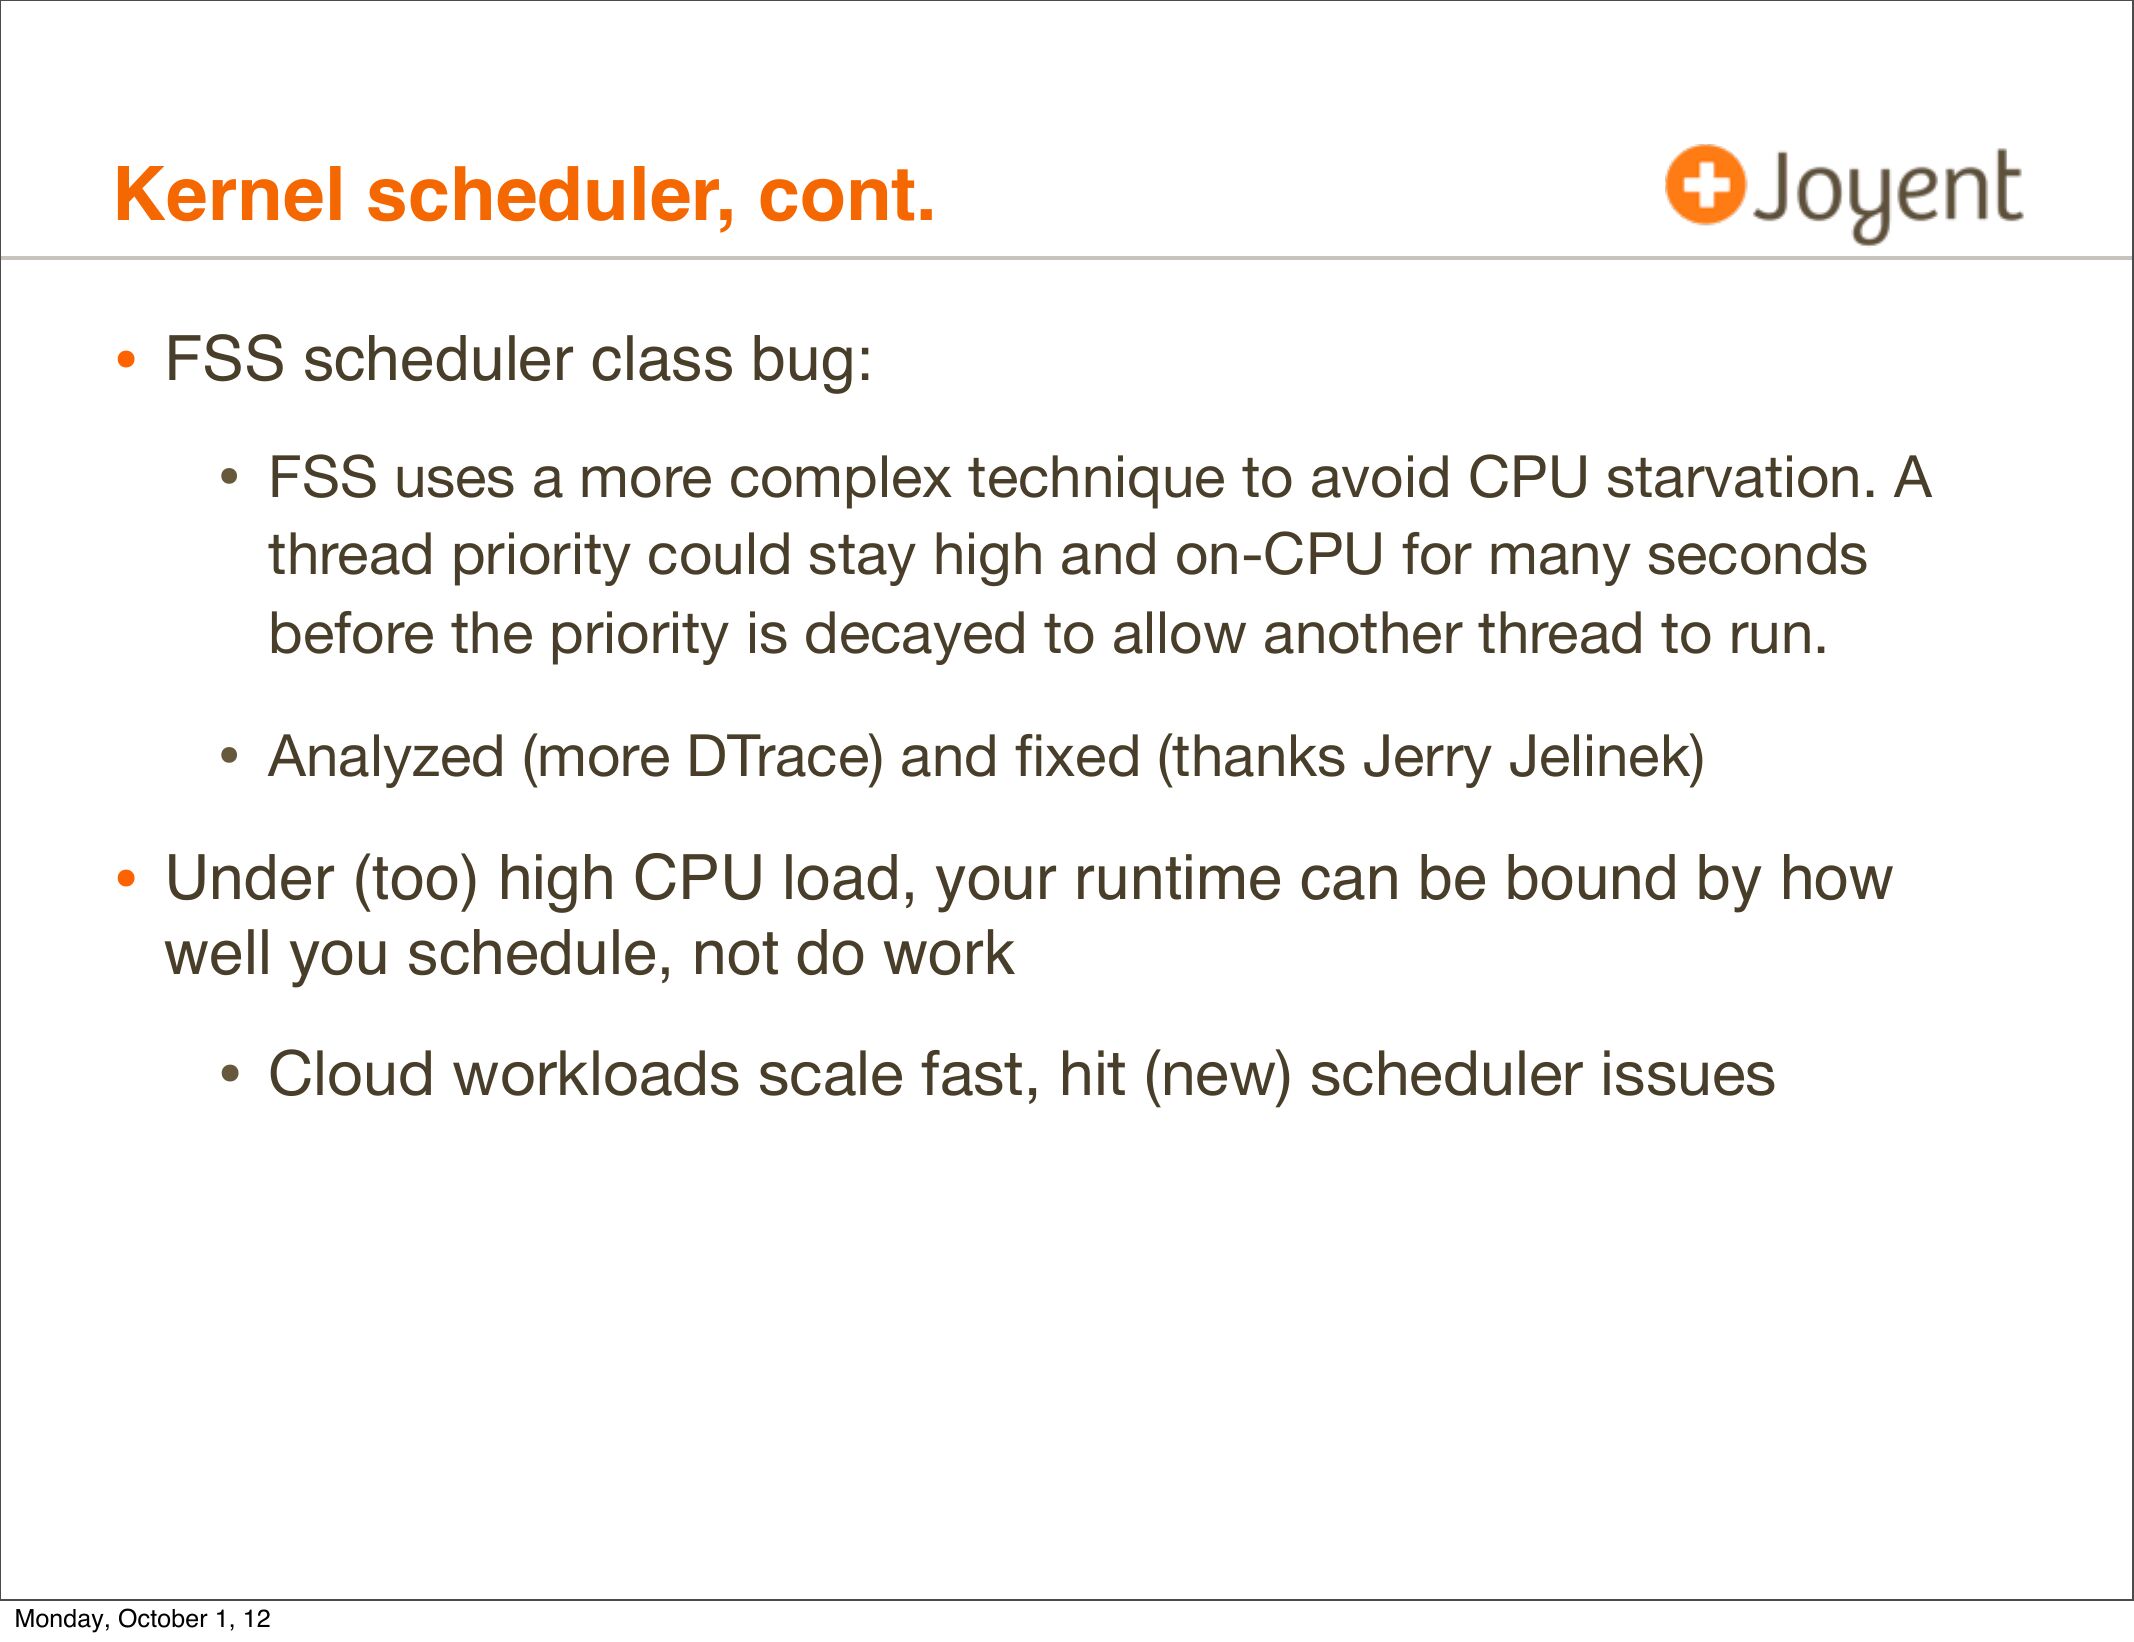
• FSS scheduler class bug:
• FSS uses a more complex technique to avoid CPU starvation. A
thread priority could stay high and on-CPU for many seconds
before the priority is decayed to allow another thread to run.
• Analyzed (more DTrace) and fixed (thanks Jerry Jelinek)
• Under (too) high CPU load, your runtime can be bound by how
well you schedule, not do work
• Cloud workloads scale fast, hit (new) scheduler issues
Monday, October 1, 12

slide 73:
Kernel scheduler, cont.
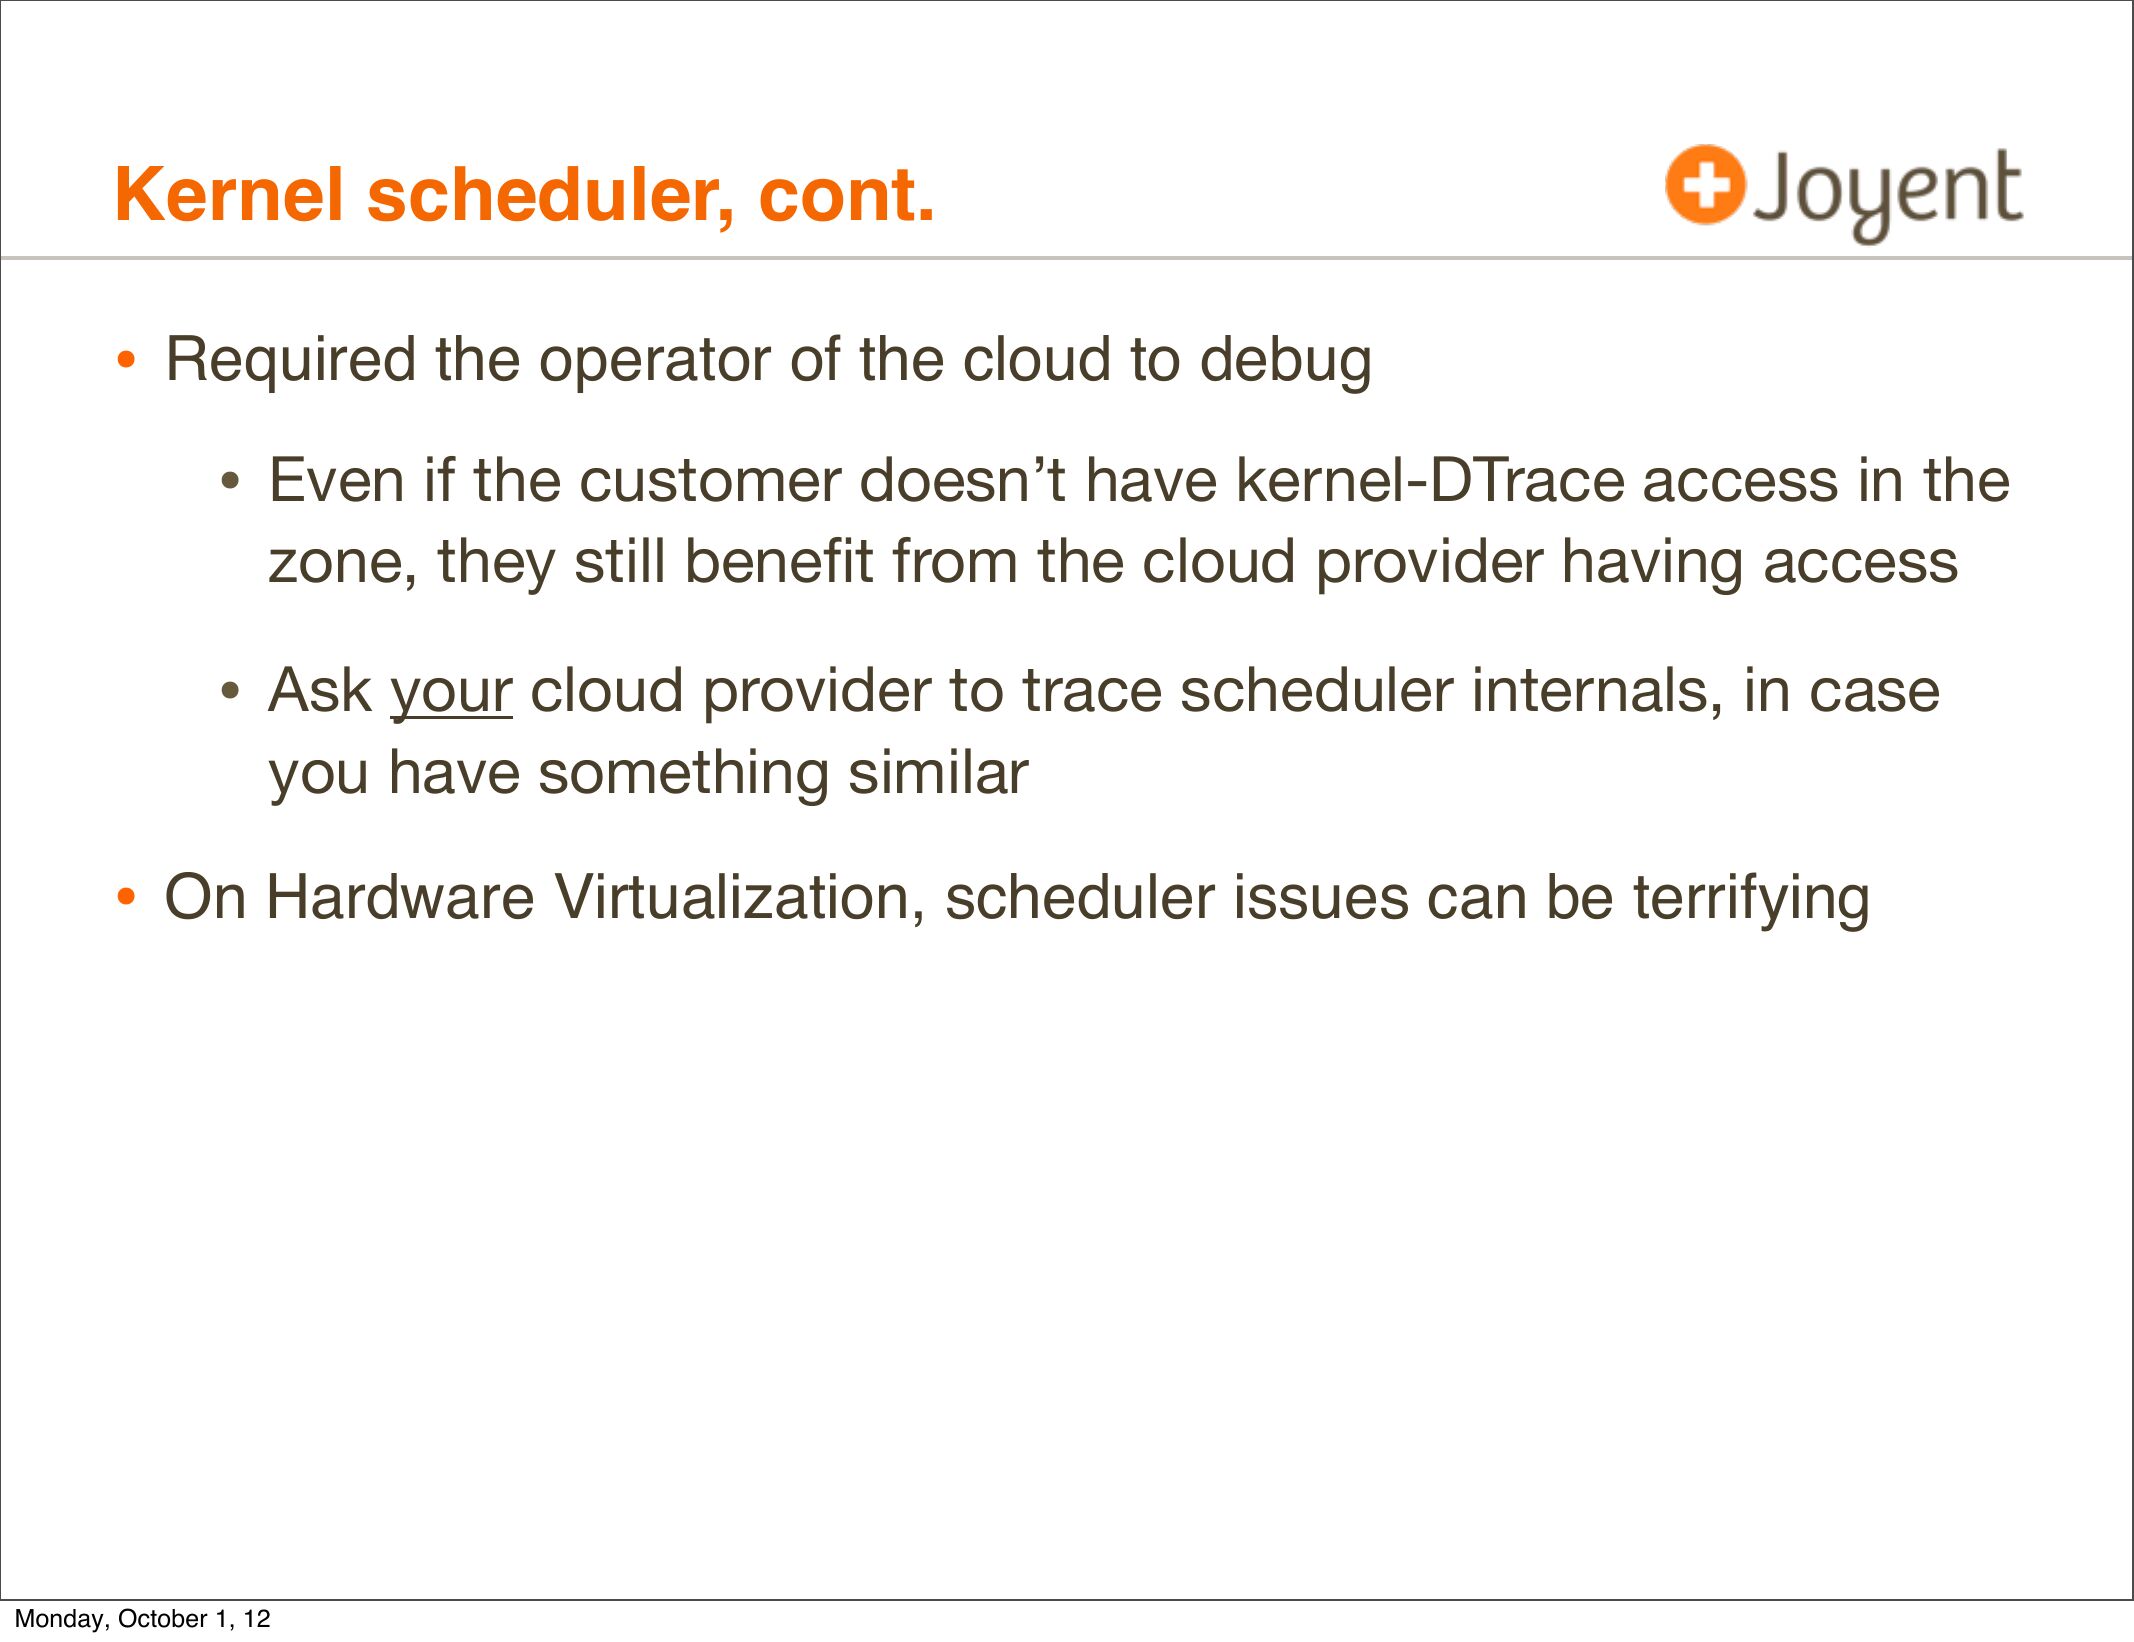
• Required the operator of the cloud to debug
• Even if the customer doesn’t have kernel-DTrace access in the
zone, they still benefit from the cloud provider having access
• Ask your cloud provider to trace scheduler internals, in case
you have something similar
• On Hardware Virtualization, scheduler issues can be terrifying
Monday, October 1, 12

slide 74:
Kernel scheduler, cont.
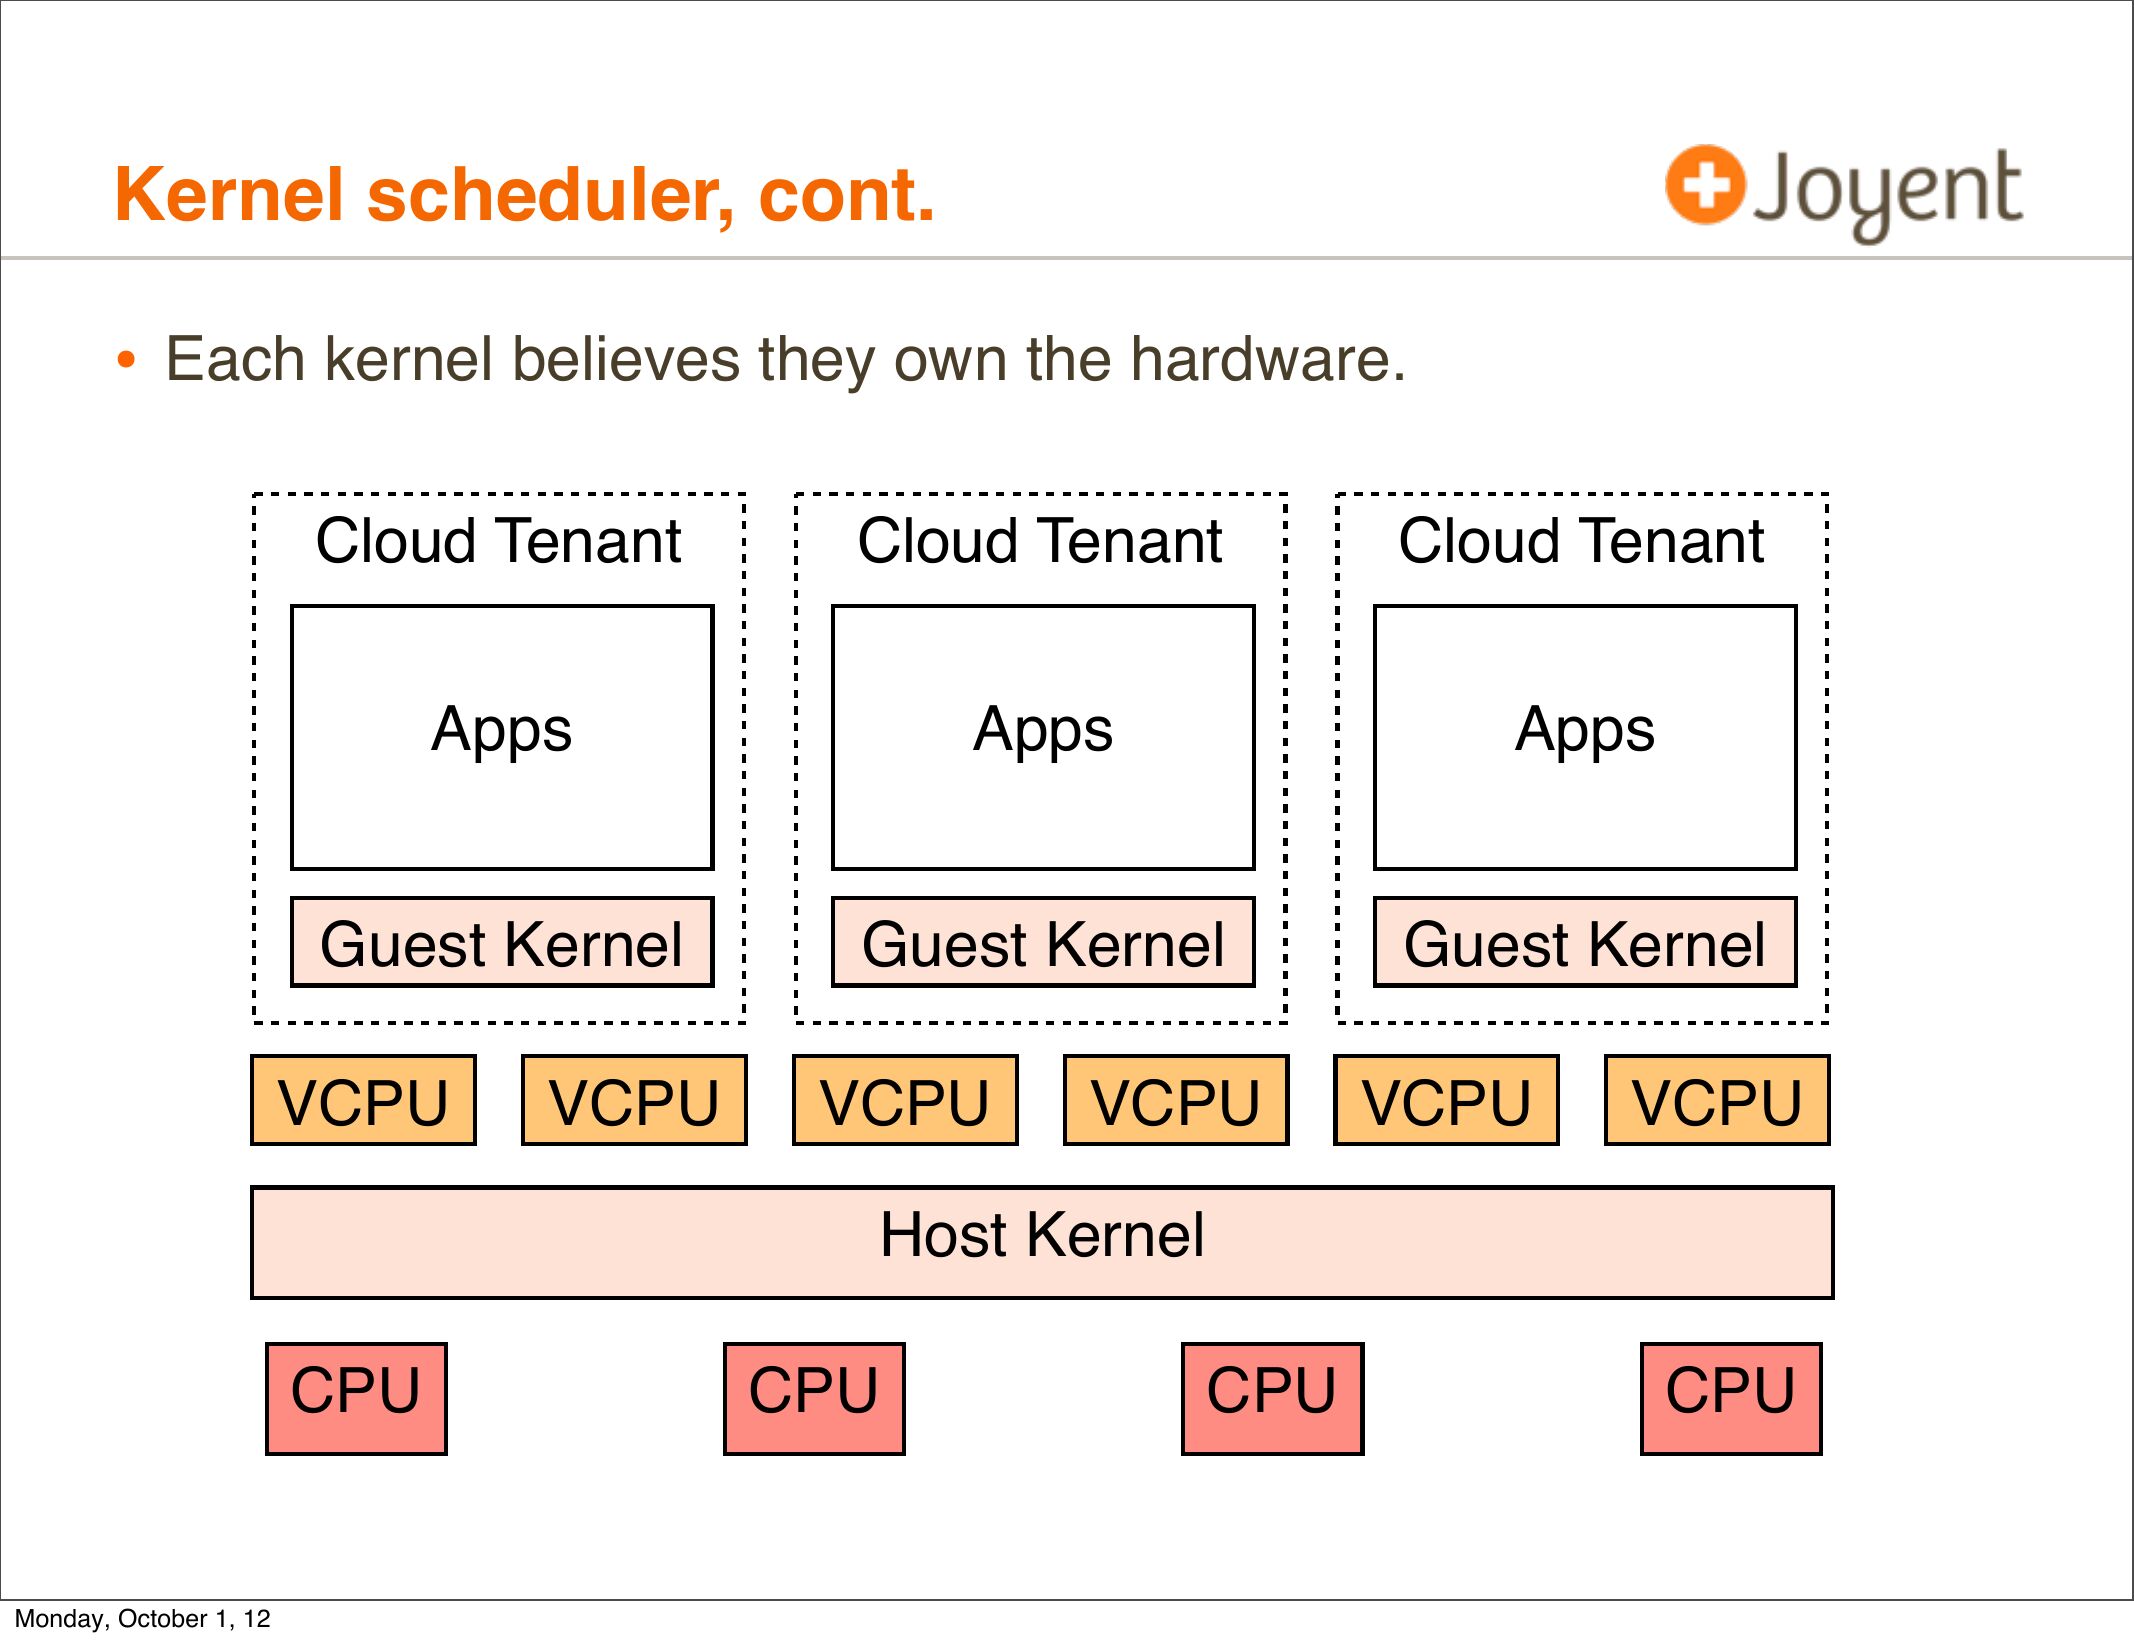
• Each kernel believes they own the hardware.
Cloud Tenant
Cloud Tenant
Cloud Tenant
Apps
Apps
Apps
Guest Kernel
Guest Kernel
Guest Kernel
VCPU
VCPU
VCPU
VCPU
VCPU
VCPU
Host Kernel
CPU
Monday, October 1, 12
CPU
CPU
CPU

slide 75:
Kernel scheduler, cont.
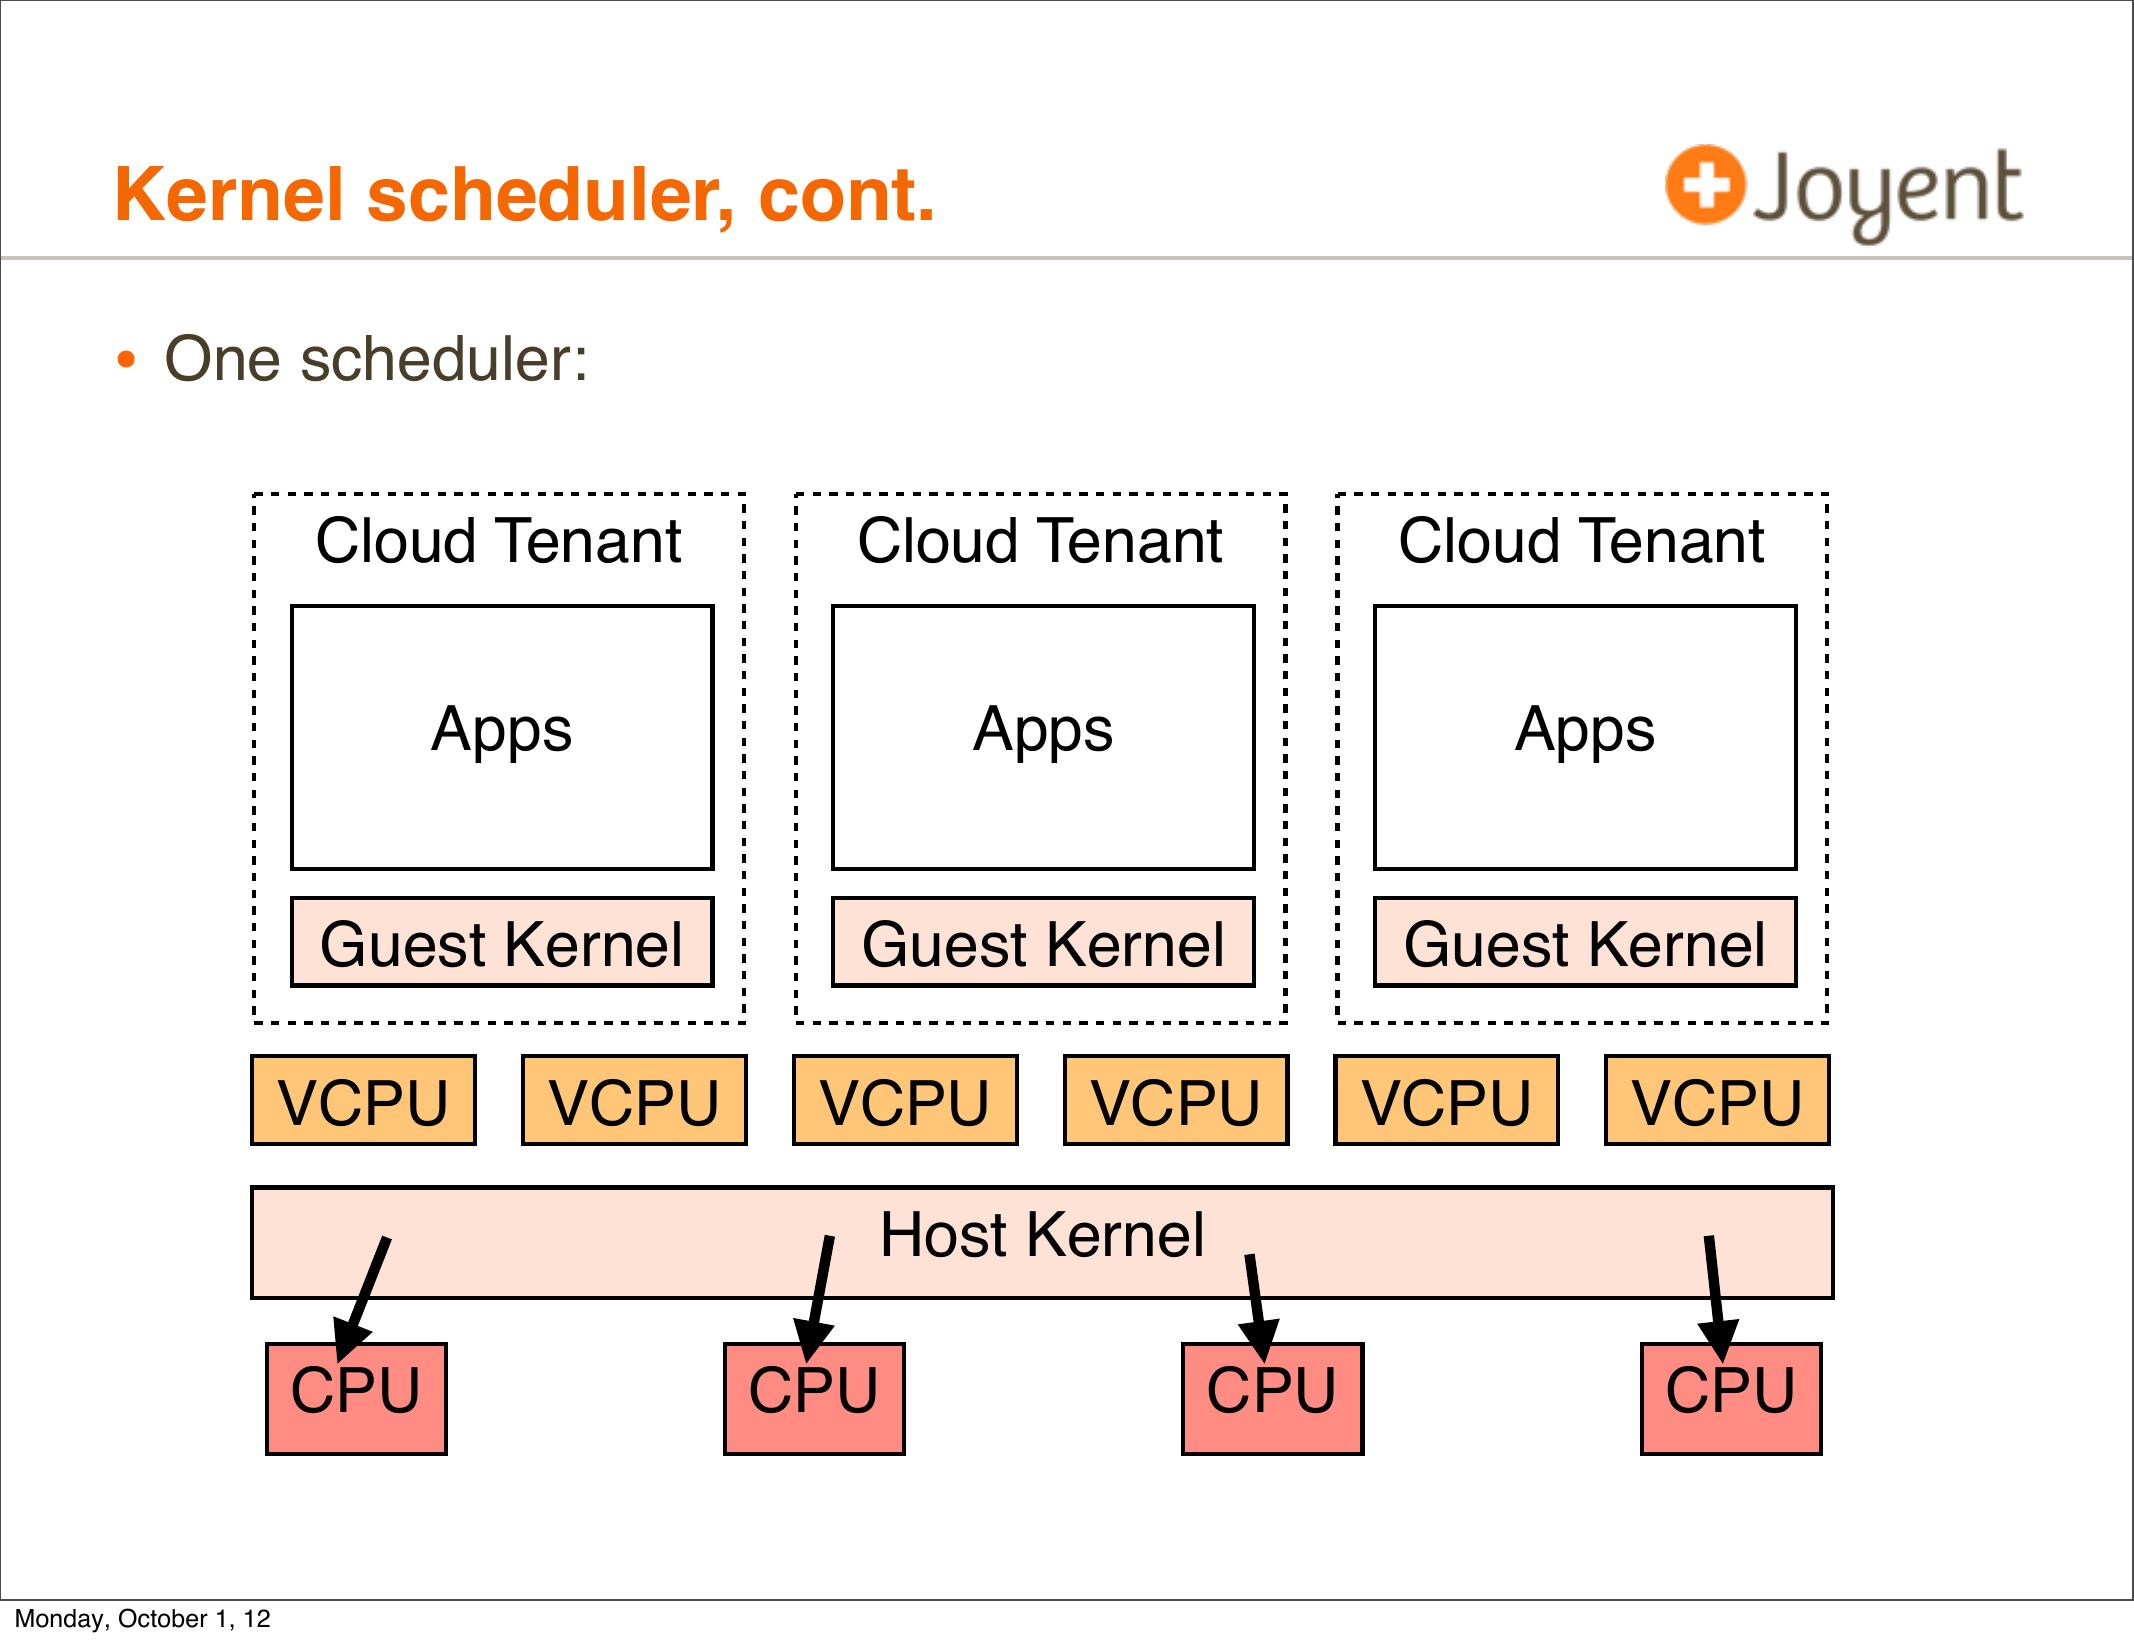
• One scheduler:
Cloud Tenant
Cloud Tenant
Cloud Tenant
Apps
Apps
Apps
Guest Kernel
Guest Kernel
Guest Kernel
VCPU
VCPU
VCPU
VCPU
VCPU
VCPU
Host Kernel
CPU
Monday, October 1, 12
CPU
CPU
CPU

slide 76:
Kernel scheduler, cont.
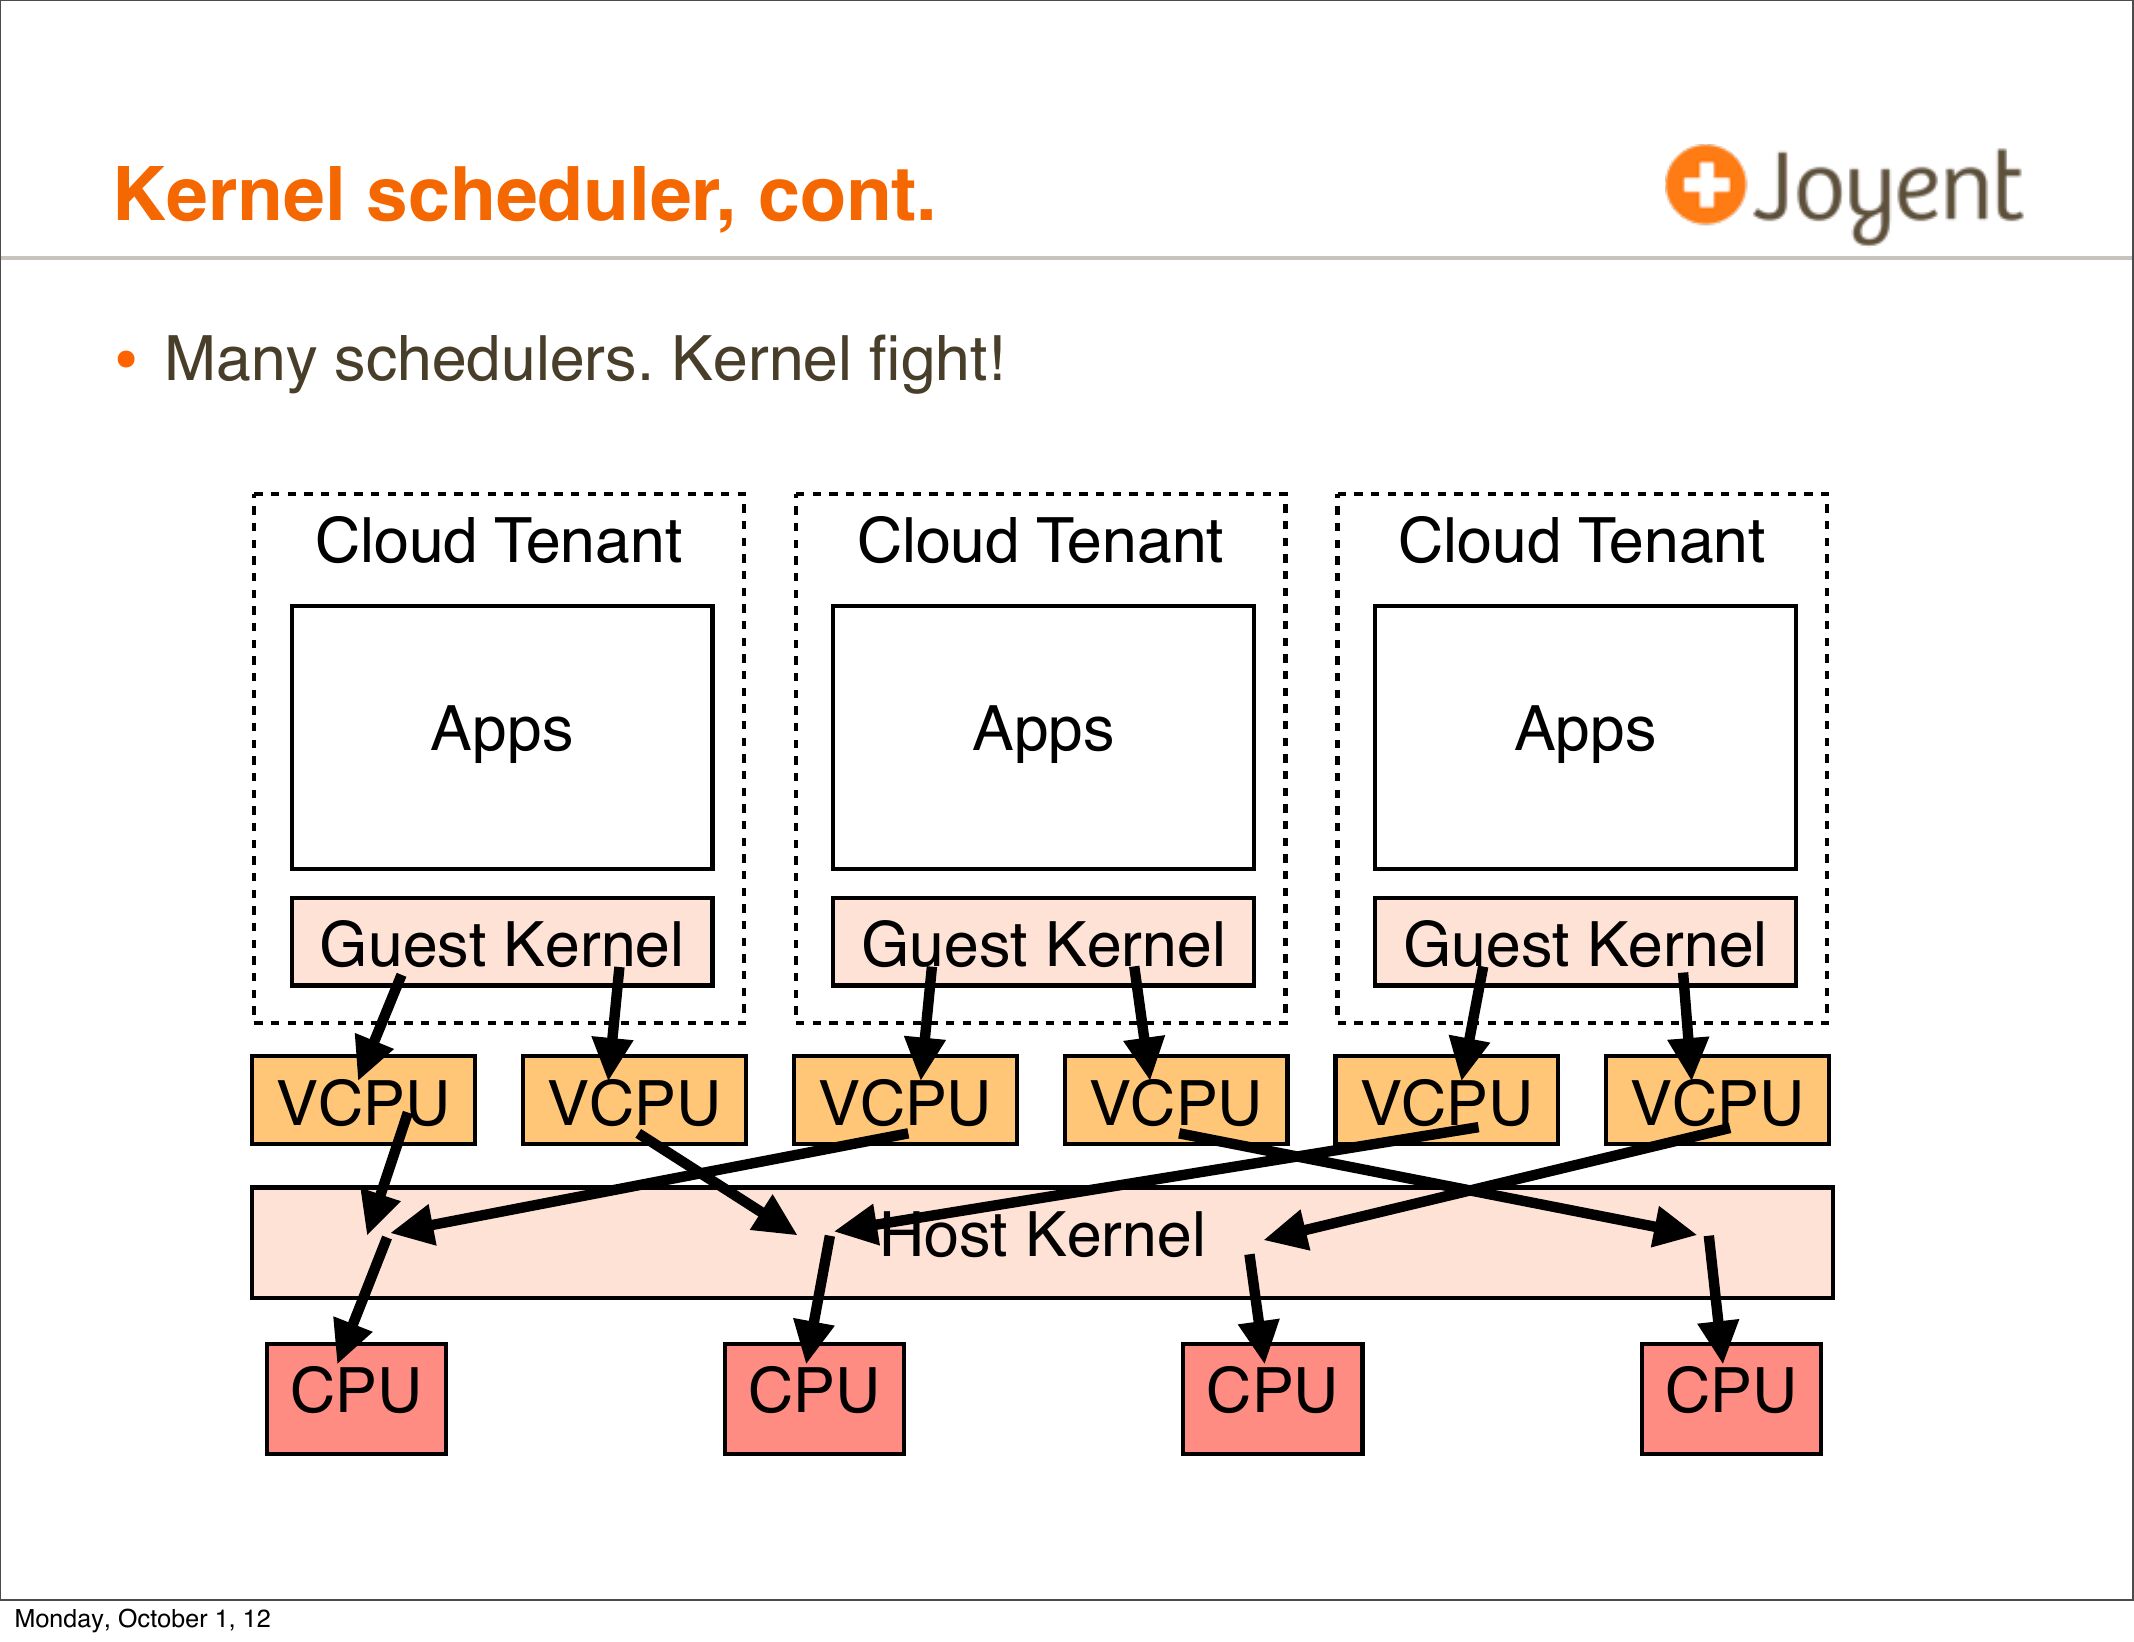
• Many schedulers. Kernel fight!
Cloud Tenant
Cloud Tenant
Cloud Tenant
Apps
Apps
Apps
Guest Kernel
Guest Kernel
Guest Kernel
VCPU
VCPU
VCPU
VCPU
VCPU
VCPU
Host Kernel
CPU
Monday, October 1, 12
CPU
CPU
CPU

slide 77:
Kernel scheduler, cont.
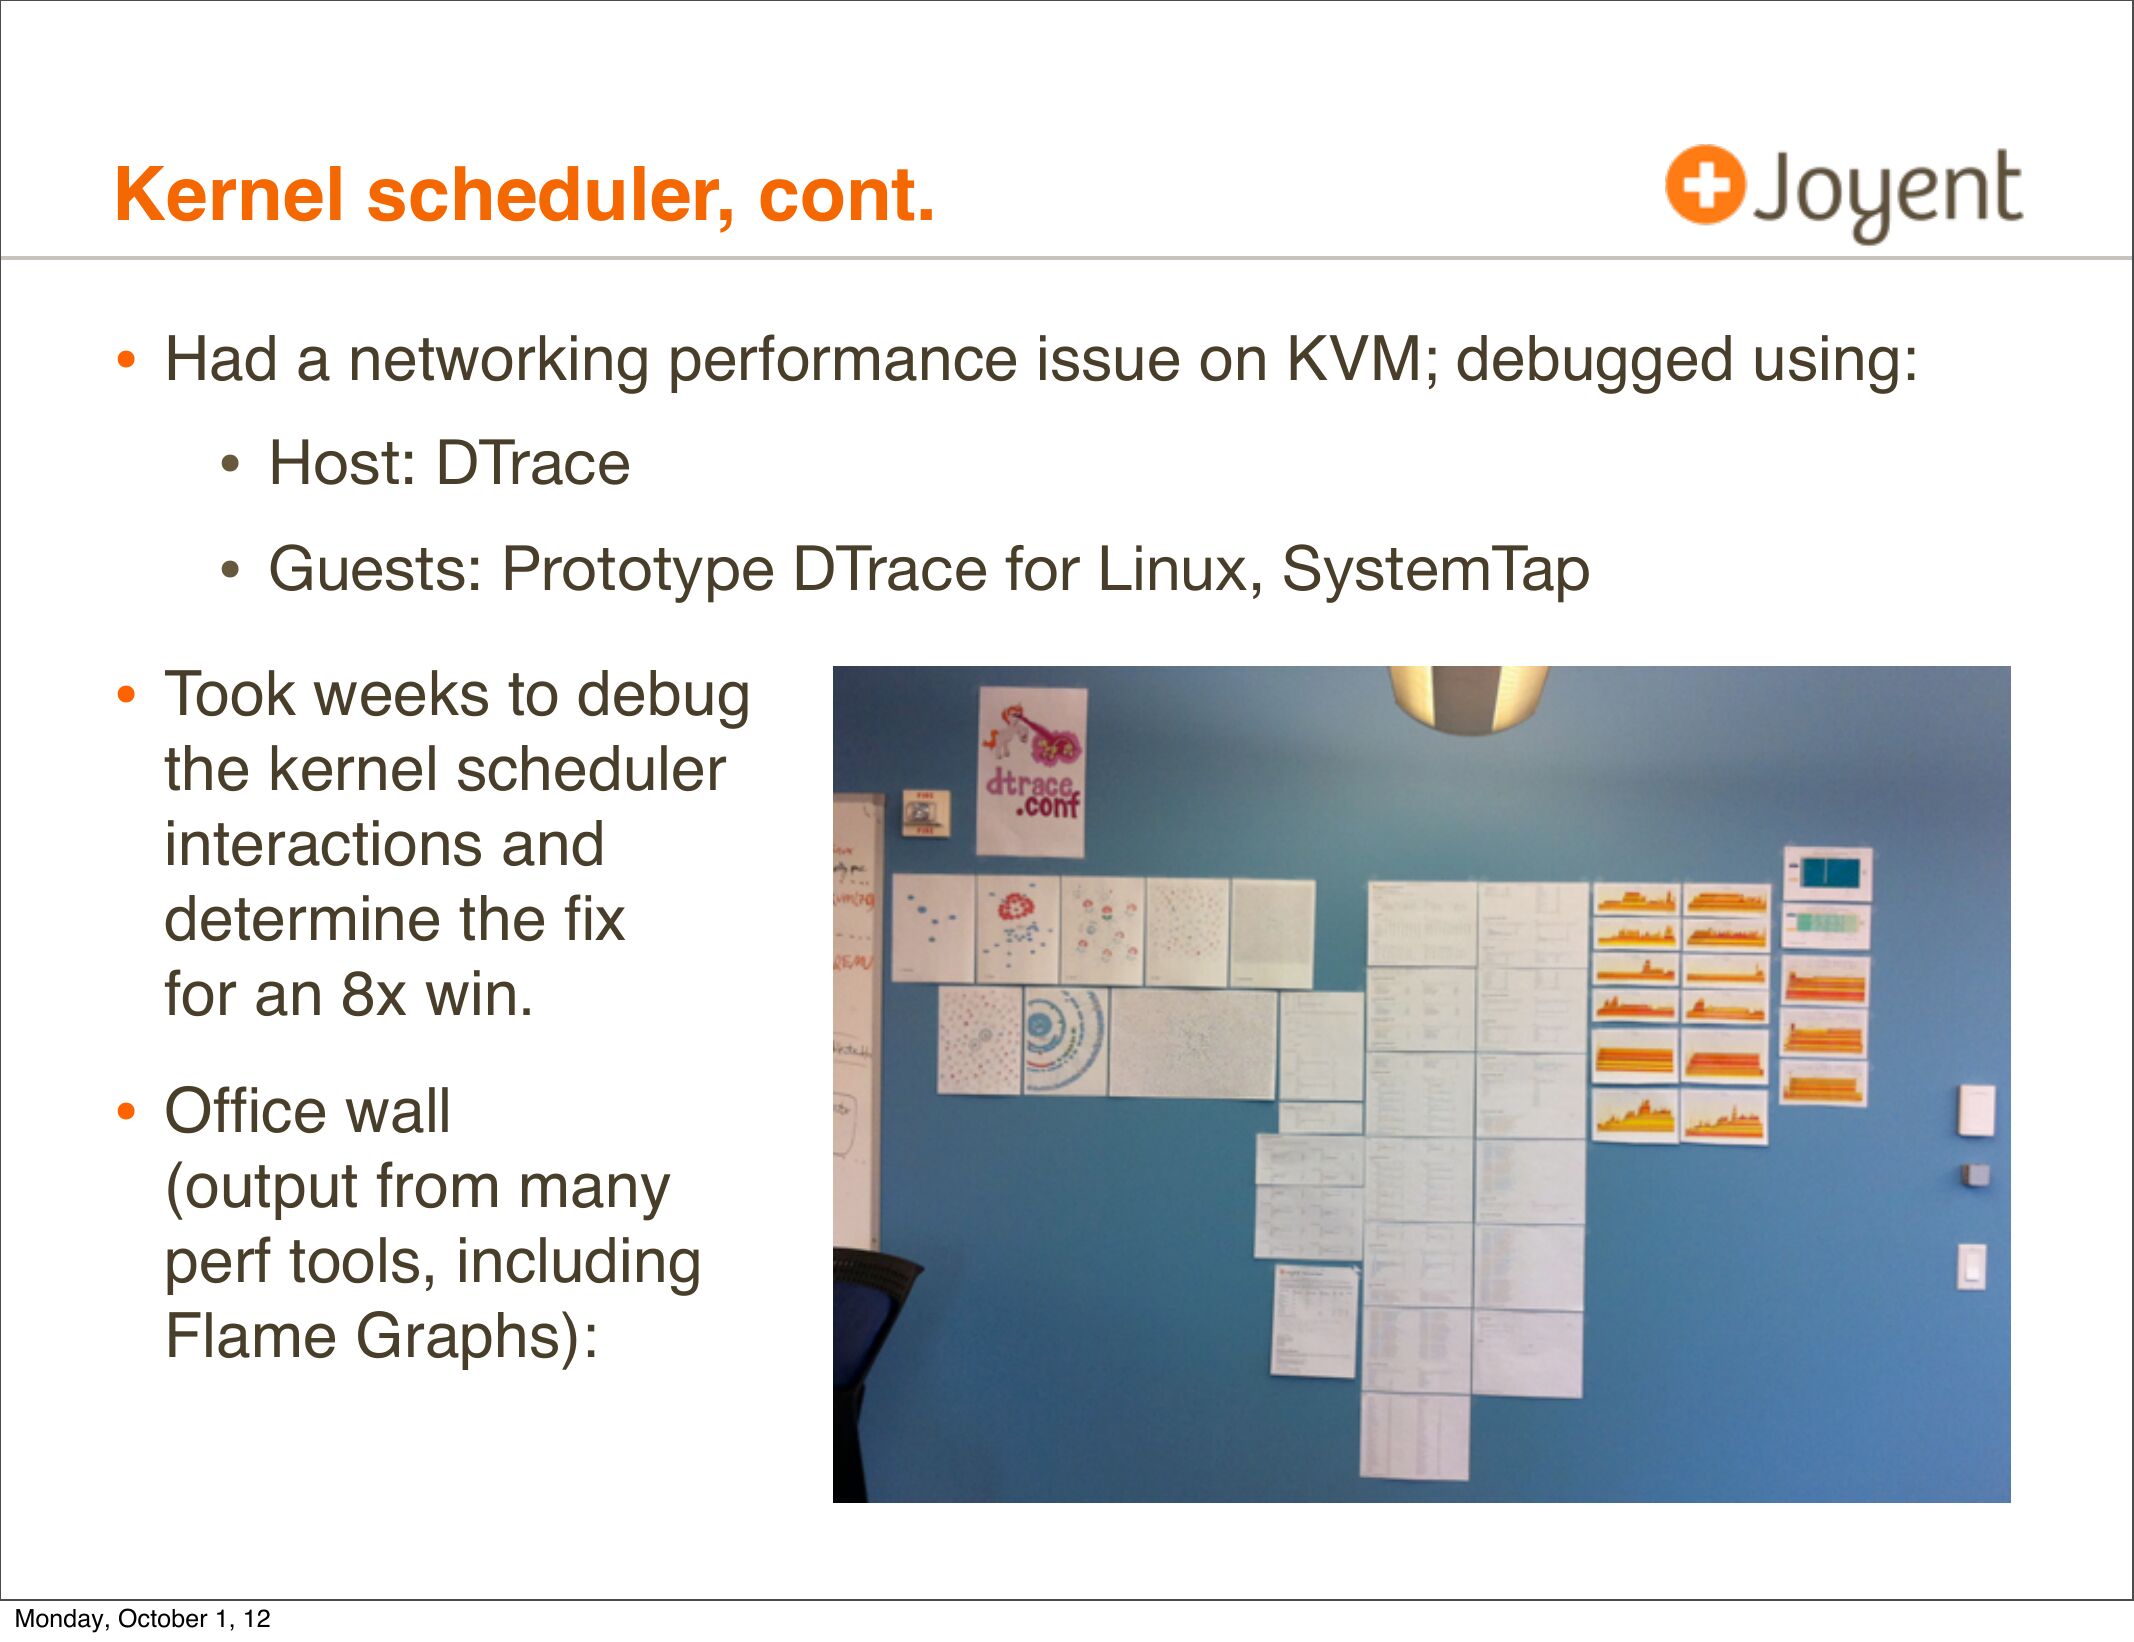
• Had a networking performance issue on KVM; debugged using:
• Host: DTrace
• Guests: Prototype DTrace for Linux, SystemTap
• Took weeks to debug
the kernel scheduler
interactions and
determine the fix
for an 8x win.
• Office wall
(output from many
perf tools, including
Flame Graphs):
Monday, October 1, 12

slide 78:
Thank you!
• http://dtrace.org/blogs/brendan
• email brendan@joyent.com
• twitter @brendangregg
• Resources:
• http://www.slideshare.net/bcantrill/dtrace-in-the-nonglobal-zone
• http://dtrace.org/blogs/dap/2011/07/27/oscon-slides/
• https://github.com/brendangregg/dtrace-cloud-tools
• http://dtrace.org/blogs/brendan/2011/12/16/flame-graphs/
• http://dtrace.org/blogs/brendan/2012/08/09/10-performance-wins/
• http://dtrace.org/blogs/brendan/2011/10/04/visualizing-the-cloud/
• Thanks @dapsays and team for Cloud Analytics, Bryan Cantrill for DTrace
fixes, @rmustacc for KVM perf war, and @DeirdreS for another great event.
Monday, October 1, 12


