Solaris Memory Leak (and Growth) Flame Graphs

Your application memory usage is steadily growing, and you are racing against time to fix it. This could either be memory growth due to a misconfig, or a memory leak due to a software bug. For some applications, performance can begin to degrade as garbage collection works harder, consuming CPU. If an application grows too large, performance can drop off a cliff due to paging (swapping), or the application may be killed by the system (OOM killer). You want to take a quick look before either occurs, in case it's an easy fix. But how?
Note: This page was last updated in 2014 and is no longer maintained. It is now part of my Crypt, and kept here for reference. The new Linux version is here.
Debugging growth issues involves checking the application config and memory usage, either from application or system tools. Memory leaks are much harder, but there are many tools to help. Some take a core dump and then post-process that, like mdb (modular debugger) and ::findleaks. They usually pause the application while a core dump is taken, or require the application to be terminated, so that free() routines are called. Some launch the application with malloc() calls interposed with instrumentation, like Valgrind memcheck, which can also simulate a CPU so that all memory accesses can be checked. This can cause the application to run 20-30 times slower, or more.
While core dump or interposing techniques provide invaluable detail for diagnosing memory leaks, neither of them can easily be used on a growing application that has caught your attention.
I'll summarize four dynamic and static tracing approaches I use for analyzing memory growths and leaks on an already running application, for both virtual and physical memory. These focus on the code path responsible for memory usage, examined as stack traces. I'll then use Flame Graphs to visualize these code paths and the magnitude of memory usage.
The four approaches are illustrated in the following figure, as the events in green text:
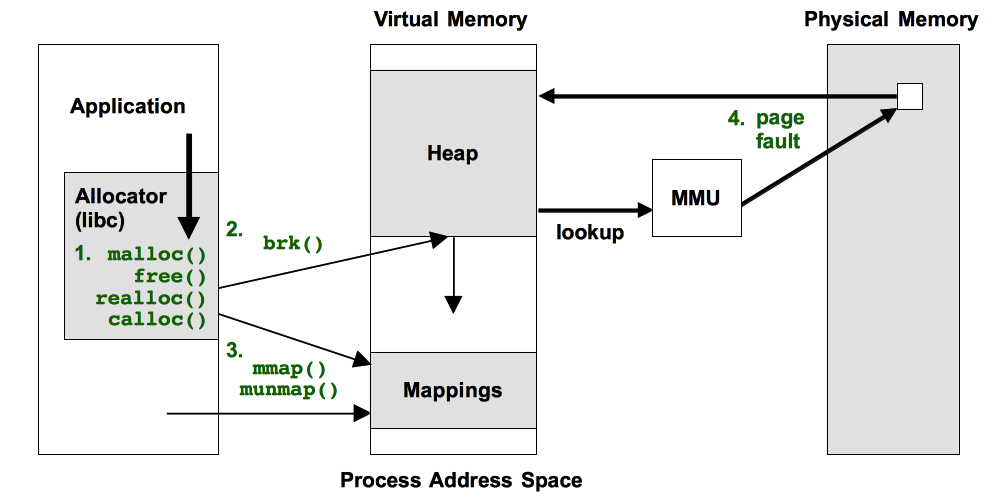
All of these have shortcomings, which I'll explain.
1. Allocator Tracing: malloc(), free(), ...
This is where the memory allocator functions, malloc(), free(), etc, are traced. Imagine you could run Valgrind memcheck with "-p PID" on a process, and gather memory leak statistics for 60 seconds or so. Not a complete picture, but hopefully enough to catch egregious leaks. Same performance hit or even worse, but you only take that hit if and when you need to, and for a limited duration.
These allocator functions operate on virtual memory, not physical (resident) memory, which is usually the target of leak detection. Fortunately, they usually have a strong correlation at this level.
Some of us have tried this approach before. Sanjeev Bagewadi wrote memleak.d using DTrace in 2005, which dumps memory address details on every malloc(), realloc(), calloc(), and free(), which are then processed by a separate Perl program to detect leaks (example output here).
Yichun Zhang (agentzh) has recently written leaks.stp using SystemTap, which is a more efficient approach: processing memory addresses while in kernel context before emitting the summary of detected leaks and stack traces. He also has also created flame graphs from this, example here, which looks great. I've since added a new color palette to flame graphs so that we can differentiate CPU flame graphs (hot colors) from memory ones (green colors).
I've tried allocator tracing, but I wasn't happy about the overhead it caused, which can be significant. This is because allocator functions, like malloc() and free(), can be extremely frequent, and adding a small amount of overhead can add up. But then, solving issues can make it worth it. It may also be less overhead than Valgrind's memcheck, although I haven't compared them side by side. If you want to try this approach yourself, remember to trace all allocator functions: malloc(), realloc(), calloc(), etc.
I've also developed indirect approaches as described in the following sections on brk(), mmap(), and page faults. This is a tradeoff: for leak detection they aren't nearly as effective as tracing allocator functions directly, but they do incur much less overhead.
2. brk() syscall
Many applications grow using brk(). This syscall sets the program break point: the end of the heap segment (aka the process data segment). brk() isn't called by the application directly, but rather the user-level allocator which provides the malloc()/free() interface. Such allocators typically don't give memory back the OS, keeping freed memory as a cache for future allocations. And so, brk() is typically for growth only (not shrinks). We'll assume that's the case, simplifying how it is traced.
In DTrace, tracing brk() can be done as a one-liner, which can also show the user-level stack that led to it. In this example, tracing "mysqld" processes only (MySQL server):
# dtrace -n 'syscall::brk:entry /execname == "mysqld"/ { @[ustack()] = count(); }'
^C
[...]

              libc.so.1`_brk_unlocked+0xa
              libc.so.1`sbrk+0x3b
              libmtmalloc.so.1`morecore+0x29
              libmtmalloc.so.1`malloc_internal+0xf3
              libmtmalloc.so.1`malloc+0x3b
              mysqld`my_malloc+0x32
              mysqld`init_alloc_root+0x73
              mysqld`_Z14init_sql_allocP11st_mem_rootjj+0x15
              mysqld`_ZN18Prepared_statementC1EP3THD+0xaf
              mysqld`_Z19mysqld_stmt_prepareP3THDPKcj+0x4a
              mysqld`_Z16dispatch_command19enum_server_commandP3THDPcj+0xefb
              mysqld`_Z24do_handle_one_connectionP3THD+0x13f
              mysqld`handle_one_connection+0x47
              mysqld`pfs_spawn_thread+0x16f
              libc.so.1`_thrp_setup+0x8a
              libc.so.1`_lwp_start
               32
The output includes multiple stack traces along with their occurrence count that led to the brk(). Here, only the last stack and count is shown. The full output isn't too long as brk() is usually infrequent: it's only occurring when the allocator has requests that spill-over its current heap size. This also means that the overhead is very low, and should be negligible. Compare this to malloc()/free() interposers, where the slow-down can be 10x and higher.
Your OS may or may not have brk() as a kernel-provided syscall, and therefore may not have a DTrace syscall::brk:entry probe. In that case, see the next section on mmap(). Another difference to watch out for is the sbrk() syscall, which, if a sbrk probe exists, needs to be traced as well. The above stack shows that sbrk() is provided by libc on this OS, which calls into brk().
Going further with brk(): the following DTrace script, brkbytes.d, records the stacks along with the size, in bytes, of the heap expansion. Like the one-liner, this matches any process named "mysqld":
#!/usr/sbin/dtrace -s

inline string target = "mysqld";
uint brk[int];

syscall::brk:entry /execname == target/ { self->p = arg0; }
syscall::brk:return /arg0 == 0 && self->p && brk[pid]/ {
	@[ustack()] = sum(self->p - brk[pid]);
}
syscall::brk:return /arg0 == 0 && self->p/ { brk[pid] = self->p; }
syscall::brk:return /self->p/ { self->p = 0; }
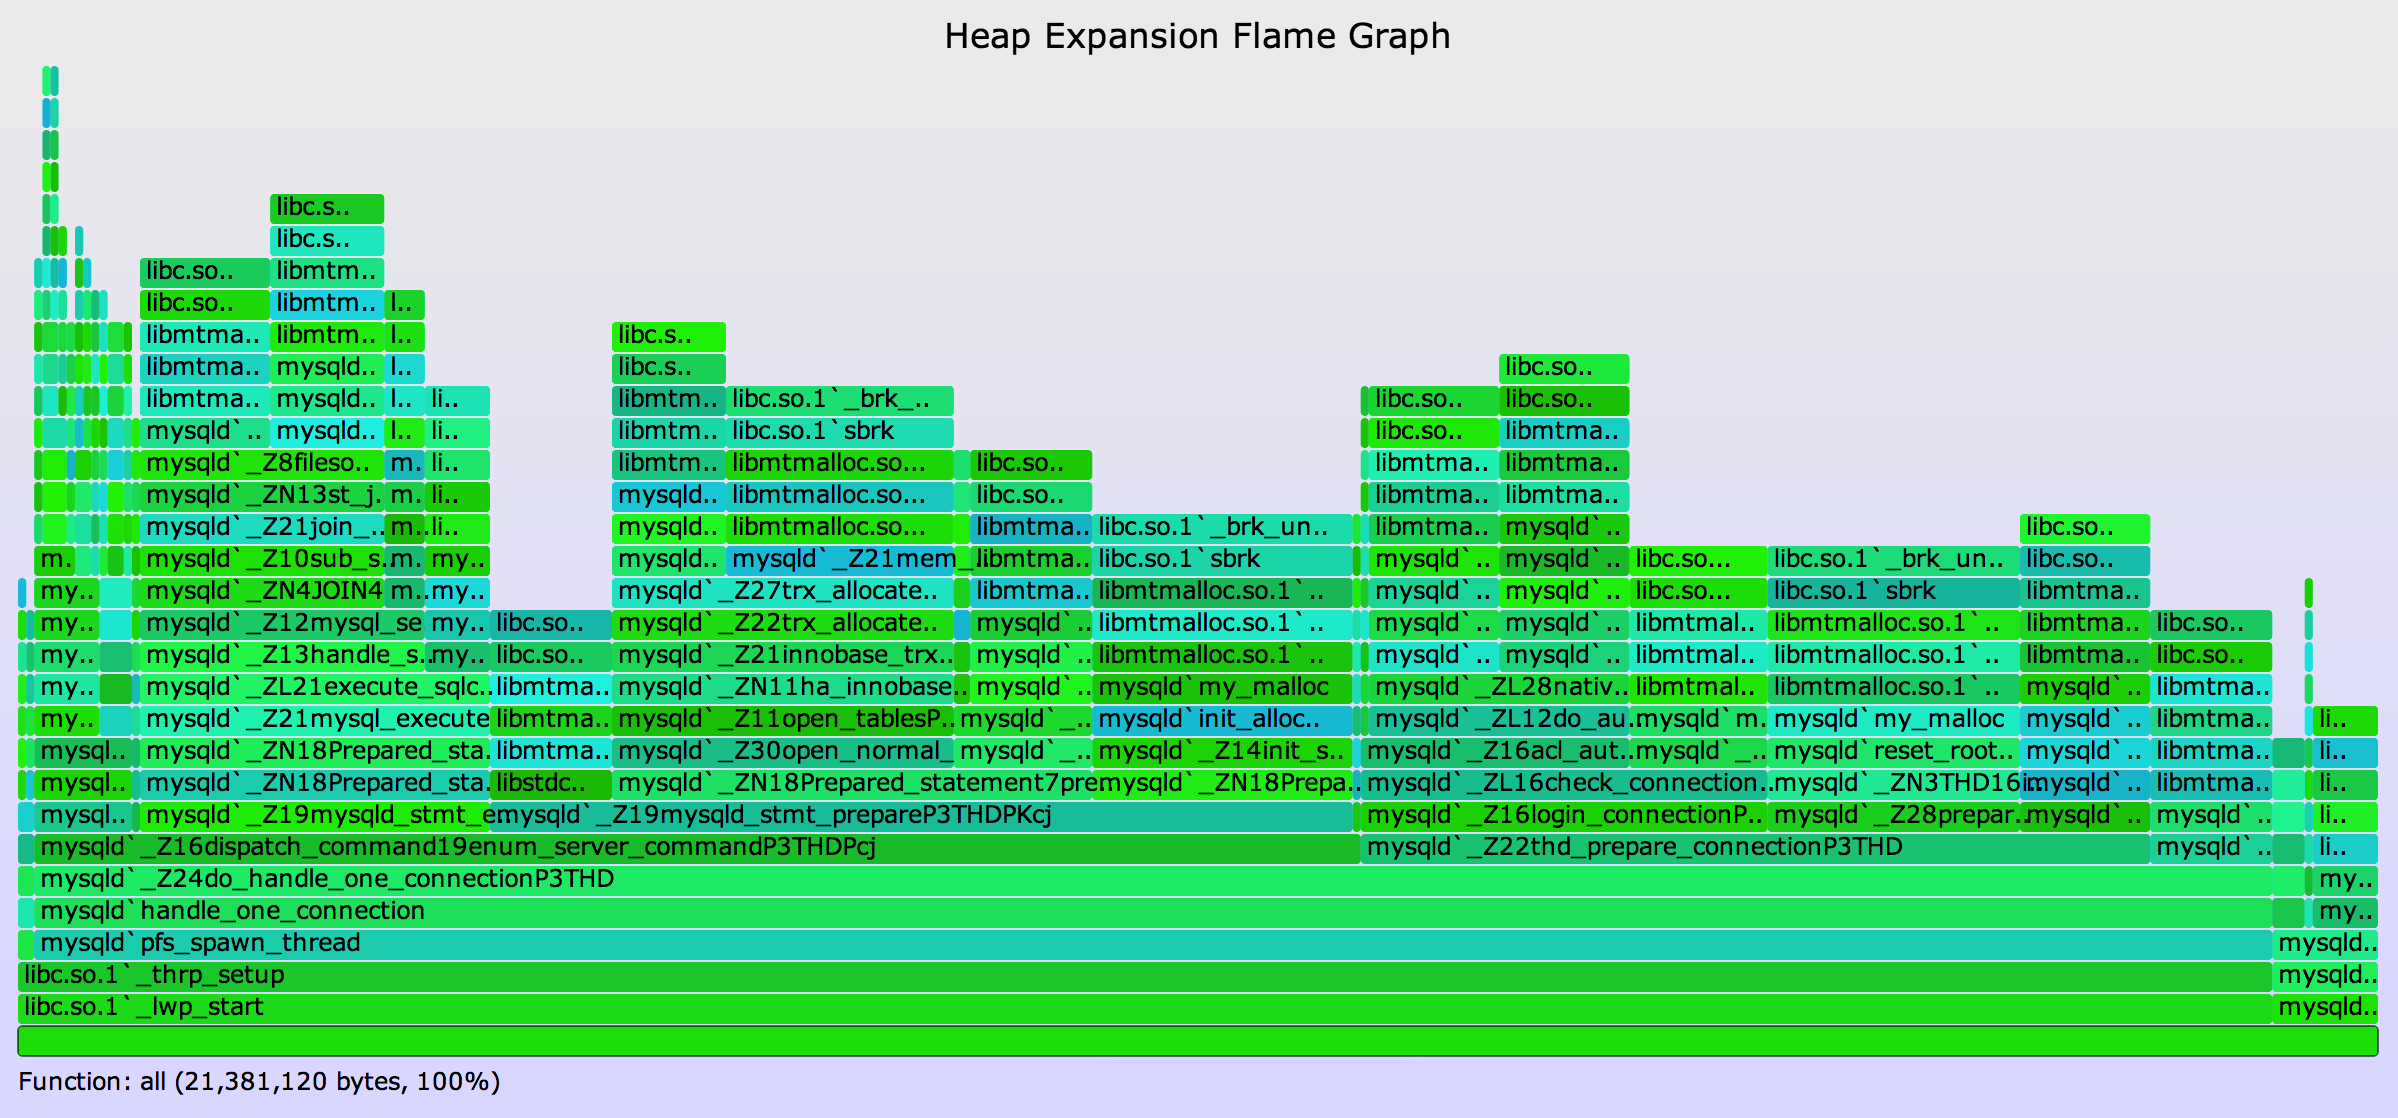
This was executed, and the output rendered as a heap expansion flame graph, using:
# ./brkbytes.d -n 'tick-60s { exit(0); }' > out.mysqld_brkbytes01
# ./stackcollapse.pl out.mysqld_brkbytes01 | ./flamegraph.pl --countname=bytes \
    --title="Heap Expansion Flame Graph" --colors=mem > mysqld_brkbytes.svg
Mouse over elements for details (if the SVG doesn't work in your browser, try the PNG):
This example MySQL server doesn't have a leak (that I know of), but rather shows memory growth from brk() calls. About 12 Mbytes were from processing a query, seen above dispatch_command() (mangled C++ signatures are shown here).
The total amount captured, 21 Mbytes, equals the virtual memory expansion as observed from other tools (prstat/top).
What brk() tracing can tell us is the code paths that lead to heap expansion. This could be either:
- A memory growth code path
- A memory leak code path
- An innocent application code path, that happened to spill-over the current heap size
- Asynchronous allocator code path, that grew the application in response to diminishing free space
It requires some sleuthing to tell them apart. If you are searching for leaks in particular, sometimes you'll be lucky and it'll be an unusual code path that is easily found in a bug database as a known leak.
If you're unlucky, the code path isn't visible in the stack trace. This can happen with virtual machine languages, where the external profiler shows the stack frames for the VM but not the program it's running (that problem is fixed in DTrace with ustack helpers).
While brk() tracing shows what led to expansion, page fault tracing, covered later, shows what then consumed that memory.
3. mmap() syscall
The mmap() syscall may be explicitly used by the application for loading data files or creating working segments, especially during initialization and application start. In this context, we're interested in creeping application growth, which may occur via mmap() if the allocator uses it instead of brk(). glibc does this for larger allocations, which can be returned to the system using munmap().
You can trace and display mmap() in a similar manner to brk(), showing the bytes of the new mappings. In DTrace this can be a one-liner, eg, for "mysqld" processes:
# dtrace -n 'syscall::mmap:entry /execname == "mysqld"/ { @[ustack()] = sum(arg1); }'
Unlike brk(), mmap() calls don't necessarily mean growth, as they may be freed shortly after using munmap(). And so tracing mmap() using this one-liner may show many new mappings, but most or all of them are neither growth nor leaks.
As with malloc()/free() tracing, mapping addresses can be inspected and associated so that those that were not freed can be identified. I'll leave that as an excercise for the reader. :-)
As with brk() tracing, once you can identify those mappings that have grown (and not munmap()ed), they will show either:
- A memory growth code path
- A mapping memory leak code path
- Asynchronous allocator code path, that grew the application in response to diminishing free space
This should also be a low overhead approach for analyzing growth, due to the low rate of mmap() and munmap() calls. If these are called frequently, say, over ten thousand times per second, then the overhead can become significant. That would also be a sign of a poorly designed allocator or application.
4. Page Faults
brk() and mmap() tracing show virtual memory expansion. Physical memory is consumed later, when the memory is written to, causing page faults, and virtual to physical mappings to be initialized. This activity can happen in a different code path, and one that may (or may not) be more illuminating. It can be analyzed by tracing the page faults, as is done in the following one-liner, which examines the same MySQL server:
# dtrace -x ustackframes=100 -n 'vminfo:::as_fault /execname == "mysqld"/ {
    @[ustack()] = count(); } tick-60s { exit(0); }' > out.mysqld_fault01
# ./stackcollapse.pl out.mysqld_fault01 | ../flamegraph.pl --countname=pages \
    --title="Page Fault Flame Graph" --colors=mem > mysqld_fault.svg
The total amount captured, about 120 Mbytes (30,826 x assumed 4 Kbyte page size), equals the resident memory expansion as observed from other tools (prstat/top).
The earlier techniques show the initial allocation code paths. Page fault tracing shows different code paths: those that are actually eating physical memory. This will be either:
- A memory growth code path
- A mapping memory leak code path
Again, some sleuthing is required to tell them apart. If you are hunting leaks and have a similar application that isn't growing, then taking page fault flame graphs from each and then looking for the extra code paths can be a quick way to identify the difference. If you are developing applications, then collecting baselines each day should let you identify not only that you have an extra growing or leaking code path, but the day that it appeared, helping you track down the change.
The overhead of page fault tracing is likely a bit higher than brk() or mmap() tracing, but not by much: page faults should still be relatively infrequent, making this tracing approach near negligible.
Getting Started
If you want to try these approaches yourself, you'll need a tracing tool that provides coverage with static probes or dynamic tracing. User-level tracing is needed for the allocator functions, and kernel tracing for the page faults. Syscalls (brk(), mmap()) can usually be traced at either the user- or kernel-level. There are several tracing tools that meet these requirements; DTrace and SystemTap are programatic, and so can reduce overheads further by in-kernel filtering and aggregations.
To use this for solving real issues, live and in production, another requirement is that the tool must be safe to use in production, which DTrace has been designed to be.
You'll also want the tracing tool to be able to show readable stack traces. My examples used MySQL, which is C and C++. Languages like node.js are trickier, since user stack traces show the VM internals and not the node.js program. In those cases, you need a tracer that meets the earlier requirements, and can also show the program stack. DTrace does this with language ustack helpers, for example, the one Dave Pacheco developed for node.js.
Summary
I've described four techniques for analyzing memory growth using dynamic tracing: allocator function tracing, brk() and mmap() syscall tracing, and page fault tracing. These can identify growth of either virtual or physical memory, and includes all reasons for growth including leaks. The brk(), mmap(), and page fault approaches can't separate out leaks directly, which require further analysis.
Their advantage is that they should be low overhead, such that they can be used on a live production application (provided the profiler ensures safety), and without restarting it.
See the main Flame Graphs page for other types of flame graphs and links, and the flame graph software.