

I originally posted this at http://bdgregg.blogspot.com/2006/05/dtracetaztool-alpha-release-several.html.
Several years ago, Richard McDougall wrote taztool, a GUI to display disk activity in an amazing and intuitive way. It used TNF trace data, a predecessor of DTrace.
In Janurary 2006, I began writing a DTrace version of taztool: DTraceTazTool. I wrote it using GTK and DTrace. Since then, the DTrace JNI has been released, and I've paused developing DTraceTazTool until I've taken a long look at Java 1.5. Until then, I'm releasing where I am at with the GTK/C version, on my DTrace website.
This is an alpha release. I'm still adding functionality, working through a todo list, and fixing bugs. I'm releasing it early as it is already somewhat useful, and a great demo of DTrace. Probably the next feature I'll add is the ability to trace an entire disk at a time, rather than per-slice.
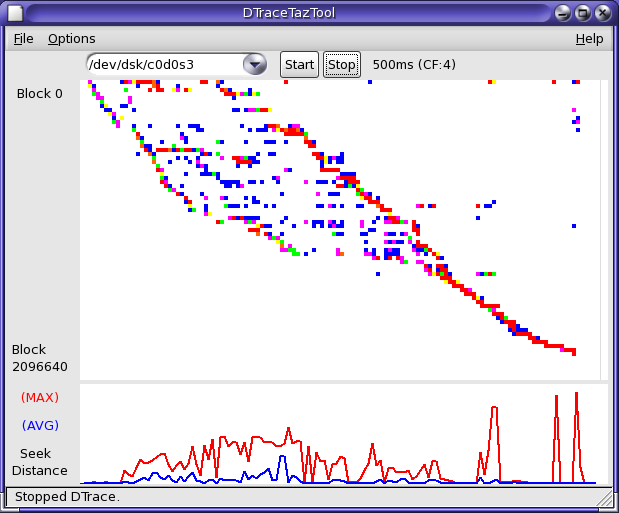
The following screenshot shows a UFS file system that was archived using the tar command. For the top plot: the requested block location is on the Y-axis, time is the X-axis, and the colour reflects the number of requests for that location (many == red). The bottom plot shows maximum and average seek distance:
DTraceTazTool already has some tunable options, such as the size of the pixels drawn and the sample rate:
DTraceTazTool needs to either run as root, or as a user with the dtrace_kernel privilege.
I hope you enjoy the tool so far. I'll post about updates as I complete them.