The USE Method
(1969)
The Utilization Saturation and Errors (USE) Method is a methodology for analyzing the performance of any system. It directs the construction of a checklist, which for server analysis can be used for quickly identifying resource bottlenecks or errors. It begins by posing questions, and then seeks answers, instead of beginning with given metrics (partial answers) and trying to work backwards.
The resulting USE Method-derived checklists for different operating systems are listed on the left navigation panel (Linux, Solaris, etc). You can customize these for your environment, adding additional tools that your site uses. There is also the Rosetta Stone of Performance Checklists, automatically generated from some of these. Performance monitoring products can make the USE method easier to follow by providing its metrics via an easy-to-use interface.
|
Table of contents: Intro Summary Hardware Metrics Software Interpretations Strategy Apollo Others Conclusion Acks Updates |
USE Checklists: Rosetta Linux Solaris Mac OS X FreeBSD Unix 7th SmartOS |
Intro
A serious performance issue arises, and you suspect it's caused by the server. What do you check first?
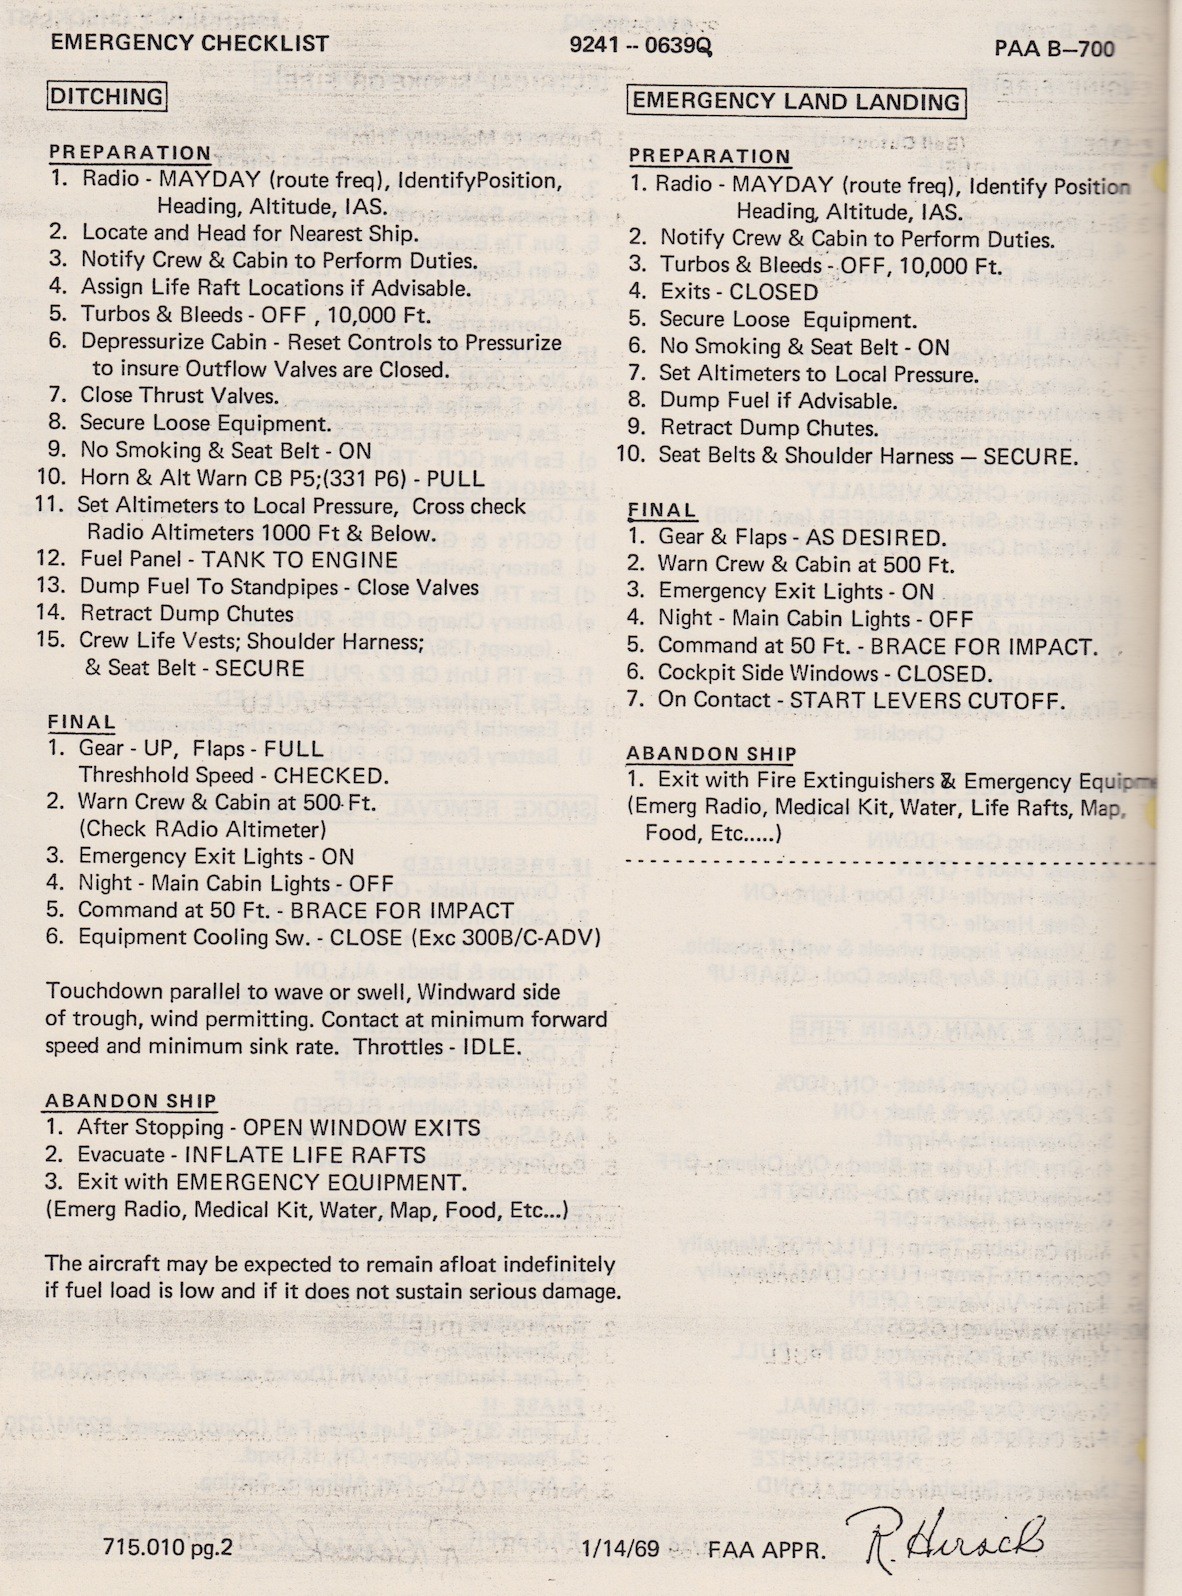
Getting started can be the hardest part. I developed the USE Method to teach others how to solve common performance issues quickly, without overlooking important areas. Like an emergency checklist in a flight manual, it is intended to be simple, straightforward, complete, and fast. The USE Method has been used successfully countless times in different enterprise environments, classroom environments (as a learning tool), and more recently in cloud computing environments.
The USE Method is based on three metric types and a strategy for approaching a complex system. I find it solves about 80% of server issues with 5% of the effort, and, as I will demonstrate, it can be applied to systems other than servers. It should be thought of as a tool, one that is part of larger toolbox of methodologies. There are many problem types it doesn't solve, which will require other methods and longer time spans.
Summary
The USE Method can be summarized as:
For every resource, check utilization, saturation, and errors.
It's intended to be used early in a performance investigation, to identify systemic bottlenecks.
Terminology definitions:
- resource: all physical server functional components (CPUs, disks, busses, ...) [1]
- utilization: the average time that the resource was busy servicing work [2]
- saturation: the degree to which the resource has extra work which it can't service, often queued
- errors: the count of error events
[1] It can be useful to consider some software resources as well, or software imposed limits (resource controls), and see which metrics are possible.
[2] There is another definition where utilization describes the proportion of a resource that is used, and so 100% utilization means no more work can be accepted, unlike with the "busy" definition above.
The metrics are usually expressed in the following terms:
- utilization: as a percent over a time interval. eg, "one disk is running at 90% utilization".
- saturation: as a queue length. eg, "the CPUs have an average run queue length of four".
- errors: scalar counts. eg, "this network interface has had fifty late collisions".
Errors should be investigated because they can degrade performance, and may not be immediately noticed when the failure mode is recoverable. This includes operations that fail and are retried, and devices from a pool of redundant devices that fail.
Does Low Utilization Mean No Saturation?
A burst of high utilization can cause saturation and performance issues, even though utilization is low when averaged over a long interval. This may be counter-intuitive!
I had an example where a customer had problems with CPU saturation (latency) even though their monitoring tools showed CPU utilization was never higher than 80%. The monitoring tool was reporting five minute averages, during which CPU utilization hit 100% for seconds at a time.
Resource List
To begin with, you need a list of resources to iterate through. Here is a generic list for servers:
- CPUs: sockets, cores, hardware threads (virtual CPUs)
- Memory: capacity
- Network interfaces
- Storage devices: I/O, capacity
- Controllers: storage, network cards
- Interconnects: CPUs, memory, I/O
Some components are two types of resources: storage devices are a service request resource (I/O) and also a capacity resource (population). Both types can become a system bottleneck. Request resources can be defined as queueing systems, which can queue and then service requests.
Some physical components have been left out, such as hardware caches (eg, MMU TLB/TSB, CPU). The USE Method is most effective for resources that suffer performance degradation under high utilization or saturation, leading to a bottleneck. Caches improve performance under high utilization.
Cache hit rates and other performance attributes can be checked after the USE Method - after systemic bottlenecks have been ruled out. If you are unsure whether to include a resource, include it, then see how well the metrics work.
Functional Block Diagram
Another way to iterate over resources is to find or draw a Functional Block Diagram for the system. These also show relationships, which can be very useful when looking for bottlenecks in the flow of data. Here is an example from the Sun Fire V480 Guide (page 82):
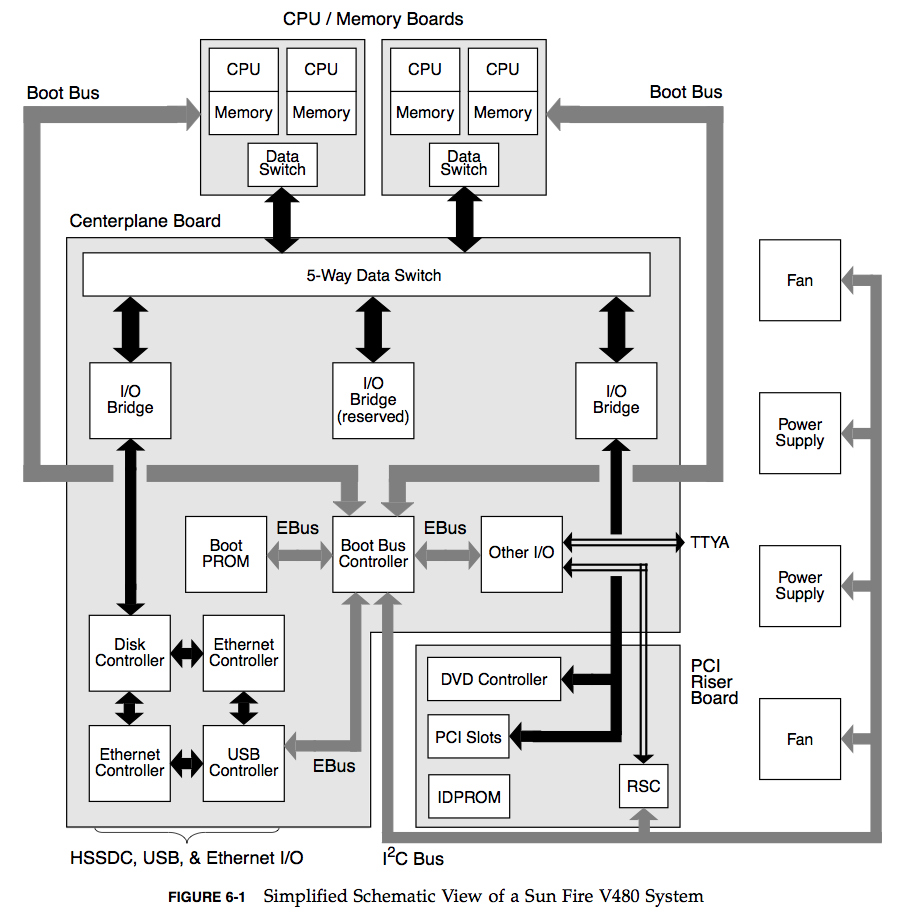
I love these diagrams, although they can be hard to come by. Hardware engineers can be the best resource – the people who actually build the things. Or you can try drawing your own.
While determining utilization for the various busses, annotate each bus on the functional diagram with its maximum bandwidth. This results in a diagram where systemic bottlenecks may be identified before a single measurement has been taken. (This is a useful exercise during hardware product design, when physical components can be changed.)
Interconnects
CPU, memory and I/O interconnects are often overlooked. Fortunately, they aren't commonly the system bottleneck. Unfortunately, if they are, it can be difficult to do much about (maybe you can upgrade the main board, or reduce load: eg, "zero copy" projects lighten memory bus load). With the USE Method, at least you become aware of what you weren't considering: interconnect performance. See Analyzing the HyperTransport for an example of an interconnect issue which I identified with the USE Method.
Metrics
Given the list of resources, consider the metric types: utilization, saturation and errors.
Here are some examples. In the table below, think about each resource and metric type, and see if you can fill in the blanks. Mousing over the empty cells will reveal some possible answers, described in generic Unix/Linux terms (you can be more specific):
| resource | type | metric |
|---|---|---|
| CPU | utilization | CPU utilization (either per-CPU or a system-wide average) |
| CPU | saturation | run-queue length or scheduler latency(aka |
| Memory capacity | utilization | available free memory (system-wide) |
| Memory capacity | saturation | anonymous paging or thread swapping (maybe "page scanning" too) |
| Network interface | utilization | RX/TX throughput / max bandwidth |
| Storage device I/O | utilization | device busy percent |
| Storage device I/O | saturation | wait queue length |
| Storage device I/O | errors | device errors ("soft", "hard", ...) |
Click here to reveal all. I've left off timing: these metrics are either averages per interval or counts. I've also left off how to fetch them: for your custom checklist, include which OS tool or monitoring software to use, and which statistic to read. For those metrics that aren't available, write "?". You will end up with a checklist that is easy and quick to follow, and is as complete as possible for your system.
Harder Metrics
Now for some harder combinations (again, try to think about these first!):
| resource | type | metric |
|---|---|---|
| CPU | errors | eg, correctable CPU cache ECC events or faulted CPUs (if the OS+HW supports that) |
| Memory capacity | errors | eg, failed malloc()s (although this is usually due to virtual memory exhaustion, not physical) |
| Network | saturation | saturation related NIC or OS events; eg "dropped", "overruns" |
| Storage controller | utilization | depends on the controller; it may have a max IOPS or throughput that can be checked vs current activity |
| CPU interconnect | utilization | per port throughput / max bandwidth (CPU performance counters) |
| Memory interconnect | saturation | memory stall cycles, high CPI (CPU performance counters) |
| I/O interconnect | utilization | bus throughput / max bandwidth (performance counters may exist on your HW; eg, Intel "uncore" events) |
Click here to reveal all. These typically get harder to measure, depending on the OS, and I often have to write my own software to do them (eg, the "amd64htcpu" script from Analyzing the HyperTransport).
Repeat for all combinations, and include instructions for fetching each metric. You'll end up with a list of about thirty metrics, some of which can't be measured, and some of which are tricky to measure. Fortunately, the most common issues are usually found with the easy ones (eg, CPU saturation, memory capacity saturation, network interface utilization, disk utilization), which can be checked first.
See the top of this page for the example checklists for Linux, Solaris, Mac OS X, FreeBSD, etc.
In Practice
Reading metrics for every combination on your OS can very time consuming, especially once you start working through bus and interconnect metrics. You may only have time to check a subset: CPUs, memory capacity, storage capacity, storage device I/O, network interfaces. This is better than it sounds! The USE Method has made you aware of what you didn't check: what were once unknown-unknowns are now known-unknowns. And for that time when it's vital for your company to root cause a performance issue, you already have a to-do list of known extra work that can be performed for more thorough analysis, completing the USE Method for when it's really needed.
It's hoped that the subset of metrics that are easy to check grows over time, as more metrics are added to OSes to make the USE Method easier. Performance monitoring software can also help, adding USE method wizards to do the work for you.
Software Resources
Some software resources can be considered in a similar way. This usually applies to smaller components of software, not entire applications. For example:
- mutex locks: utilization may be defined as the time the lock was held; saturation by those threads queued waiting on the lock.
- thread pools: utilization may be defined as the time threads were busy processing work; saturation by the number of requests waiting to be serviced by the thread pool.
- process/thread capacity: the system may have a limited number of processes or threads, the current usage of which may be defined as utilization; waiting on allocation may be saturation; and errors are when the allocation failed (eg, "cannot fork").
- file descriptor capacity: similar to the above, but for file descriptors.
Don't sweat this type. If the metrics work well, use them, otherwise software can be left to other methodologies (eg, latency).
Suggested Interpretations
The USE Method helps you identify which metrics to use. After learning how to read them from the operating system, your next task is to interpret their current values. For some, interpretation may be obvious (and well documented). Others, not so obvious, and may depend on workload requirements or expectations.
The following are some general suggestions for interpreting metric types:
- Utilization: 100% utilization is usually a sign of a bottleneck (check saturation and its effect to confirm). High utilization (eg, beyond 70%) can begin to be a problem for a couple of reasons:
- When utilization is measured over a relatively long time period (multiple seconds or minutes), a total utilization of, say, 70% can hide short bursts of 100% utilization.
- Some system resources, such as hard disks, cannot be interrupted during an operation, even for higher-priority work. Once their utilization is over 70%, queueing delays can become more frequent and noticeable. Compare this to CPUs, which can be interrupted ("preempted") at almost any moment.
- Saturation: any degree of saturation can be a problem (non-zero). This may be measured as the length of a wait queue, or time spent waiting on the queue.
- Errors: non-zero error counters are worth investigating, especially if they are still increasing while performance is poor.
It's easy to interpret the negative case: low utilization, no saturation, no errors. This is more useful than it sounds - narrowing down the scope of an investigation can quickly bring focus to the problem area.
Cloud Computing
In a cloud computing environment, software resource controls may be in place to limit or throttle tenants who are sharing one system. This can include hypervisor or container (cgroup) limits for memory, CPU, network, and storage I/O. External hardware may also impose limits, such as for network throughput. Each of these resource limits can be examined with the USE Method, similar to examining the physical resources.
For example, in our environment "memory capacity utilization" can be the tenant's memory usage vs its memory cap. "memory capacity saturation" can be seen by anonymous paging activity, even though the traditional Unix page scanner may be idle.
Strategy
The USE Method is pictured as a flowchart below. Note that errors can be checked before utilization and saturation, as a minor optimization (they are usually quicker and easier to interpret).
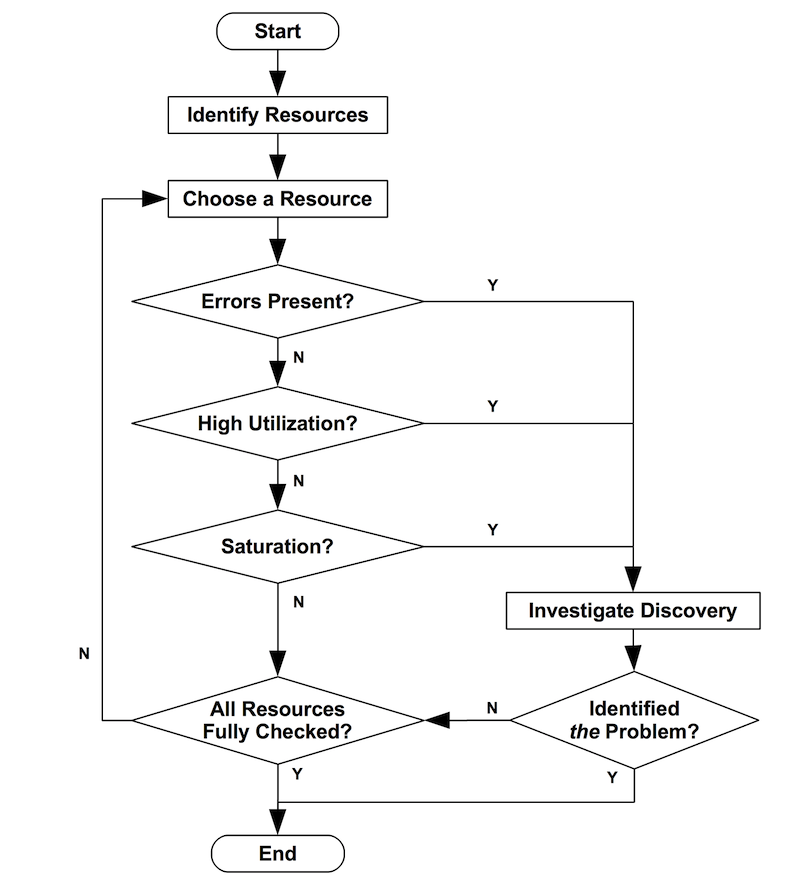
The USE Method identifies problems which are likely to be system bottlenecks. Unfortunately, systems can be suffering more than one performance problem, and so the first one you find may be a problem but not the problem. Each discovery can be investigated using further methodologies, before continuing the USE Method as needed to iterate over more resources.
Strategies for further analysis include workload characterization and drill-down analysis. After completing these (if needed), you should have evidence for whether the corrective action is to adjust the load applied or to tune the resource itself.
Apollo
I said earlier that the USE Method could be applied beyond servers. Looking for a fun example, I thought of a system in which I have no expertise at all, and no idea where to start: the Apollo Lunar Module guidance system. The USE Method provides a simple procedure to try.
The first step is to find a list of resources, or better still, a functional block diagram. I found the following in the "Lunar Module - LM10 Through LM14 Familiarization Manual" (1969):
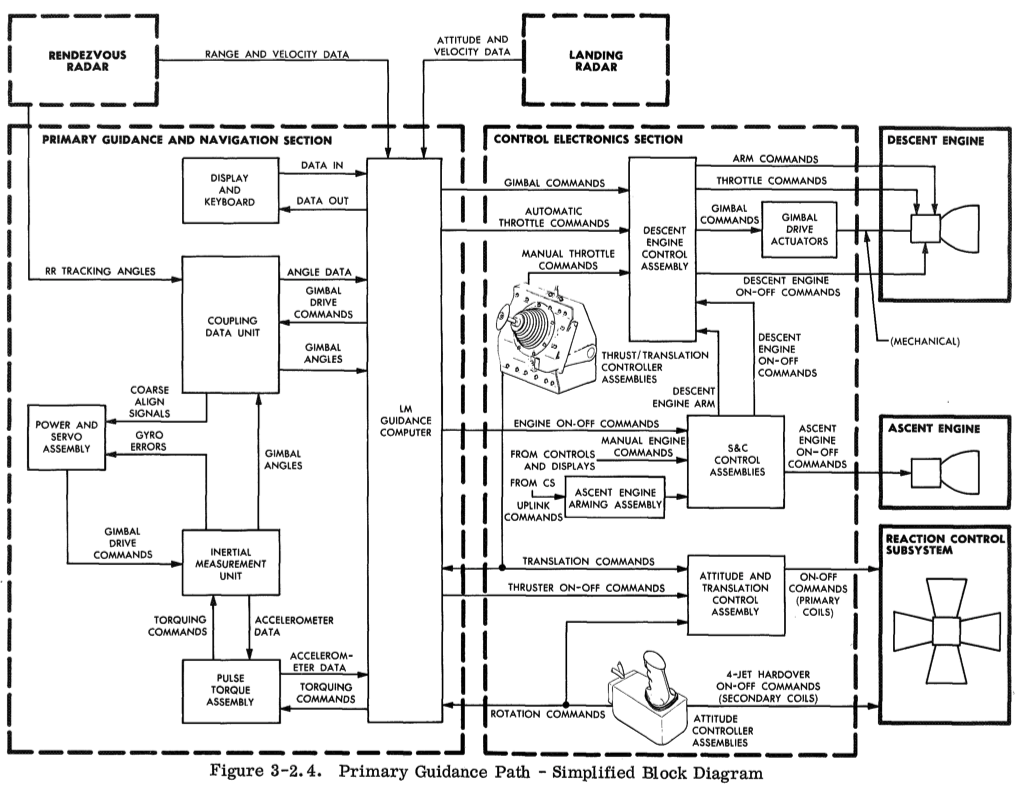
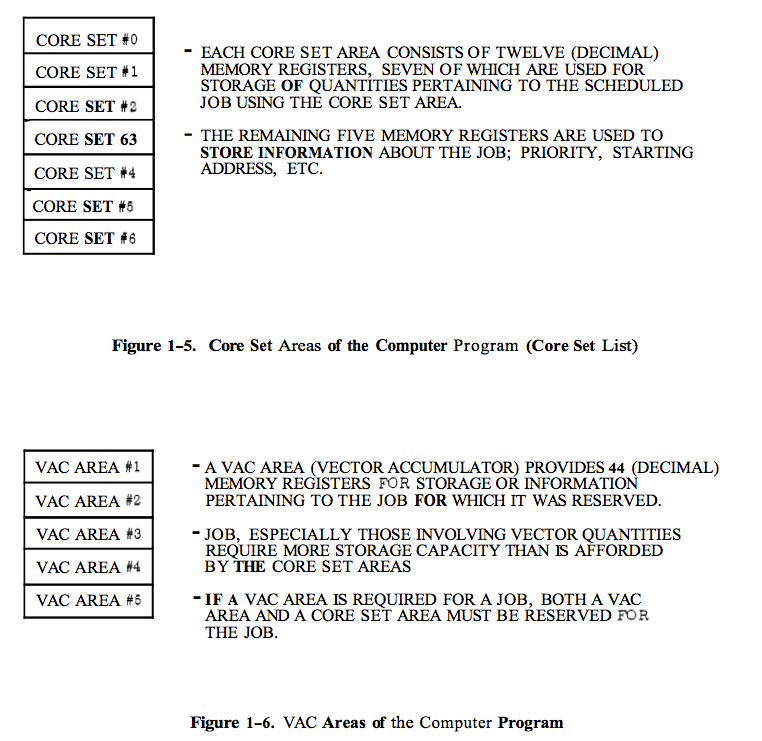
Some of these components may not exhibit utilization or saturation characteristics. After iterating through them, this can be redrawn to only include relevant components. (I'd also include more: the "erasable storage" section of memory, the "core set area" and "vac area" registers.)
I'll start with the Apollo guidance computer (AGC) itself. For each metric, I browsed various LM docs to see what might make sense:
- AGC utilization: This could be defined as the number of CPU cycles doing jobs (not the "DUMMY JOB") divided by the clock rate (2.048 MHz). This metric appears to have been well understood at the time.
- AGC saturation: This could be defined as the number of jobs in the "core set area", which are seven sets of registers to store program state. These allow a job to be suspended (by the "EXECUTIVE" program - what we'd call a "kernel" these days) if an interrupt for a higher priority job arrives. Once exhausted, this moves from a saturation state to an error state, and the AGC reports a 1202 "EXECUTIVE OVERFLOW-NO CORE SETS" alarm.
- AGC errors: Many alarms are defined. Apart from 1202, there is also a 1203 alarm "WAITLIST OVERFLOW-TOO MANY TASKS", which is a performance issue of a different type: too many timed tasks are being processed before returning to normal job scheduling. As with 1202, it could be useful to define a saturation metric that was the length of the WAITLIST, so that saturation can be measured before the overflow and error occurs.
Some of these details may be familiar to space ethusiasts: 1201 ("NO VAC AREAS") and 1202 alarms famously occurred during the Apollo 11 descent. ("VAC" is short for "vector accumulator", extra storage for jobs that process vector quantities; I think wikipedia's description as "vacant" may be incorrect).
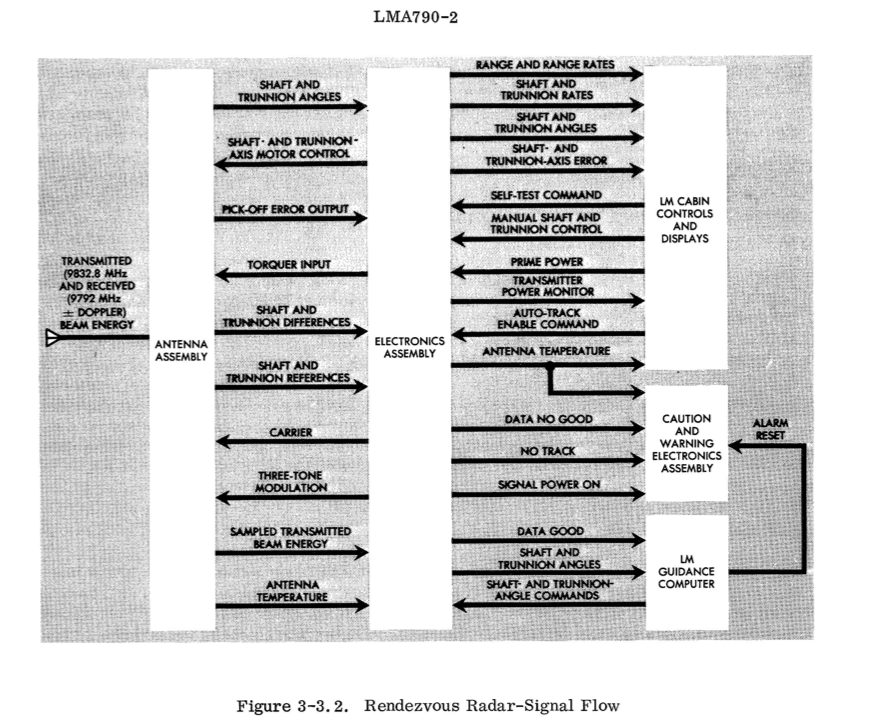
Given Apollo 11's 1201 alarm, analysis can continue using other methodologies, such as workload characterization. The workload is mostly applied via interrupts, many of which can be seen in the functional diagram. This includes the rendezvous radar, used to track the Command Module, which was interrupting the AGC with work even though the LM was performing descent. This is an example of finding unnecessary work (or low priority work; some updates from the radar may have been desirable so that the LM AGC could immediately calculate an abort trajectory and CM rendezvous if needed).
As a harder example, I'll examine the rendezvous radar as a resource. Errors are the easiest to identify. There are three types: "DATA NO GOOD", "NO TRACK", and "SHAFT- AND TRUNNION-AXIS ERROR" signals. Utilization is harder: one type may be utilization of the drive motors - defined as the time they were busy responding to angle commands (seen in the functional diagram via the "COUPLING DATA UNIT"). I'll need to read the LM docs more to see if there saturation characteristics either with the drive motors or with the returned radar data.
In a short amount of time, using this methodology, I've gone from having no idea where to start, to having specific metrics to look for and research.
Other Methodologies
While the USE Method may find 80% of server issues, latency-based methodologies (eg, Method R) can approach finding 100% of all issues. However, these can take much more time if you are unfamiliar with software internals. They may be more suited for database administrators or application developers, who already have this familiarity. The USE Method is more suited for junior or senior system administrators, whose responsibility and expertise includes the operating system (OS) and hardware. It can also be employed by these other staff when a quick check of system health is desired.
Tools Method
For comparison with the USE Method, I'll describe a tools-based approach (I'll call this "Tools Method"):
- List available performance tools (optionally install or purchase more).
- For each tool, list useful metrics it provides.
- For each metric, list possible interpretation rules.
The result of this is a prescriptive checklist showing which tool to run, which metrics to read, and how to interpret them. While this can be fairly effective, one problem is that it relies exclusively on available (or known) tools, which can provide an incomplete view of the system. The user is also unaware that they have an incomplete view - and so the problem will remain.
The USE Method, instead, iterates over the system resources to create a complete list of questions to ask, then searches for tools to answer them. A more complete view is constructed, and unknown areas are documented and their existence known ("known unknowns"). Based on USE, a similar checklist can be developed showing which tool to run (where available), which metric to read, and how to interpret it.
Another problem can be when iterating through a large number of tools distracts from the goal - to find bottlenecks. The USE Method provides a strategy to find bottlenecks and errors efficiently, even with an unwieldy number of available tools and metrics.
Conclusion
The USE Method is a simple strategy you can use to perform a complete a check of system health, identifying common bottlenecks and errors. It can be deployed early in the investigation and quickly identify problem areas, which then can be studied in more detail other methodologies, if need be. The strength of USE is its speed and visibility: by considering all resources, you are unlikely to overlook any issues. It will, however, only find certain types of issues – bottlenecks and errors – and should be considered as one tool in a larger toolbox.
I explained the USE Method on this page and provided generic examples of metrics. See the example checklists in the left navigation pane for specific operating systems, where tools and metrics to apply the USE Method are suggested.
Also see the complementary thread-based methodology, the TSA Method.
Acknowledgments
- "Optimizing Oracle Performance" by Cary Millsap and Jeff Holt (2003) describes Method R (and other methodologies), which reminded me recently that I should write this methodology down.
- The groups at Sun Microsystems, including PAE and ISV, who helped apply the USE Method (before it was named) to the storage appliance series. We drew ASCII functional block diagrams annotated with metric names and bus speeds – these were harder to construct than you would think (we should have asked the hardware teams for help sooner).
- My students from performance classes several years ago, to whom I taught this methodology and who provided feedback.
- The Virtual AGC project, which became a fun distraction as I read through their document library, hosted by ibiblio.org. In particular was the LMA790-2 "Lunar Module LM-10 Through LM-14 Vehicle Familiarization Manual" (page 48 has the functional block diagram), and the "Apollo Guidance and Navigation Lunar Module Student Study Guide", which has a good explanation of the EXECUTIVE program including flow charts. (These docs are 109 and 9 Mbytes in size.)
- Deirdré Straughan for edits and feedback, improving my explanations.
- The image at the top of this post is from a Boeing 707 flight manual, printed in 1969. This is (of course) obsolete and shouldn't be used for reference. If you click it you get the full page.
Updates
USE Method updates:
- It was published in ACMQ as Thinking Methodically about Performance (2012).
- It was also published in Communications of the ACM as Thinking Methodically about Performance (2013).
- I presented it in the FISL13 talk The USE Method (2012).
- I spoke about it at Oaktable World 2012: video, PDF.
- I included it in the USENIX LISA `12 talk Performance Analysis Methodology.
- It is covered in my book on Systems Performance, published by Prentice Hall (2013).
More updates (Apr 2014):
- LuceraHQ are implementing USE Method metrics on SmartOS for performance monitoring of their high performance financial cloud.
- I spoke about the USE Method for OS X at MacIT 2014 (slides).
More updates (Aug 2017):
- Heinrich Hartmann posted System Monitoring with the USE Dashboard, showing how a USE method dashboard has been implemented by the Circonus monitoring product.