

DTraceToolkit
The DTraceToolkit is a collection of useful documented DTrace scripts, some of which originated from my original page on DTrace Tools. There are over 200 scripts in the DTraceToolkit, and each has a man page and an file of example output.
Note: This page was last updated in 2015 and is no longer maintained. It is now part of my Crypt, and the DTraceToolkit code is now in github.com/opendtrace/toolkit.
Download the latest toolkit here:
After downloading:
- gunzip and "tar xvf" the file. cd to the toolkit directory
- Run ./install (optional, you can use the toolkit without doing this)
- Read Guide to find out how to get started
- A list of scripts is in Docs/Contents
- Enjoy!
Also see the Examples/* files for sample screenshots and descriptions.
On this page: About, Updates, Operating Systems, Contents, Related Content, Other Scripts.
About
The DTraceToolkit was a spare time project of mine I started in 2005, which was provided with no warranties or support. The scripts were intended to help users solve performance and troubleshooting issues without needing to learn DTrace, and for users who wanted to, the scripts also served as examples of DTrace to learn from. The toolkit has succeeded with these aims, and I've received thanks from many companies who have been using it. The DTraceToolkit's scripts have also been included in other products, including some versions of Mac OS X.
Updates

The DTraceToolkit is out of date, now that I've developed many new scripts for the DTrace book. Those scripts can be browsed on www.dtracebook.com and also downloaded as a tarball.
Specific DTraceToolkit updates:
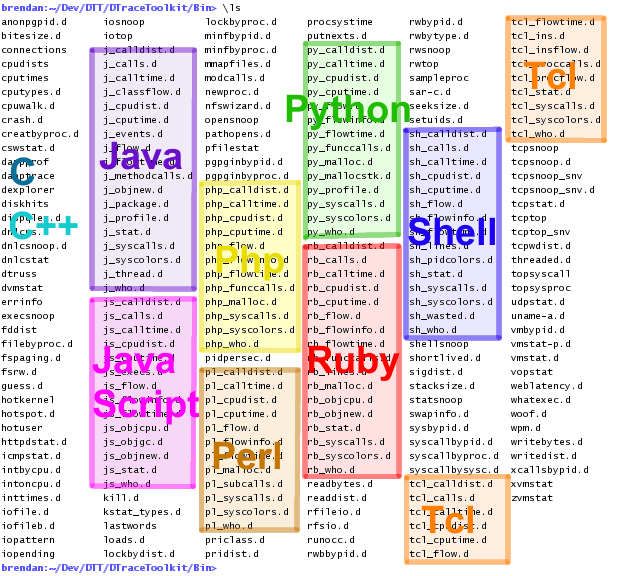
- 05-Oct-2007: DTraceToolkit 0.99 added many scripts to demonstrate basic tracing of different languages.
- 05-Sep-2013: I wrote about DTraceToolkit 0.xx mistakes, and how I can learn from them to continue development.
- 15-May-2015: The DTraceToolkit Project Has Ended, although its scripts live on...
- 30-Jun-2016: It is now being updated by the FreeBSD folk at github.com/opendtrace/toolkit.
In 2012, I developed new DTrace-based tools for the Solaris/illumos cloud computing environment (zones/containers): the dtrace-cloud-tools collection (includes some repeats). These are my last scripts for Solaris/illumos.
My spare time has recently been spent porting my DTraceToolkit scripts to Linux. One example of this is my perf-tools collection (for ftrace and perf_events). I think the most recent updates to DTraceToolkit scripts was done by Oracle for their inclusion in Oracle Solaris 11.
I'm not anticipating updating the DTraceToolkit project again (see the 2015 blog post). I'm still doing some DTrace work, on FreeBSD, and sharing those scripts online.
Operating Systems
This was originally written for the Solaris family of operating systems, as those were the only ones with DTrace at the time.
If you are on Mac OS X, you'll probably find dozens of these scripts have been ported (and sometimes improved) by the Apple engineers and are shipped by default in /usr/bin. You should use these versions instead. Try "man -k dtrace":
macosx# man -k dtrace
bitesize.d(1m)           - analyse disk I/O size by process. Uses DTrace
cpuwalk.d(1m)            - Measure which CPUs a process runs on. Uses DTrace
creatbyproc.d(1m)        - snoop creat()s by process name. Uses DTrace
dappprof(1m)             - profile user and lib function usage. Uses DTrace
dapptrace(1m)            - trace user and library function usage. Uses DTrace
diskhits(1m)             - disk access by file offset. Uses DTrace
dispqlen.d(1m)           - dispatcher queue length by CPU. Uses DTrace
dtrace(1)                - generic front-end to the DTrace facility
dtruss(1m)               - process syscall details. Uses DTrace
errinfo(1m)              - print errno for syscall fails. Uses DTrace
execsnoop(1m)            - snoop new process execution. Uses DTrace
[...]
Some scripts have begun to be ported to FreeBSD as well.
This has not been tested on the DTrace for Linux ports yet - and many of the scripts probably need adjusting for OS differences (scripts that are entirely stable provider-based should just work!). Once the ports have enough stability, I'll port scripts over.
Contents
This is from the Docs/Contents file shipped with the DTraceToolkit version 0.99, which lists the scripts in the toolkit. Generally those that end in a ".d" are DTrace scripts, and those that don't are DTrace scripts wrapped in another language (eg, shell or Perl). See the Docs/Readme for instructions for finding their docs.
DTraceToolkit/
   dexplorer		run a series of scripts and archive output
   dtruss		process syscall info. DTrace truss
   dvmstat		vmstat by PID/name/command
   errinfo		report syscall failures with details
   execsnoop		snoop process execution as it occurs
   iosnoop		snoop I/O events as they occur
   iopattern		print disk I/O pattern
   iotop		display top disk I/O events by process
   opensnoop		snoop file opens as they occur
   procsystime		analyse process system call times
   rwsnoop		snoop read/write events
   rwtop		display top read/write bytes by process
   statsnoop		snoop file stats as they occur
   Apps/
	httpdstat.d	realtime httpd statistics
	nfswizard.d	NFS client activity wizard
	shellsnoop	snoop live shell activity
	weblatency.d	website latency statistics
   Cpu/
	cputypes.d	list CPU types
	cpuwalk.d	measure which CPUs a process runs on
	dispqlen.d	dispatcher queue length by CPU
	intbycpu.d	interrupts by CPU
	intoncpu.d	interrput on-cpu usage
	inttimes.d	interrput on-cpu time total
	loads.d		print load averages
	runocc.d	run queue occupancy by CPU
	xcallsbypid.d	CPU cross calls by PID
   Disk/
	bitesize.d	print disk event size report
	diskhits	disk access by file offset
	hotspot.d	print disk event by location
	iofile.d	I/O wait time by filename and process
	iofileb.d	I/O bytes by filename and process
	iopending	plot number of pending disk events
	pathopens.d	pathnames successfully opened count
	seeksize.d	print disk seek size report
   Docs/
	oneliners.txt	DTrace oneliners
   FS/
	fsrw.d		file system read/write event tracing
	fspaging.d	file system read/write and paging tracing
	rfsio.d		read FS I/O stats, with cache miss rate
	rfileio.d	read file I/O stats, with cache miss rate
	vopstat		vnode interface statistics
   Java/
	j_*.d		18 scripts for tracing Java using the hotspot provider
   JavaScript/
	js_*.d		14 scripts for JavaScript with the Mozilla provider
   Kernel/
	cputimes	print time by Kernel/Idle/Process
	cpudists	time distribution by Kernel/Idle/Process
	cswstat.d	context switch time statistics
	dnlcps.d	DNLC stats by process
	dnlcsnoop.d	snoop DNLC activity
	dnlcstat	DNLC statistics
	kstat_types.d	trace kstat reads with type info
	modcalls.d	kernel function calls by module name
	priclass.d	priority distribution by scheduling class
	pridist.d	process priority distribution
	putnexts.d	trace who is putting to which streams module
	whatexec.d	examine the type of files executed
   Locks/
	lockbyproc.d	lock time by process name
	lockbydist.d	lock time distribution by process name
   Mem/
	anonpgpid.d	anonymous memory paging info by PID on CPU
	minfbypid.d	minor faults by PID
	minfbyproc.d	minor faults by process name
	pgpginbypid.d	pages paged in by PID
	pgpginbyproc.d	pages paged in by process name
	swapinfo.d	print virtual memory info
	vmbypid.d	virtual memory stats by PID
	vmstat.d	vmstat demo using DTrace
	vmstat-p.d	vmstat -p demo using DTrace
	xvmstat		extended vmstat demo using DTrace
   Misc/
	guess.d		guessing game
	wpm.d		words per minute tracing
	woof.d		audio alert for new processes
   Net/
	connections	print inbound TCP connections by process
	icmpstat.d	print ICMP statistics
	tcpsnoop	snoop TCP network packets by process, Solaris 10 3/05
	tcpsnoop_snv	snoop TCP network packets by process, Solaris Nevada
	tcpsnoop.d	snoop TCP network packets by process, Solaris 10 3/05
	tcpsnoop_snv.d	snoop TCP network packets by process, Solaris Nevada
	tcpstat.d	print TCP statistics
	tcptop		display top TCP network packets by PID, Solaris 10 3/05
	tcptop_snv	display top TCP network packets by PID, Solaris Nevada
	tcpwdist.d	simple TCP write distribution by process
	udpstat.d	print UDP statistics
   Perl/
	pl_*.d		12 scripts for tracing Perl
   Php/
	php_*.d		12 scripts for tracing Php
   Proc/
	crash.d		crashed application report
	creatbyproc.d	snoop file creat() by process name
	dappprof	profile user and lib function usage
	dapptrace	trace user and lib function usage
	fddist		file descriptor usage distribution
	fileproc.d	snoop files opened by process
	kill.d		snoop process signals
	lastwords	print syscalls before exit
	mmapfiles.d	mmap'd files by process
	newproc.d	snoop new processes
	pfilestat	show I/O latency break down by FD
	pidpersec.d	print new PIDs per sec
	readbytes.d	read bytes by process name
	readdist.d	read distribution by process name
	rwbbypid.d	read/write bytes by PID
	rwbypid.d	read/write calls by PID
	rwbytype.d	read/write bytes by vnode type
	sampleproc	sample processes on the CPUs
	shortlived.d	check short lived process time
	sigdist.d	signal distribution by process name
	stacksize.d	measure stack size for running threads
	sysbypid.d	system stats by PID
	syscallbyproc.d	system calls by process name
	syscallbypid.d	system calls by process ID
	threaded.d	sample multi-threaded CPU usage
	topsysproc	display top syscalls by process name
	writebytes.d	write bytes by process name
	writedist.d	write distribution by process name
   Python/
	py_*.d		14 scripts for tracing Python
   Shell/
	sh_*.d		15 scripts for tracing the Bourne shell
   System/
	sar-c.d		sar -c demo using DTrace
	syscallbysysc.d	system calls by system call
	topsyscall	display top system call type
	uname-a.d	uname -a demo using DTrace
   Tcl/
	tcl_*.d		15 scripts for tracing Tcl
   User/
	setuids.d	snoop setuid calls
   Zones/
	zvmstat		vmstat info by zone

Total: 230 scripts
Some original versions of these scripts are on the remainder of this page. Updating and adding to this page became a nuisance, which is one of the reasons I rolled this up and made a toolkit.
Related Content
- The DTraceToolkit page on solarisinternals.com.
- My DTrace Topics: DTraceToolkit presentation slides (PDF) from 2007.
- Stefan Parvu's DTrace and DTraceToolkit presentation slides (PDF), 2007.
- My unfinished DTraceToolkit style guide.
Other DTrace Scripts
- DTrace book - scripts from the DTrace book.
- DTrace Tools - my original page of DTrace Tools, from 2004.
- Solaris Internals - DTrace scripts by Richard McDougall.