The TSA Method
There are two basic performance analysis methodologies you can use for most performance issues. The first is the resource-oriented USE Method, which provides a checklist for identifying common bottlenecks and errors. The second is the thread-oriented TSA Method, for identifying issues causing poor thread performance. I summarized the TSA Method in my Stop The Guessing talk at Velocity conf this year, and it is also covered in the Applications chapter of my Systems Performance book.
The TSA Method is complementary to the USE Method as it has a different perspective: threads instead of resources. Like the USE Method, it provides a starting point for analysis, and then narrows the investigation to the problem area. It can also be applied to any OS, as it is developed from the questions we'd like like answered: where is each thread spending its time?
I've taught this method in recent systems performance classes, where it has helped my students – mostly system administrators – to quickly solve a range of issues. I've also been using it for years, in both enterprise and cloud production environments, where it has solved countless performance issues.
|
Table of contents: 1. Summary 2. Usage 3. Time Spent 4. States 5. 6 State TSA 6. Idle State 7. Other States 8. Latency States 9. Example: Solaris 10. Example: RSTS 11. Non TS 12. Conclusion 13. Acks 14. Updates |
TSA Checklists: Linux Solaris |
Summary
The Thread State Analysis (TSA) Method can be summarized as:
1. For each thread of interest, measure total time in different thread states.
2. Investigate states from the most to the least frequent, using appropriate tools.
I use the term "thread" to denote an operating system runnable entity, which may be a thread, task, or process. The threads of interest may be application threads or kernel threads.
Thread time is divided into several exclusive states. The following set of six are based on a generic operating system kernel, and have been chosen to identify key sources of performance issues:
- Executing: on-CPU
- Runnable: and waiting for a turn on-CPU
- Anonymous Paging: (aka swapping) runnable, but blocked waiting for residency
- Sleeping: waiting for I/O, including network, block, and data/text page-ins
- Lock: waiting to acquire a synchronization lock (waiting on someone else)
- Idle: waiting for work
These can then be adjusted for your OS, depending on the tools it provides for measurement and analysis. Some additional states may also be added, if the OS provides them easily and they are useful, and the number of states remains small enough to be practically applied.
In preparing to use the TSA method, you can identify the set of states to measure for your OS, document the OS tools available to measure them, and how to further analysis each state. This can be shared with your team, providing everyone with a short procedure for analyzing performance issues. In a moment I'll provide a summary of this for Solaris as an example.
Example Usage
The following short example describes a common performance issue in cloud computing, and how the TSA Method provides a starting point and then direction for further investigation.
An application has a performance issue. Following the TSA Method, thread state time is measured for the application threads, in each of the six states. About 50% of their time is in the Runnable state: waiting for a turn on-CPU. Tools for investigating that state are now used, including mpstat(1) to see if the CPUs are overloaded, and specific tools for checking CPU resource controls. It is quickly found that the application is throttled by a CPU limit, which is normally present in this cloud computing environment. The CPU limit is increased, and performance is resolved.
Where Time Is Really Spent
Some monitoring software provide a breakdown of time by application component, with metrics for "time spent in MySQL", "time spent in PHP", and so on. This usually measures time from when the application component began servicing work, to when it completed. Instead of being thread-oriented, this approach is request-oriented, breaking down the request time into the application components involved. This approach can also be misleading, but can be clarified by using the TSA Method to investigate each component.
For example, to better understand "time spent in MySQL", use the TSA Method to examine MySQL threads. You may find that MySQL is spending significant time in the Runnable state, due to another application or tenant that is stealing CPU cycles. Reporting this as "time spent in MySQL" is misleading: this is not time spent executing MySQL, instead, it may be time spent in another application or tenant entirely. The TSA Method can save time that would otherwise be wasted with a misdirected investigation, and can also solve problems that may have remained unsolved.
State Transition Diagram
The six states introduced earlier are inspired by the Unix process state transition diagram [Bach 86]. A similar thread state diagram is shown here, with the six states highlighted:

This can be applied to all application threads, or kernel threads of interest.
6 State TSA Method
Here is the six state breakdown in detail, which should be applicable to most operating systems. This table includes suggestions for how to investigate each state:
| State | Description | Investigate |
|---|---|---|
| Executing | Running on-CPU | Split into user and system time. For user time, use CPU profilers to identify hot code paths. For system time, examine syscall rates, and profile kernel CPU time. Profiling can include Flame Graphs. Note that CPU time can include spinning on a lock. |
| Runnable | Run queue latency | Check system-wide CPU utilization and saturation, for both physical CPUs and any imposed resource controls (eg, USE Method). Check for any processor binding, which can affect CPU scheduling. |
| Anonymous Paging | Runnable, but either swapped-out or paged-out, and waiting for residency | Check system-wide main memory availability. Also check for any resource control limiting memory usage. Saturation metrics can be studied: paging and swapping (eg, following the USE Method). |
| Sleeping | Waiting for I/O, including network, block, and data/text page-ins | Check syscalls, resource usage, thread blocking. Syscalls: identify time in syscalls and identify the related resource; also check for mmap() usage and non-syscall I/O via mappings. Resource usage: eg, the USE Method to identify busy resources. Thread blocking: trace scheduler off-CPU events with user and kernel stacks to identify reason; see Off-CPU Performance Analysis. |
| Lock | Waiting to acquire a synchronization lock (waiting on someone else) | Identify the lock the thread is waiting on, and the reason it took time to acquire. Lock analysis. |
| Idle | Waiting for work | Check the client load applied. |
Terminology:
- Anonymous Paging: Paging is the movement of pages: small units of memory (eg, 4 Kbytes). The term anonymous refers to it being working memory, and having no named location in a file system. Linux calls this type of paging "swapping" (which means something else on other OSes).
- Sleeping: This state is for when threads leave CPU to wait for an event. The term is from Unix, however, for the 6 state TSA Method we've separated out Lock and Idle states from the Sleep state.
Operating system kernels manage most of these states directly. This means there are code paths that can be instrumented – if they aren't already – providing state timing information for any thread.
The Idle State
In operating systems of today, there is usually no easy way to identify the Idle state. Applications threads wait for work in various ways, including waiting for a new network connection, network I/O, a lock, or a timer. From the kernel's perspective, the application thread is in the Sleeping or Lock state. After some analysis, you will see that the time is really Idle time.
Identifying the Idle state can be difficult.
In many cases, the Idle state can be skipped in analysis, even though it is the most common state. An application may have a performance issue while it is processing requests 10% of the time, and be Idle 90% of the time. For the TSA Method, the next most common states should be investigated, after Idle.
Adding Other States
It may be tempting to add more states to narrow the initial investigation further. Here are some suggestions for further subdivision:
- Executing: This could be split into User and System (kernel) execution.
- Sleeping: Could be split into Storage, Network, and Other wait states.
It's a little difficult to implement, but it is tempting to split out Memory wait from the Execution state. ie, memory stall cycles, leaving the Execution state as a measure of non-stalled instruction cycles.
Check what thread states your OS currently provides, how they can be used, and if any additional states are useful to include. For example, Mac OS X provides various thread states in Instruments (based on DTrace), including "Waiting" and "Waiting uninterruptibly".
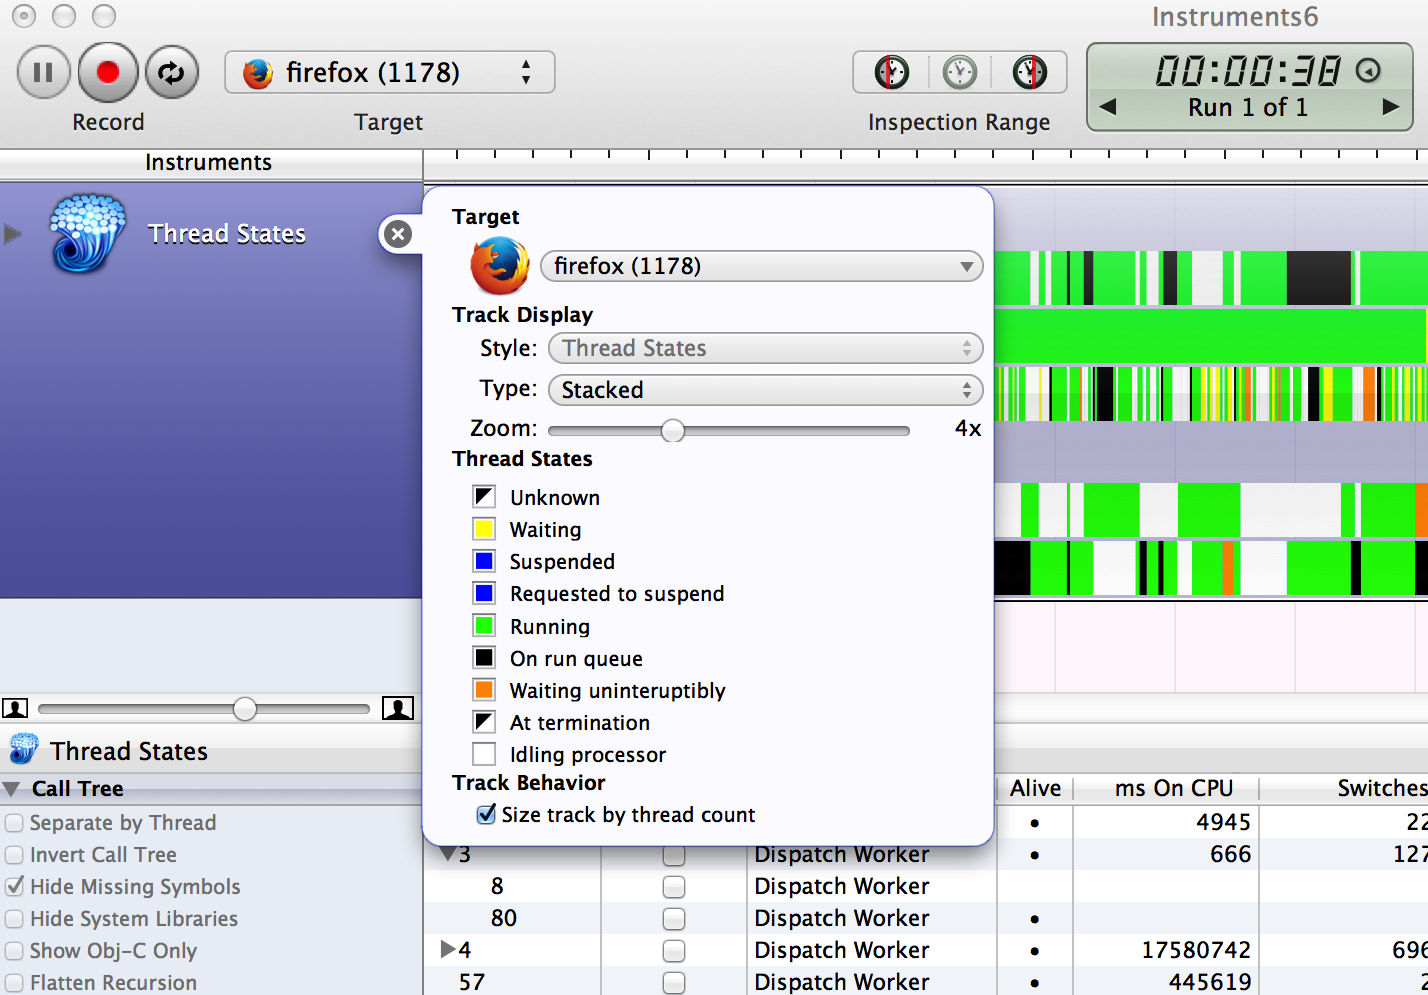
In practice, the six state approach described earlier is an effective first-level breakdown for the TSA Method. These states can be naturally subdivided as needed during the course of an investigation.
Latency States
The Runnable, Anonymous Paging, Sleeping, and Lock states measure time spent waiting while performing work: a measure of latency. Tuning these latency states often provides the greatest wins, as their state time can be reduced to zero. They may also provide the easiest wins, depending on the tools the OS provides to analyze them.
For these reasons, if I see more than 10% of time in either Runnable or Anonymous Paging, I usually start by tuning and eliminating those states first. This can simplify analysis of the remaining states, as there are fewer factors at play.
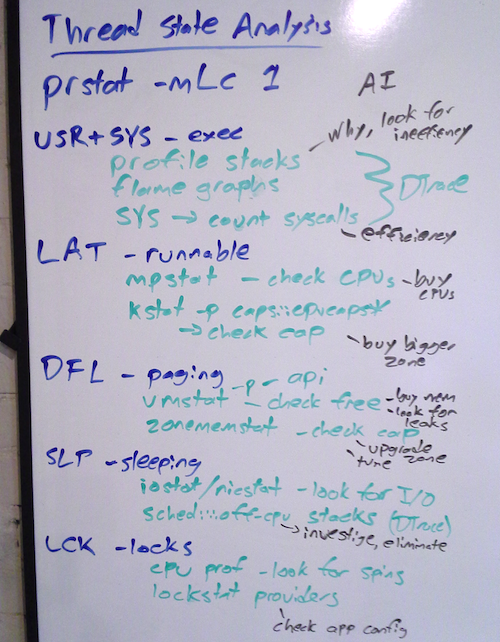
Example TSA Method: Solaris
These are summarized instructions for applying the TSA Method to the Solaris family of operating systems. Solaris has microstate accounting, which divides thread time into 10 states, with high-resolution time counters for each. This already does most of the work for the 6 state TSA Method, and makes for a short example. I'll create follow-ups for other OSes, such as Linux, where this currently requires more work.
We can begin by running prstat -mLc 1. prstat(1M) is a top-like tool on Solaris, and this invocation uses microstate accounting (-m), per-thread statistics (-L for light weight processes, an anachronism), doesn't clear the screen (-c, a personal preference), and an interval of 1 second. If desired, prstat(1M) can also target a single process with -p PID.
For each state, tools to investigate them are included in this summary, along with the kinds of actions that may be performed to improve performance:

This prstat(1M) output shows 63% Execution time (35 + 28), 22% Anonymous Paging, and 16% Sleep. These states could then be investigated in that order, using the tools described here.
Given that Anonymous Paging is usually quick to analyze and solve, I'd be tempted to fix that first, then rerun prstat(1M) to see how performance then looks. Anonymous Paging is often an application misconfig, where it has grown to exceed main memory, and the OS starts to page it out. The fix is often to edit the application config file and restart.
Understanding the Execution time is usually easy with Flame Graphs, which can be created for both the user time and system time.
The 16% Sleep time may include the Idle state. DTrace for Off-CPU Analysis, showing stack traces and off-CPU durations. These can be made into Flame Graphs, too (eg PDF). Splitting out the Idle state requires reading these stacks and identifying those that have occurred during the processing of work, and those which occur when the thread is idle waiting for new work. This often isn't easy, as it involves understanding a little application internals, but it is doable.
16 States of RSTS/E
While the microstate accounting feature was developed by Sun Microsystems for Solaris 8 (circa 2000), the notion of thread states dates back much earlier. The TENEX operating system, circa 1969-72, supported Control-T for printing the current job state (thread state) and other details [Bobrow 72]. This was implemented by its RUNSTAT command, which could identify about a dozen states, including: "RUNNING", "IO WAIT", "SLEEP", and "FORK WAIT".
RSTS/E, another DEC operating system from the 1970's, eventually added Control-T and a larger breakdown of job states. This is from the RSTS/E System User's Guide, 1985, page 4-5:

Having separate states for different I/O devices is certainly food for thought, although it may be unwieldy to use so many states for the TSA Method. I'll discuss this breakdown more later.
Note that while the states were known, I don't think the kernel tracked cumulative state times, as microstate accounting does. To actually perform the TSA Method on these older OSes, one would need a way to profile (sample) the thread state.
Non Time-Shared
On the topic of older computers... The states described earlier are intended for time-shared operating systems (Unix, Linux, Windows, etc). If you'd like to apply this to, say, a UNIVAC, then the states will need to be rethought. For example, the computer may always be executing the same program, and enter I/O wait during the execution of instructions. In this case, Sleeping on I/O wait is not exclusive from the Execution state, without some redefinition of those state types.
Conclusion
The TSA Method is a simple approach for analyzing per-thread performance, providing a starting point and then a direction for analysis. This can be deployed early in an investigation, along with the USE Method, to get an initial handle on performance. The TSA Method involves choosing useful thread states for dividing thread time, then determining which OS tools can measure the states, and which OS tools can investigate each state further.
On this page, I explained the TSA Method and provided a generic six state breakdown. I also provided an example of how the TSA Method could be applied to an operating system, using Solaris as the target. I'll follow up by developing specific instructions for applying the TSA Method to other OSes.
References and Acknowledgements
- [Bobrow 72] Bobrow, D., et al, TENEX, A Paged Time Sharing System for the PDP-10*, Communications of the ACM, March 1972
- TENEX Executive Language Manual For Users, 1973
- RSTS/E System User's Guide, 1985
- [Bach 86] Bach, M.J., The Design of the UNIX Operating System, Prentice Hall, 1986
- Thanks to whoever at Sun added microstate accounting, which was the inspiration for this methodology. prstat -mLc 1 has been the go-to tool for so many wins, it really got me thinking about generalizing this so that it can be taught to others, and used on other OSes.
- Flame Graphs for analyzing the Execution state and more.
- Off-CPU Analysis can be used to analyze Sleeping, Lock, Runnable, and Anonymous Paging. Note that applications do not choose to enter the Runnable and Anonymous Paging states, so the user-level stack won't identify them, but the kernel-level stack will.
- [Millsap 03] Millsap, C., Holt, J., Optimizing Oracle Performance, O'Reilly, 2003. This includes Method R, which motivated me to document systems performance methodologies. The TSA Method is not dissimilar to Method R and the notion of the Oracle Wait Interface, breaking a query down into states. Here we're breaking a thread down into OS states.
- [Gregg 13] Gregg, B., Systems Performance: Enterprise and the Cloud, Prentice Hall, 2013. Writing this book first prompted me to (finally) document the TSA Method, in the Application chapter.
- Bill's comment on an earlier article, which led me to the 1985 RSTS/E manual.
- Thanks Nate Fitch for the classroom photo.
- Deirdré Straughan organized the systems performance classes I've been teaching recently, giving me the opportunity to teach and refine the TSA Method. She also edited this document, and the Systems Performance book where it is published. Many thanks!