

Linux Performance
static, benchmarking, tuning:
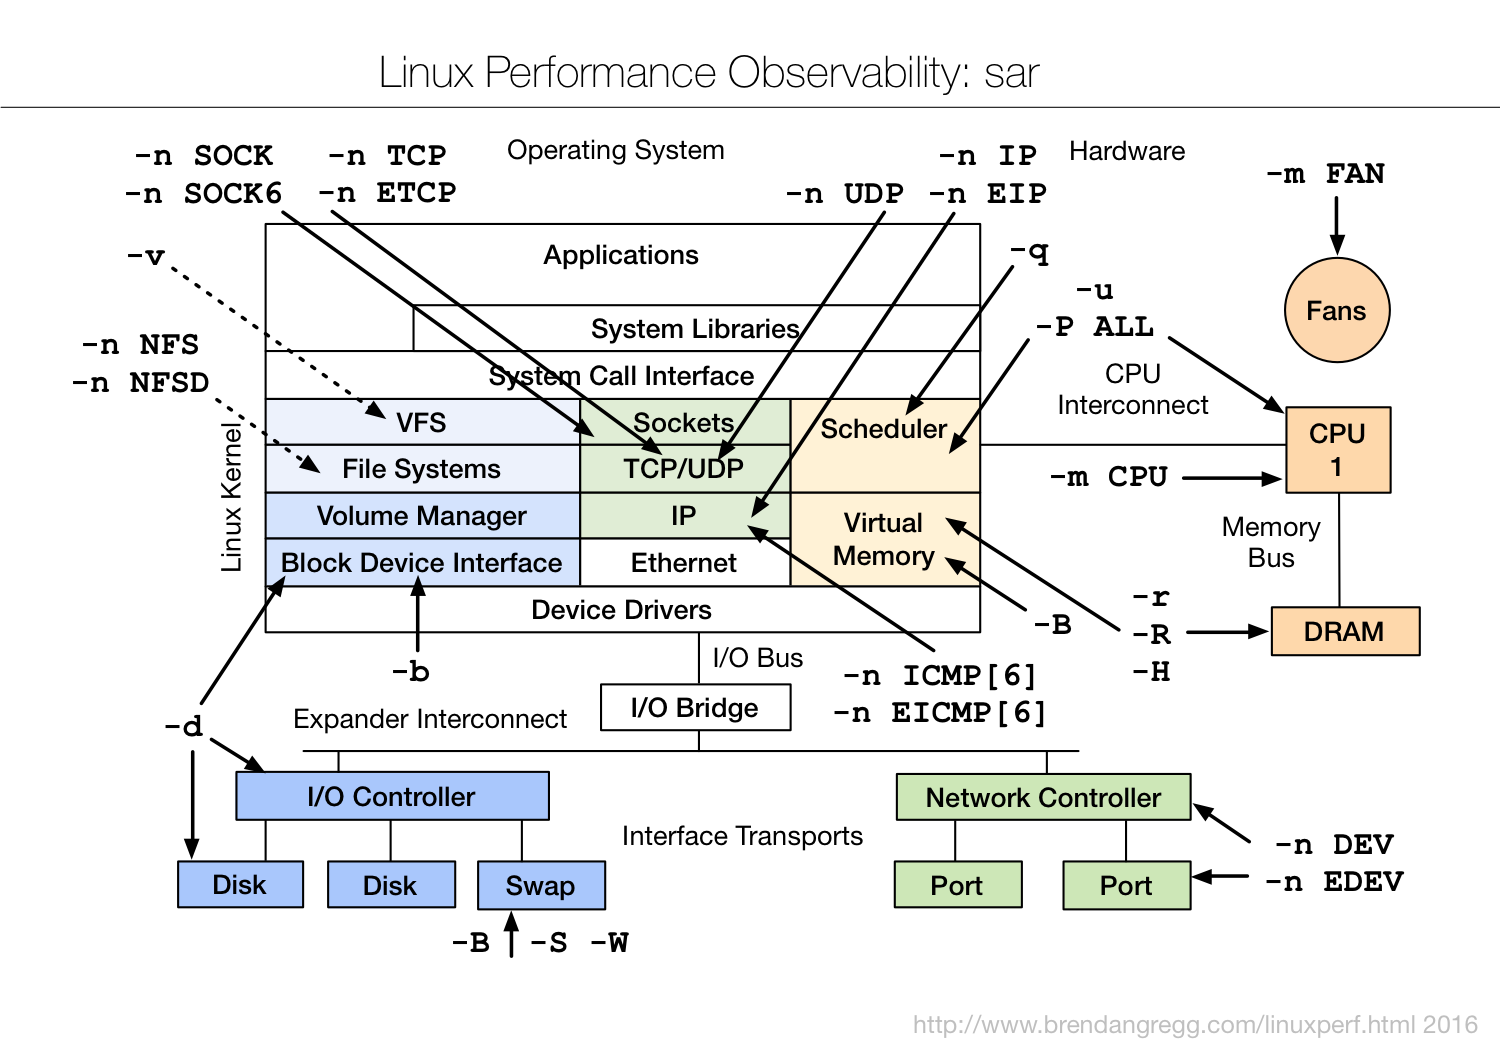
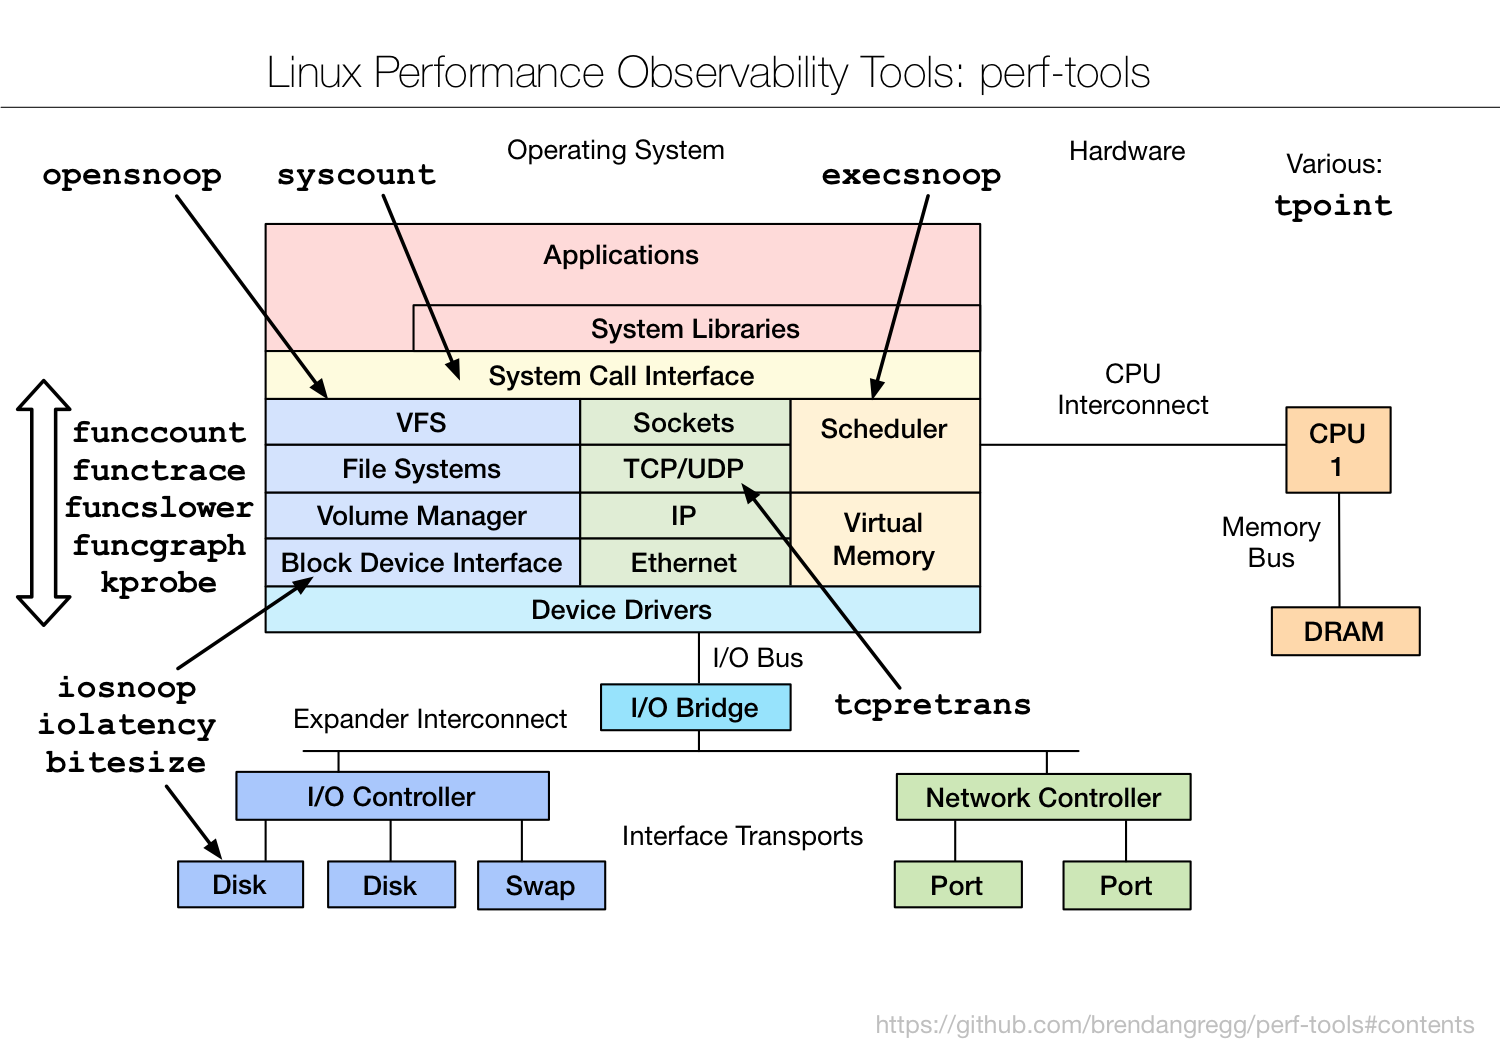
sar, perf-tools, bcc/BPF:

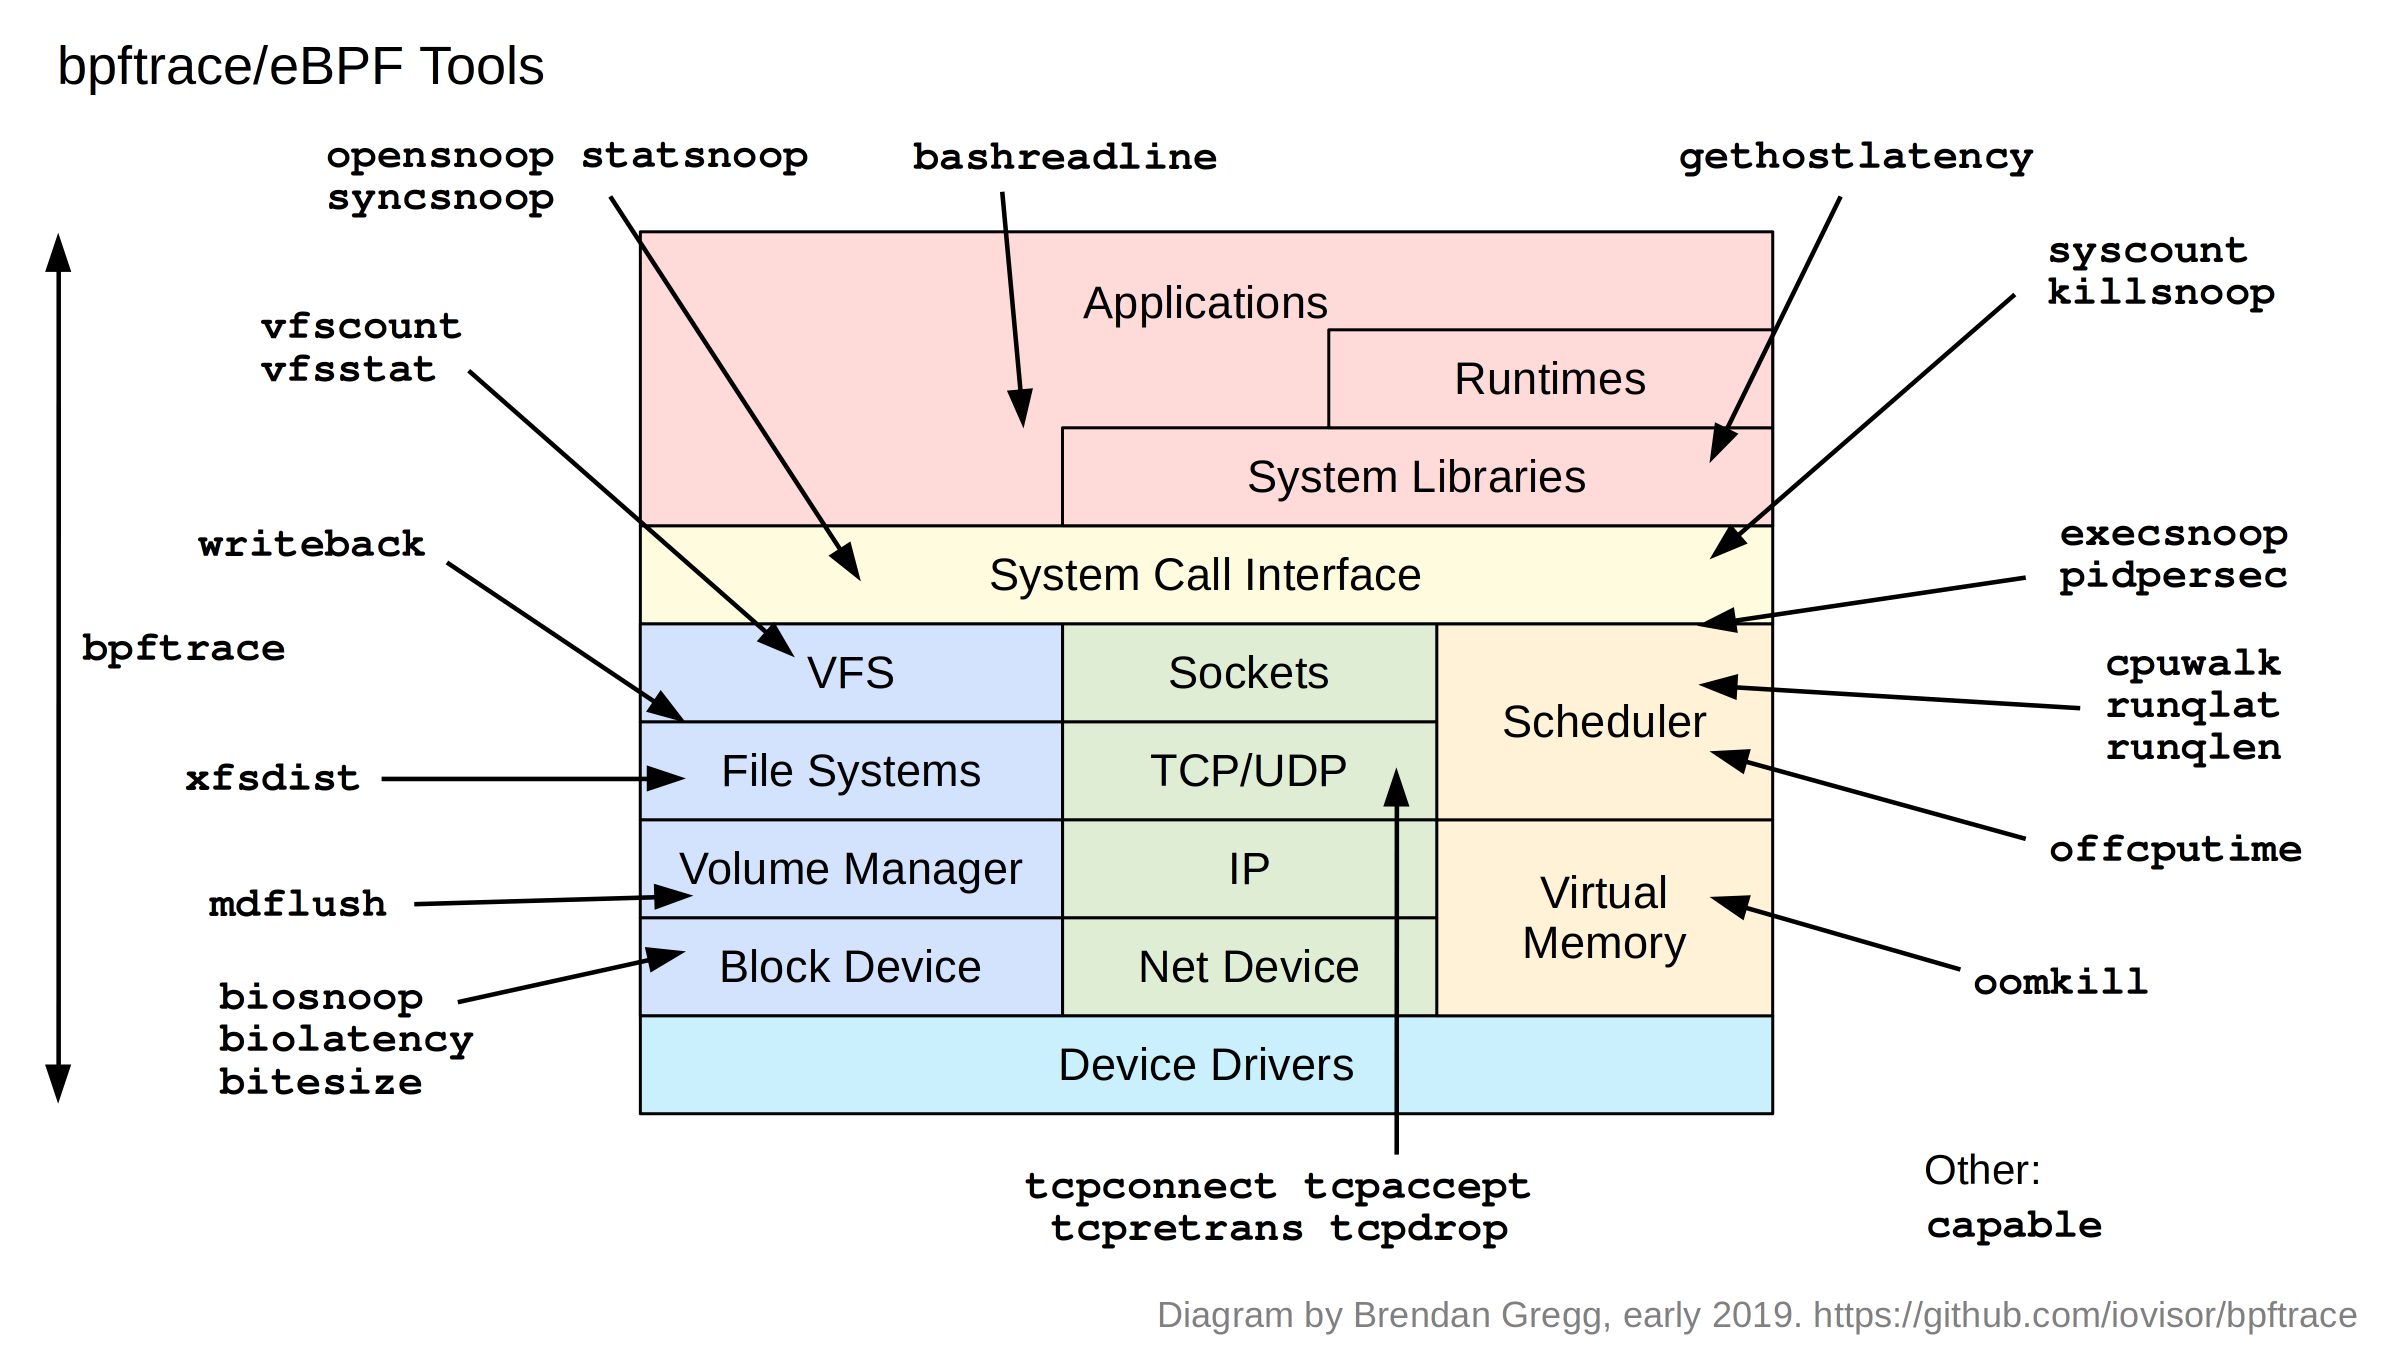
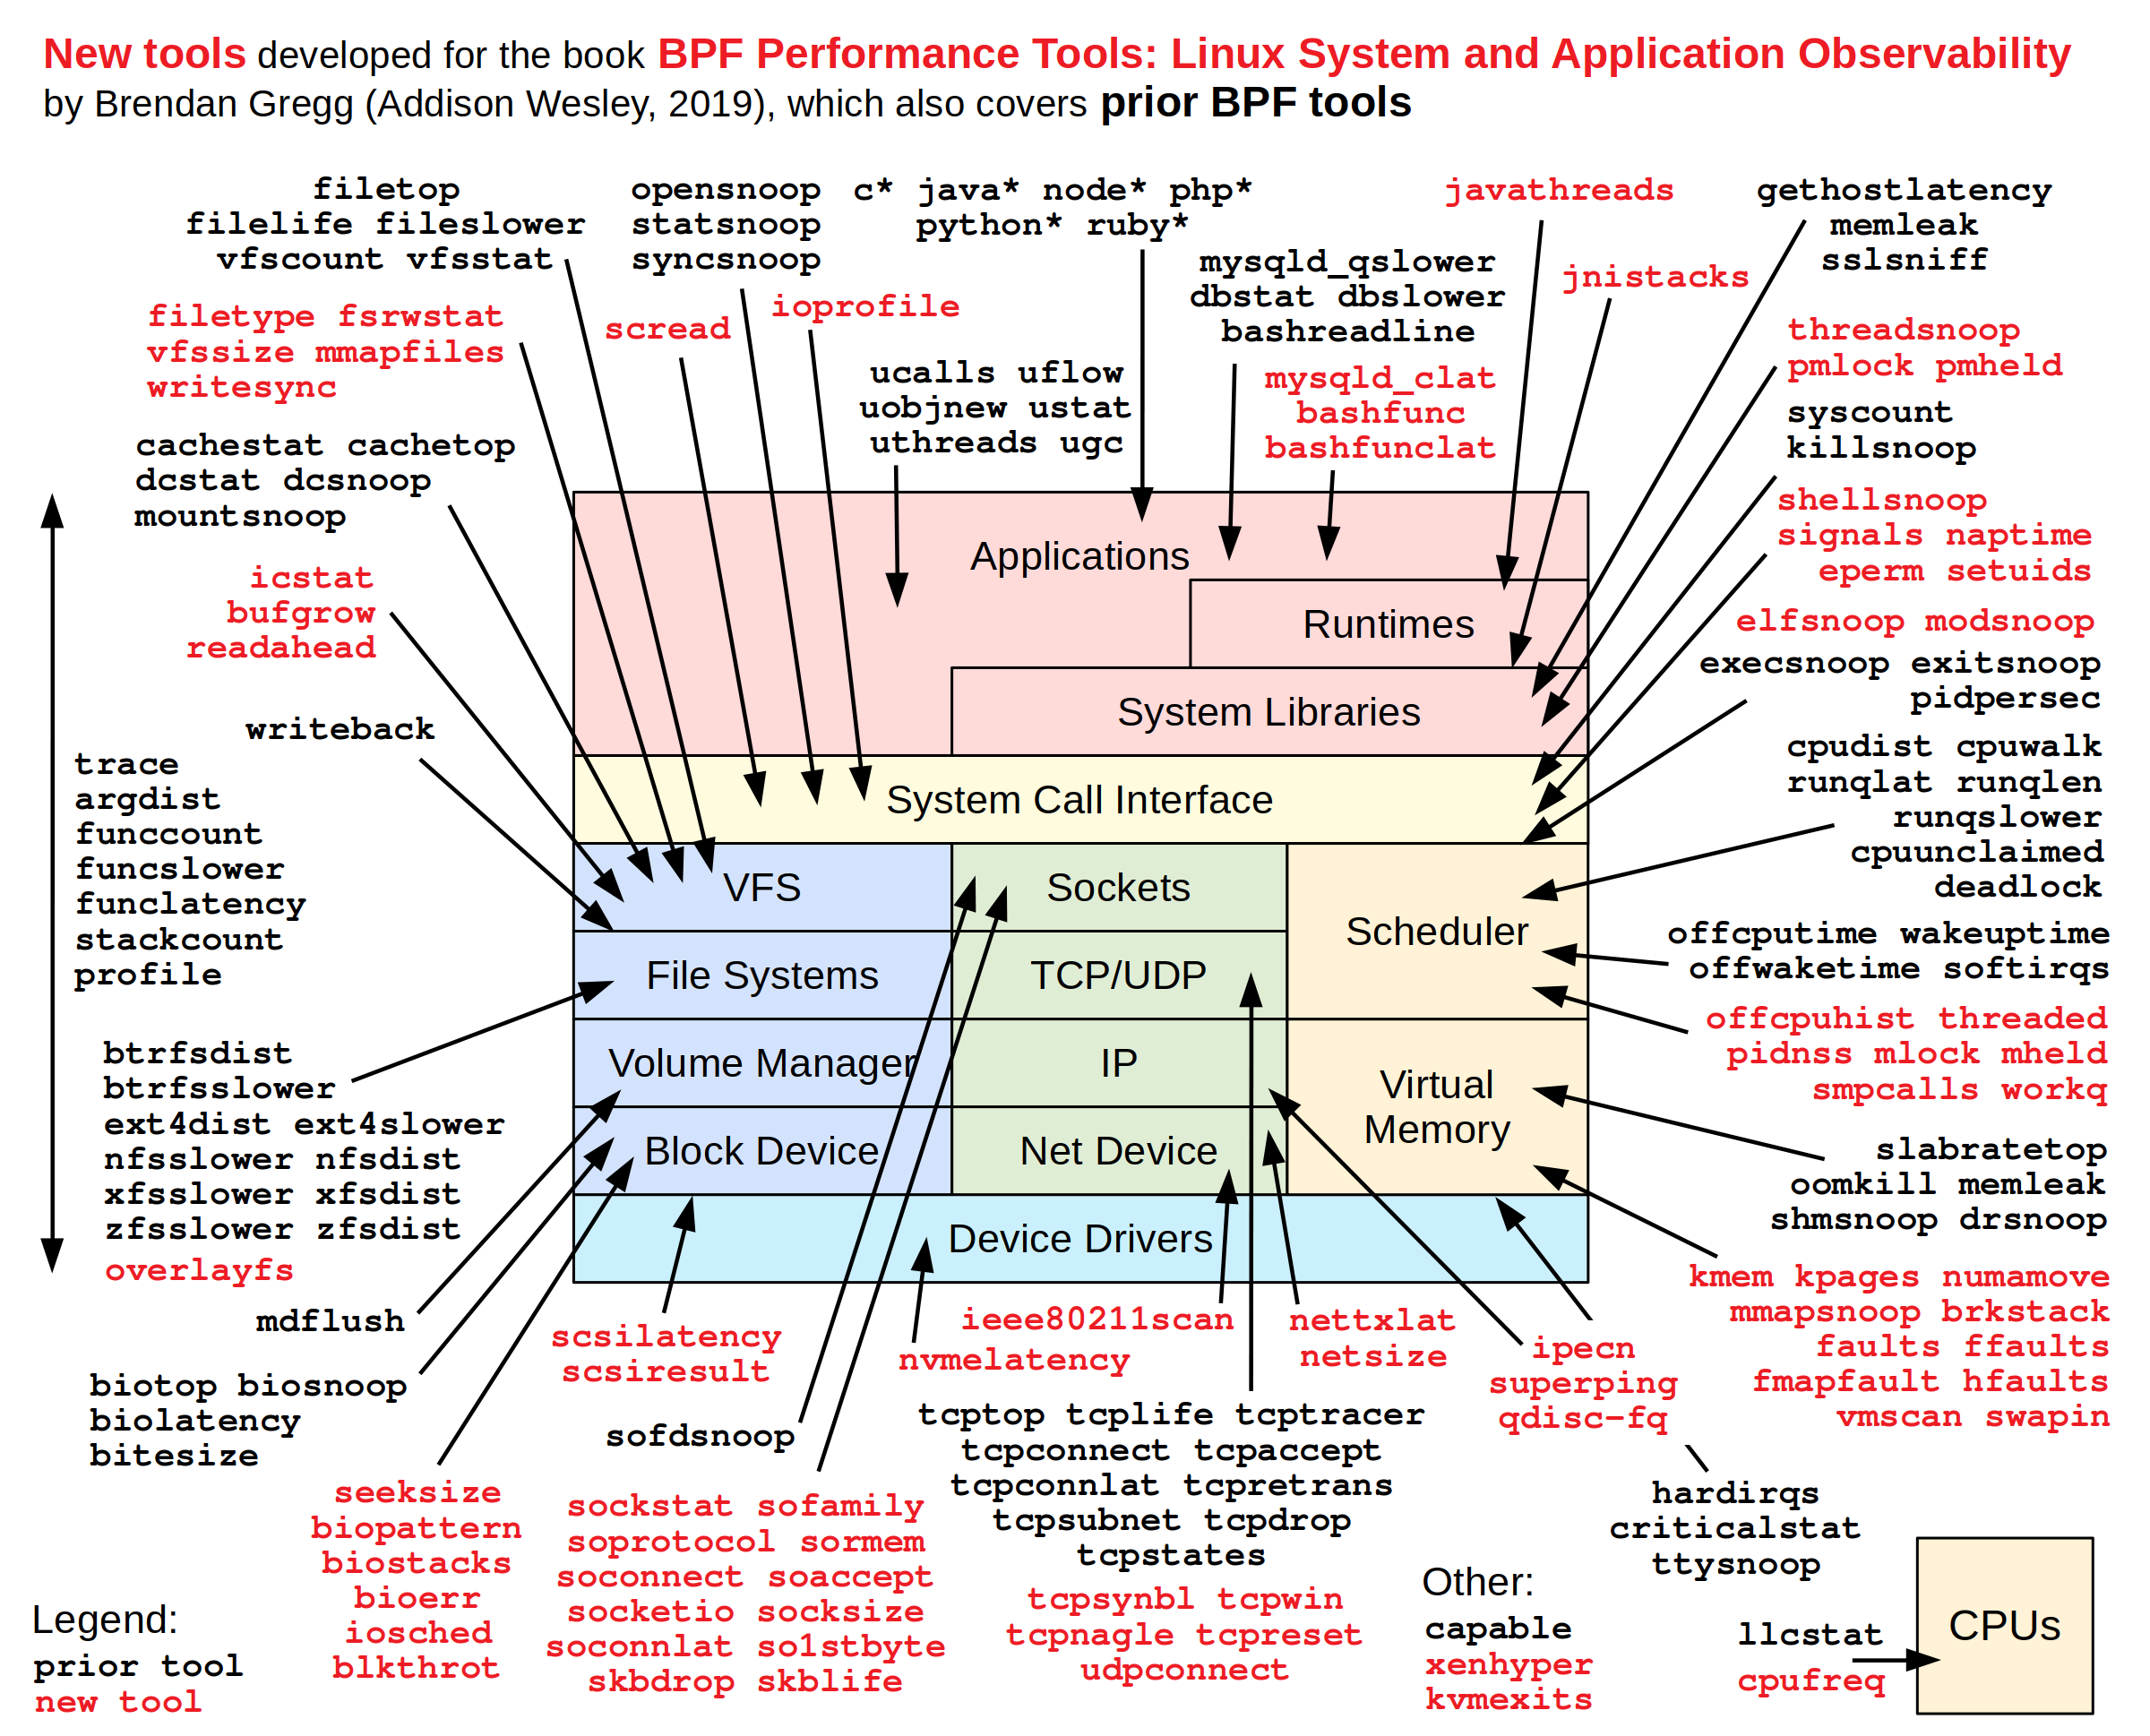
bpftrace, BPF book:
Images license: creative commons Attribution-ShareAlike 4.0.
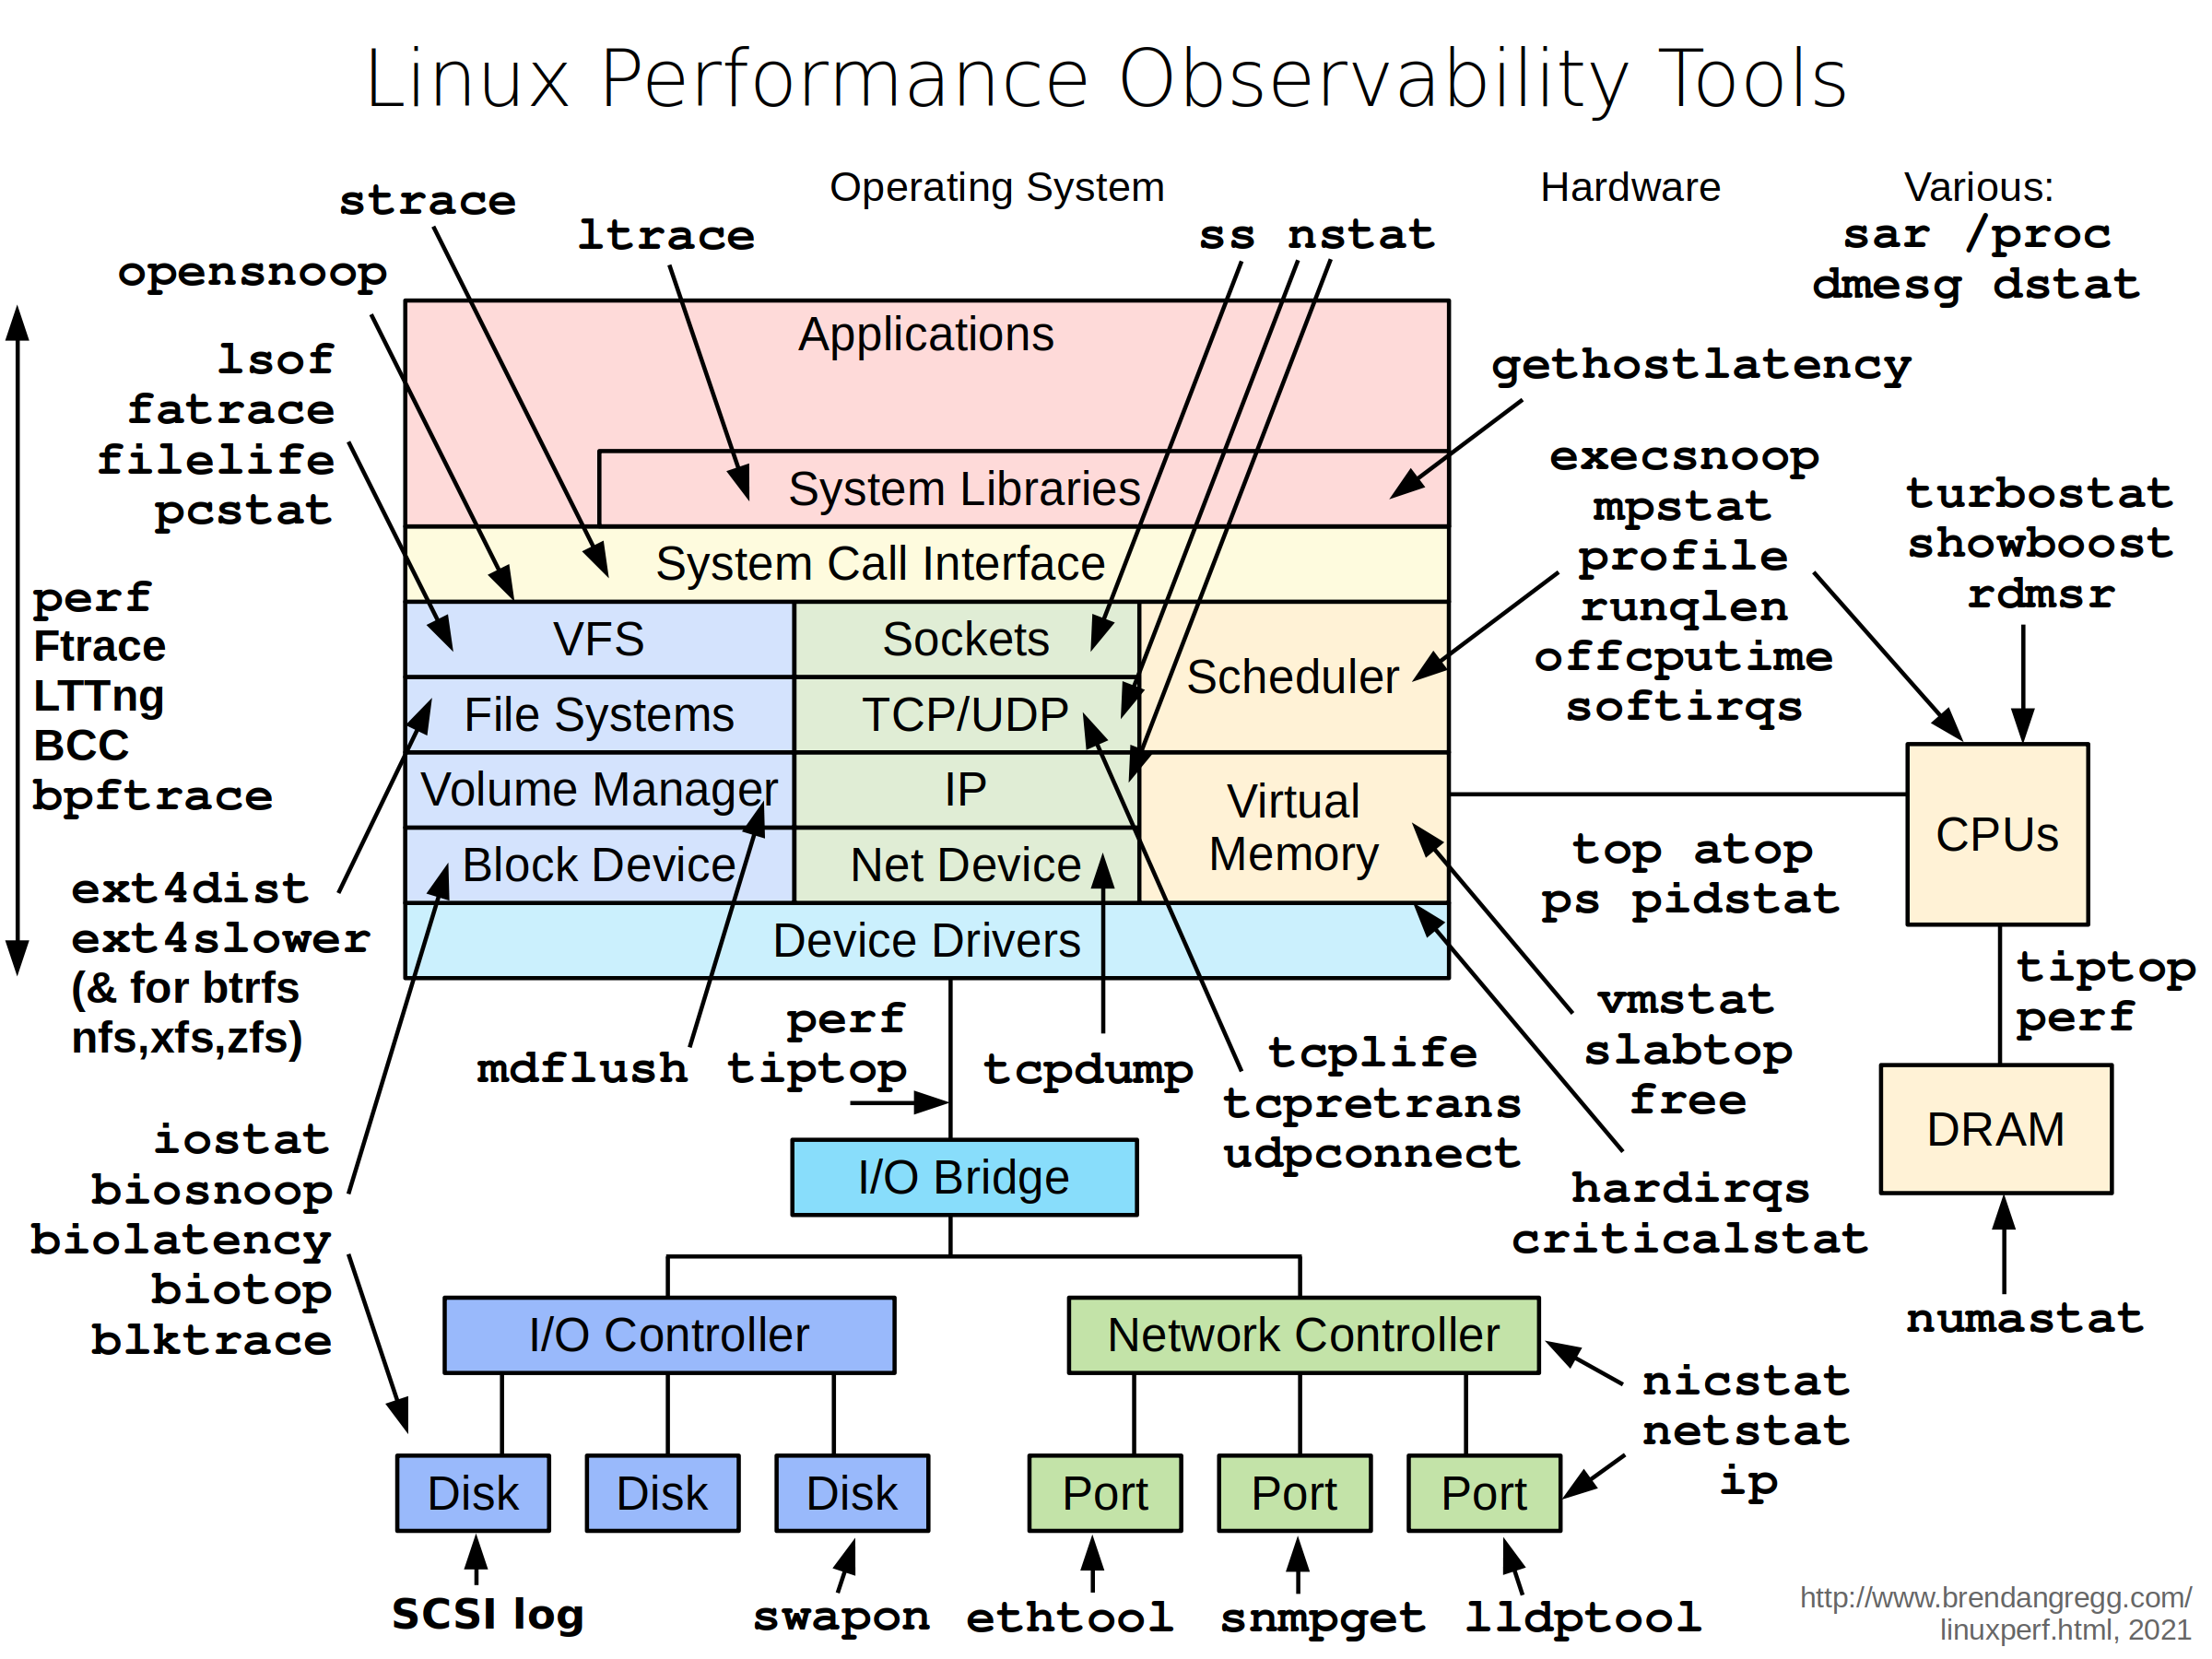
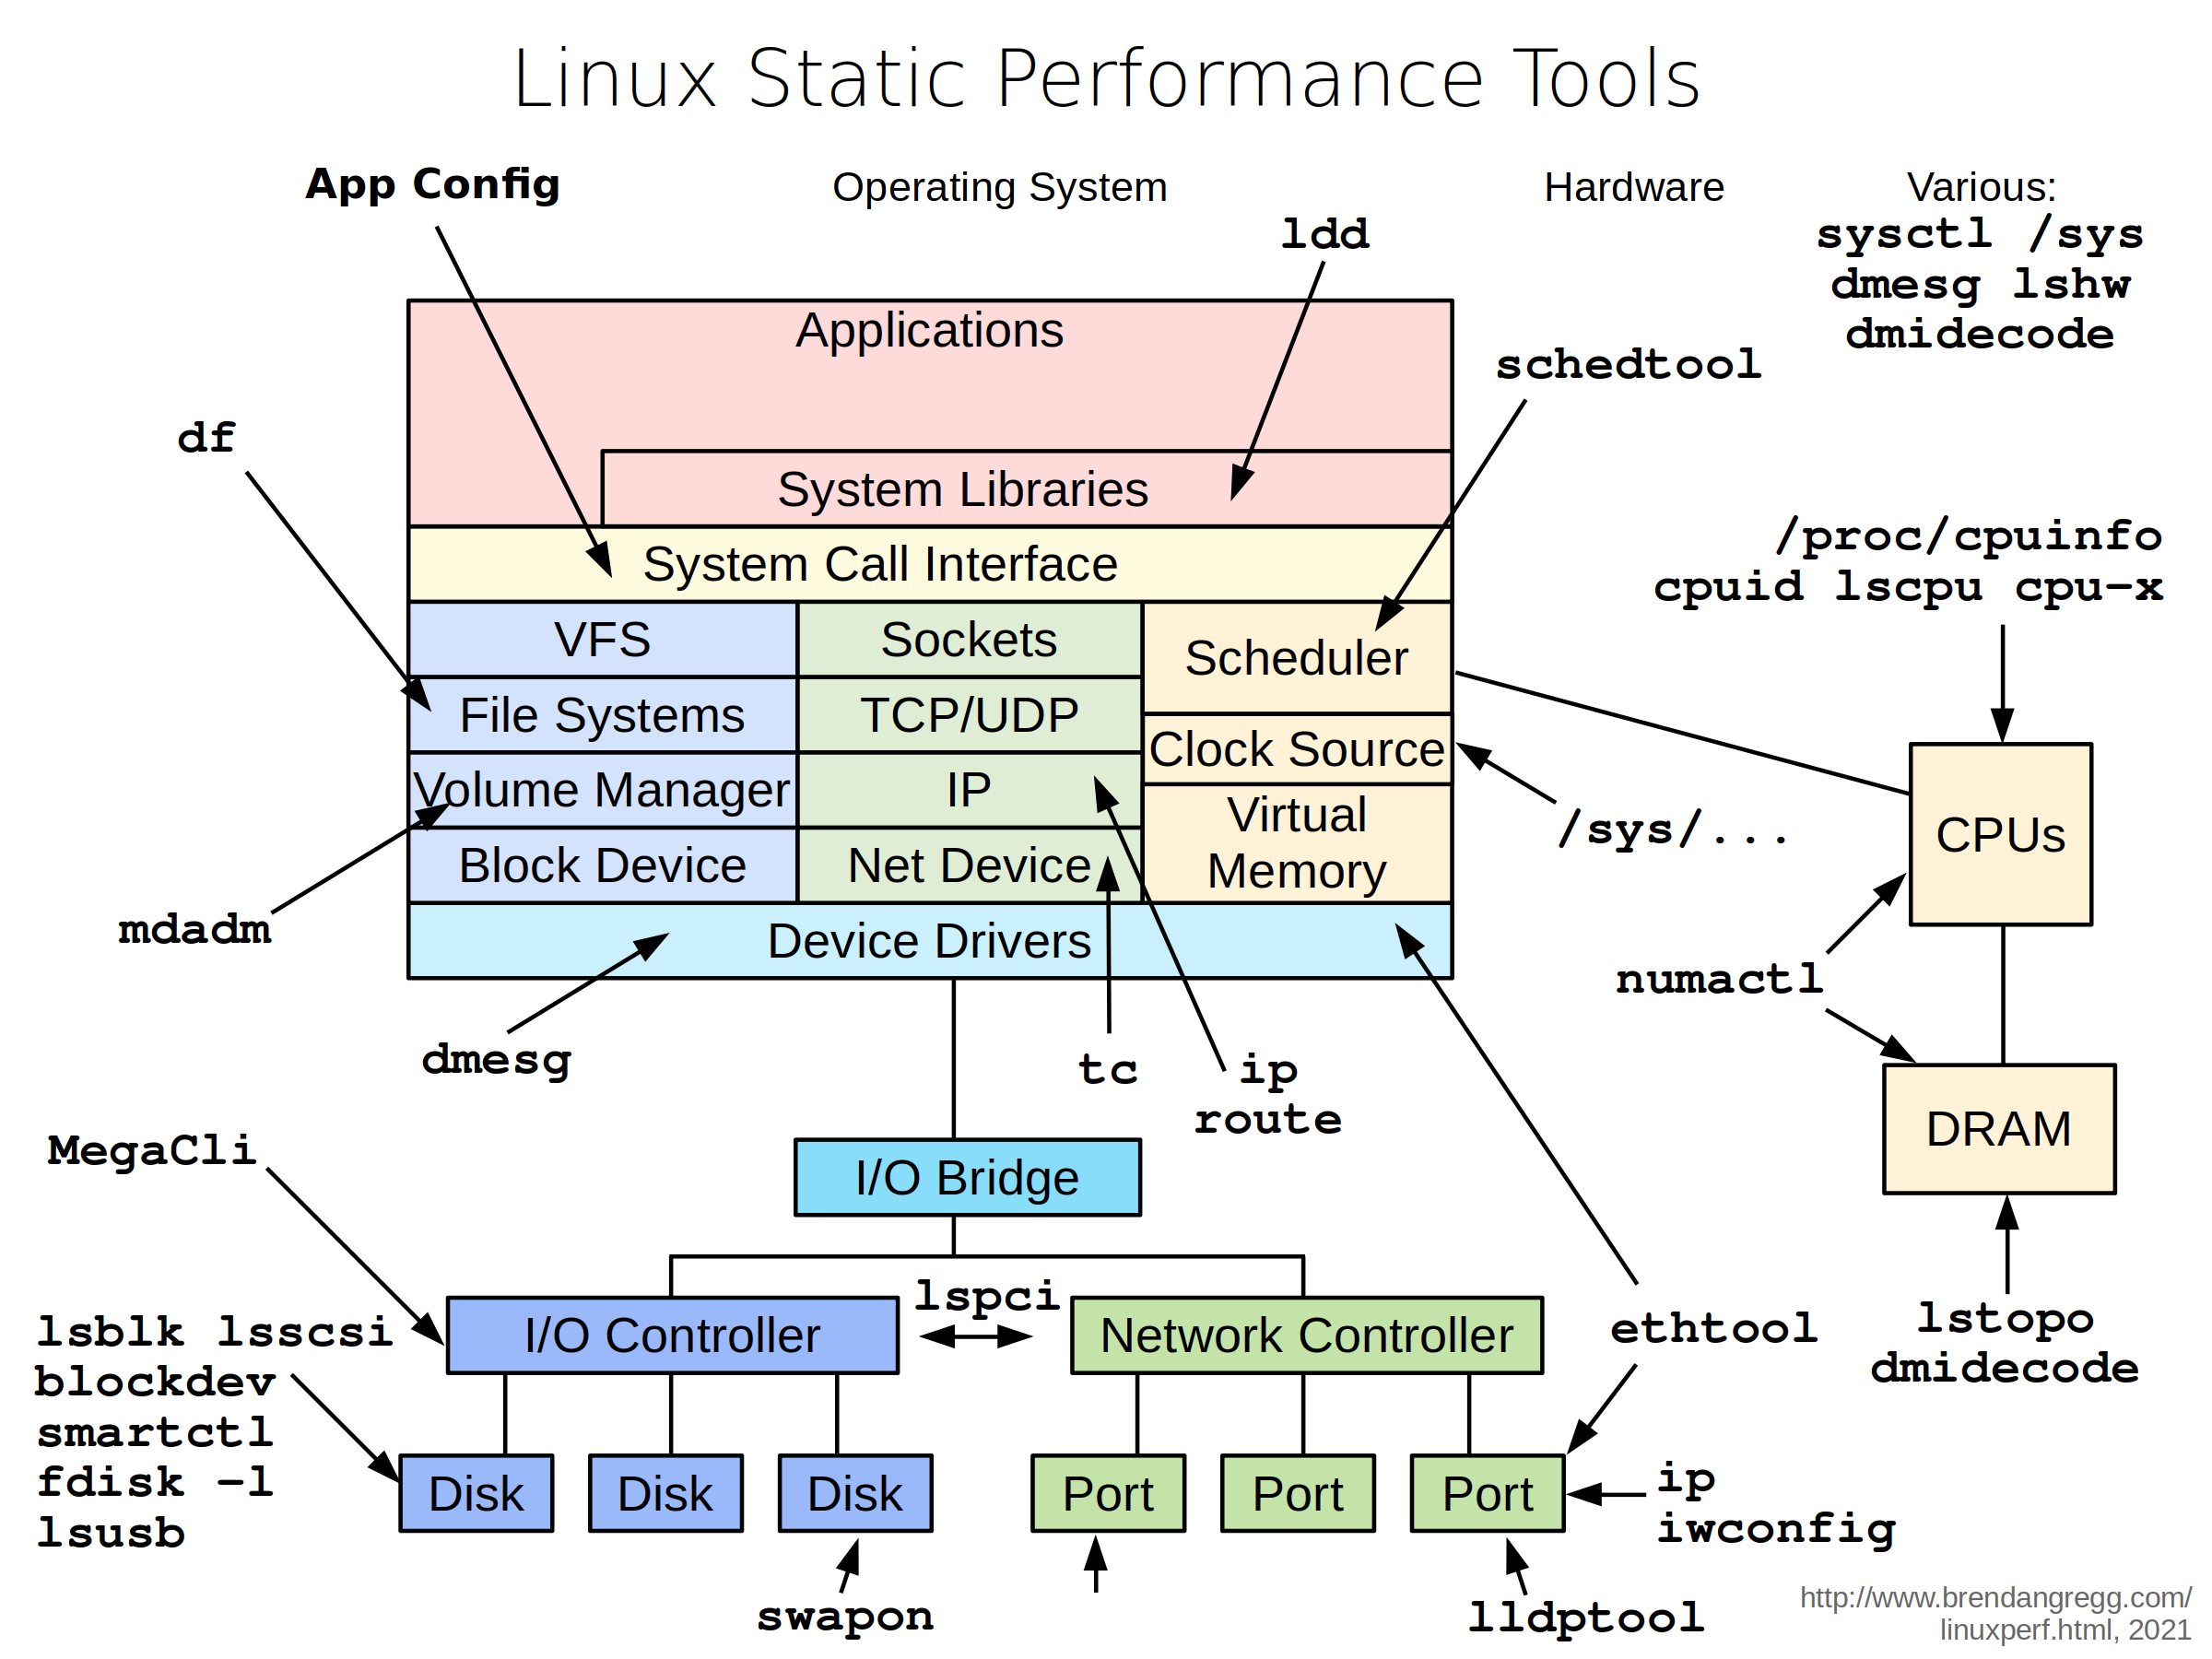
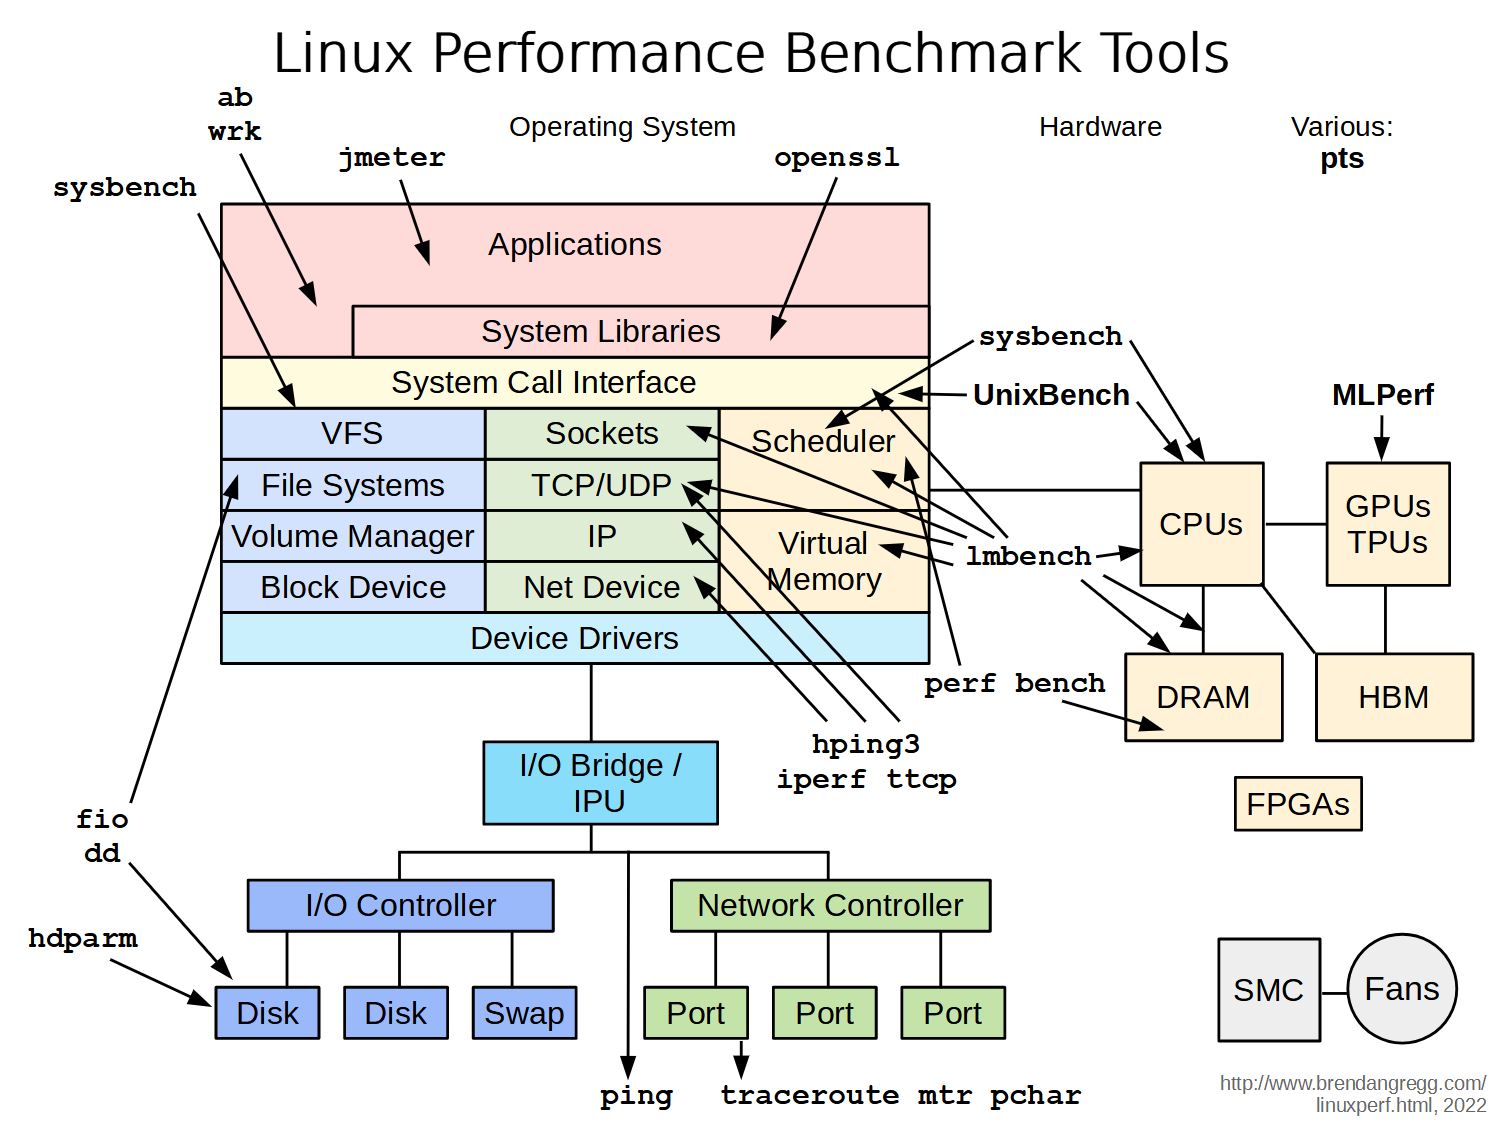
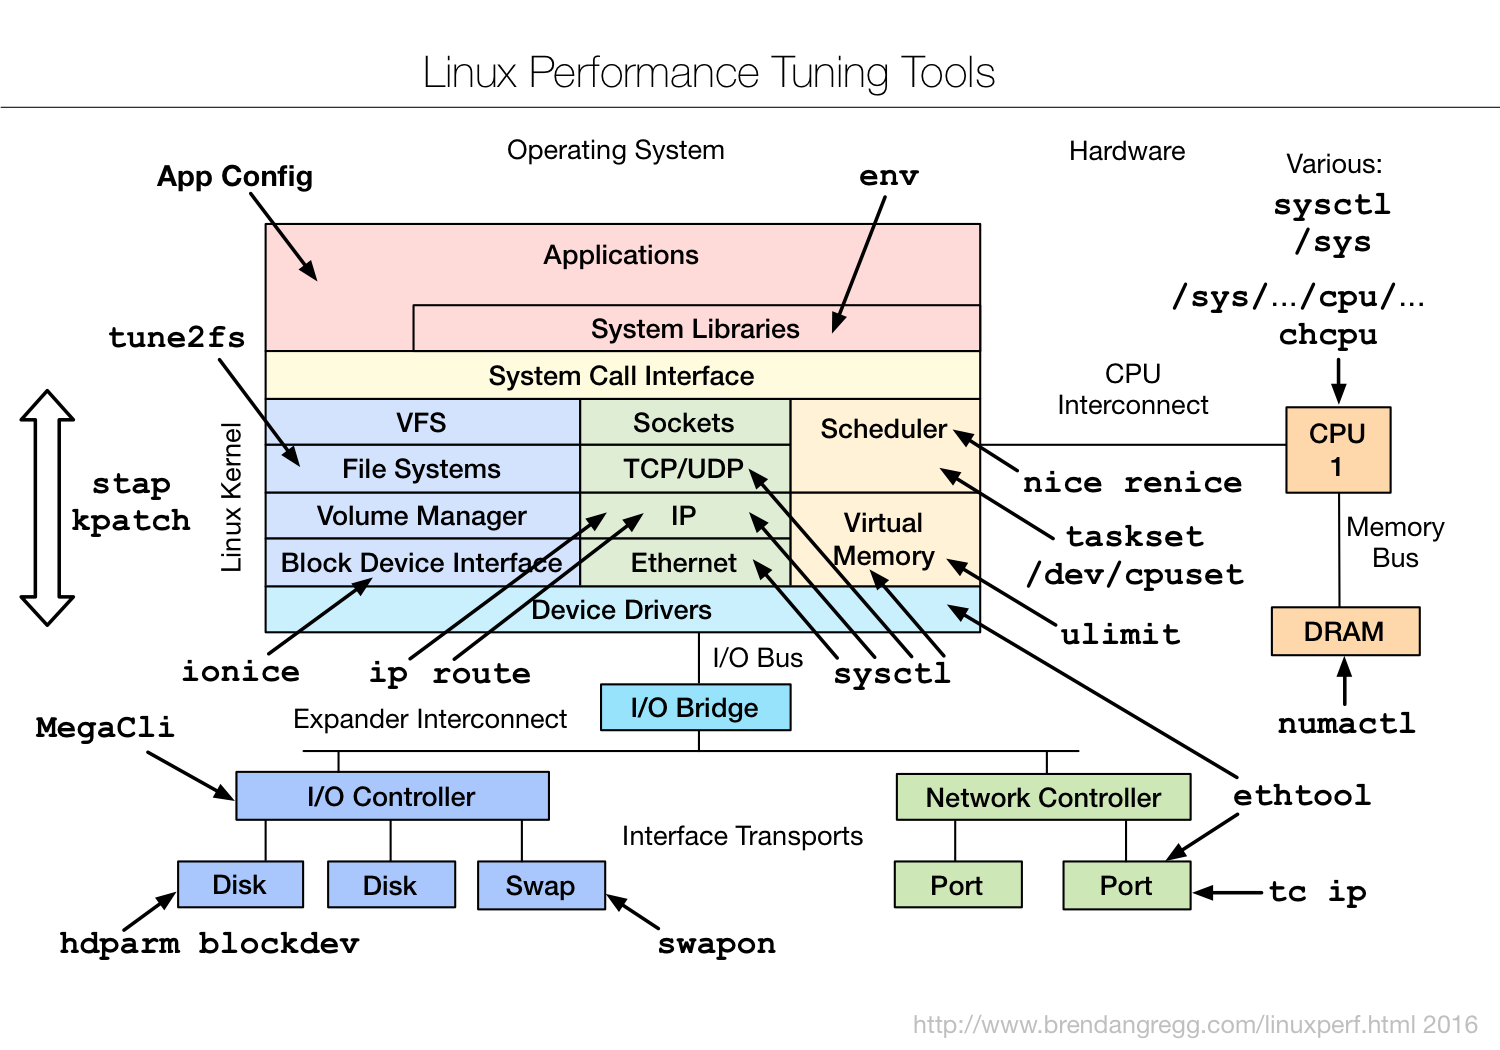
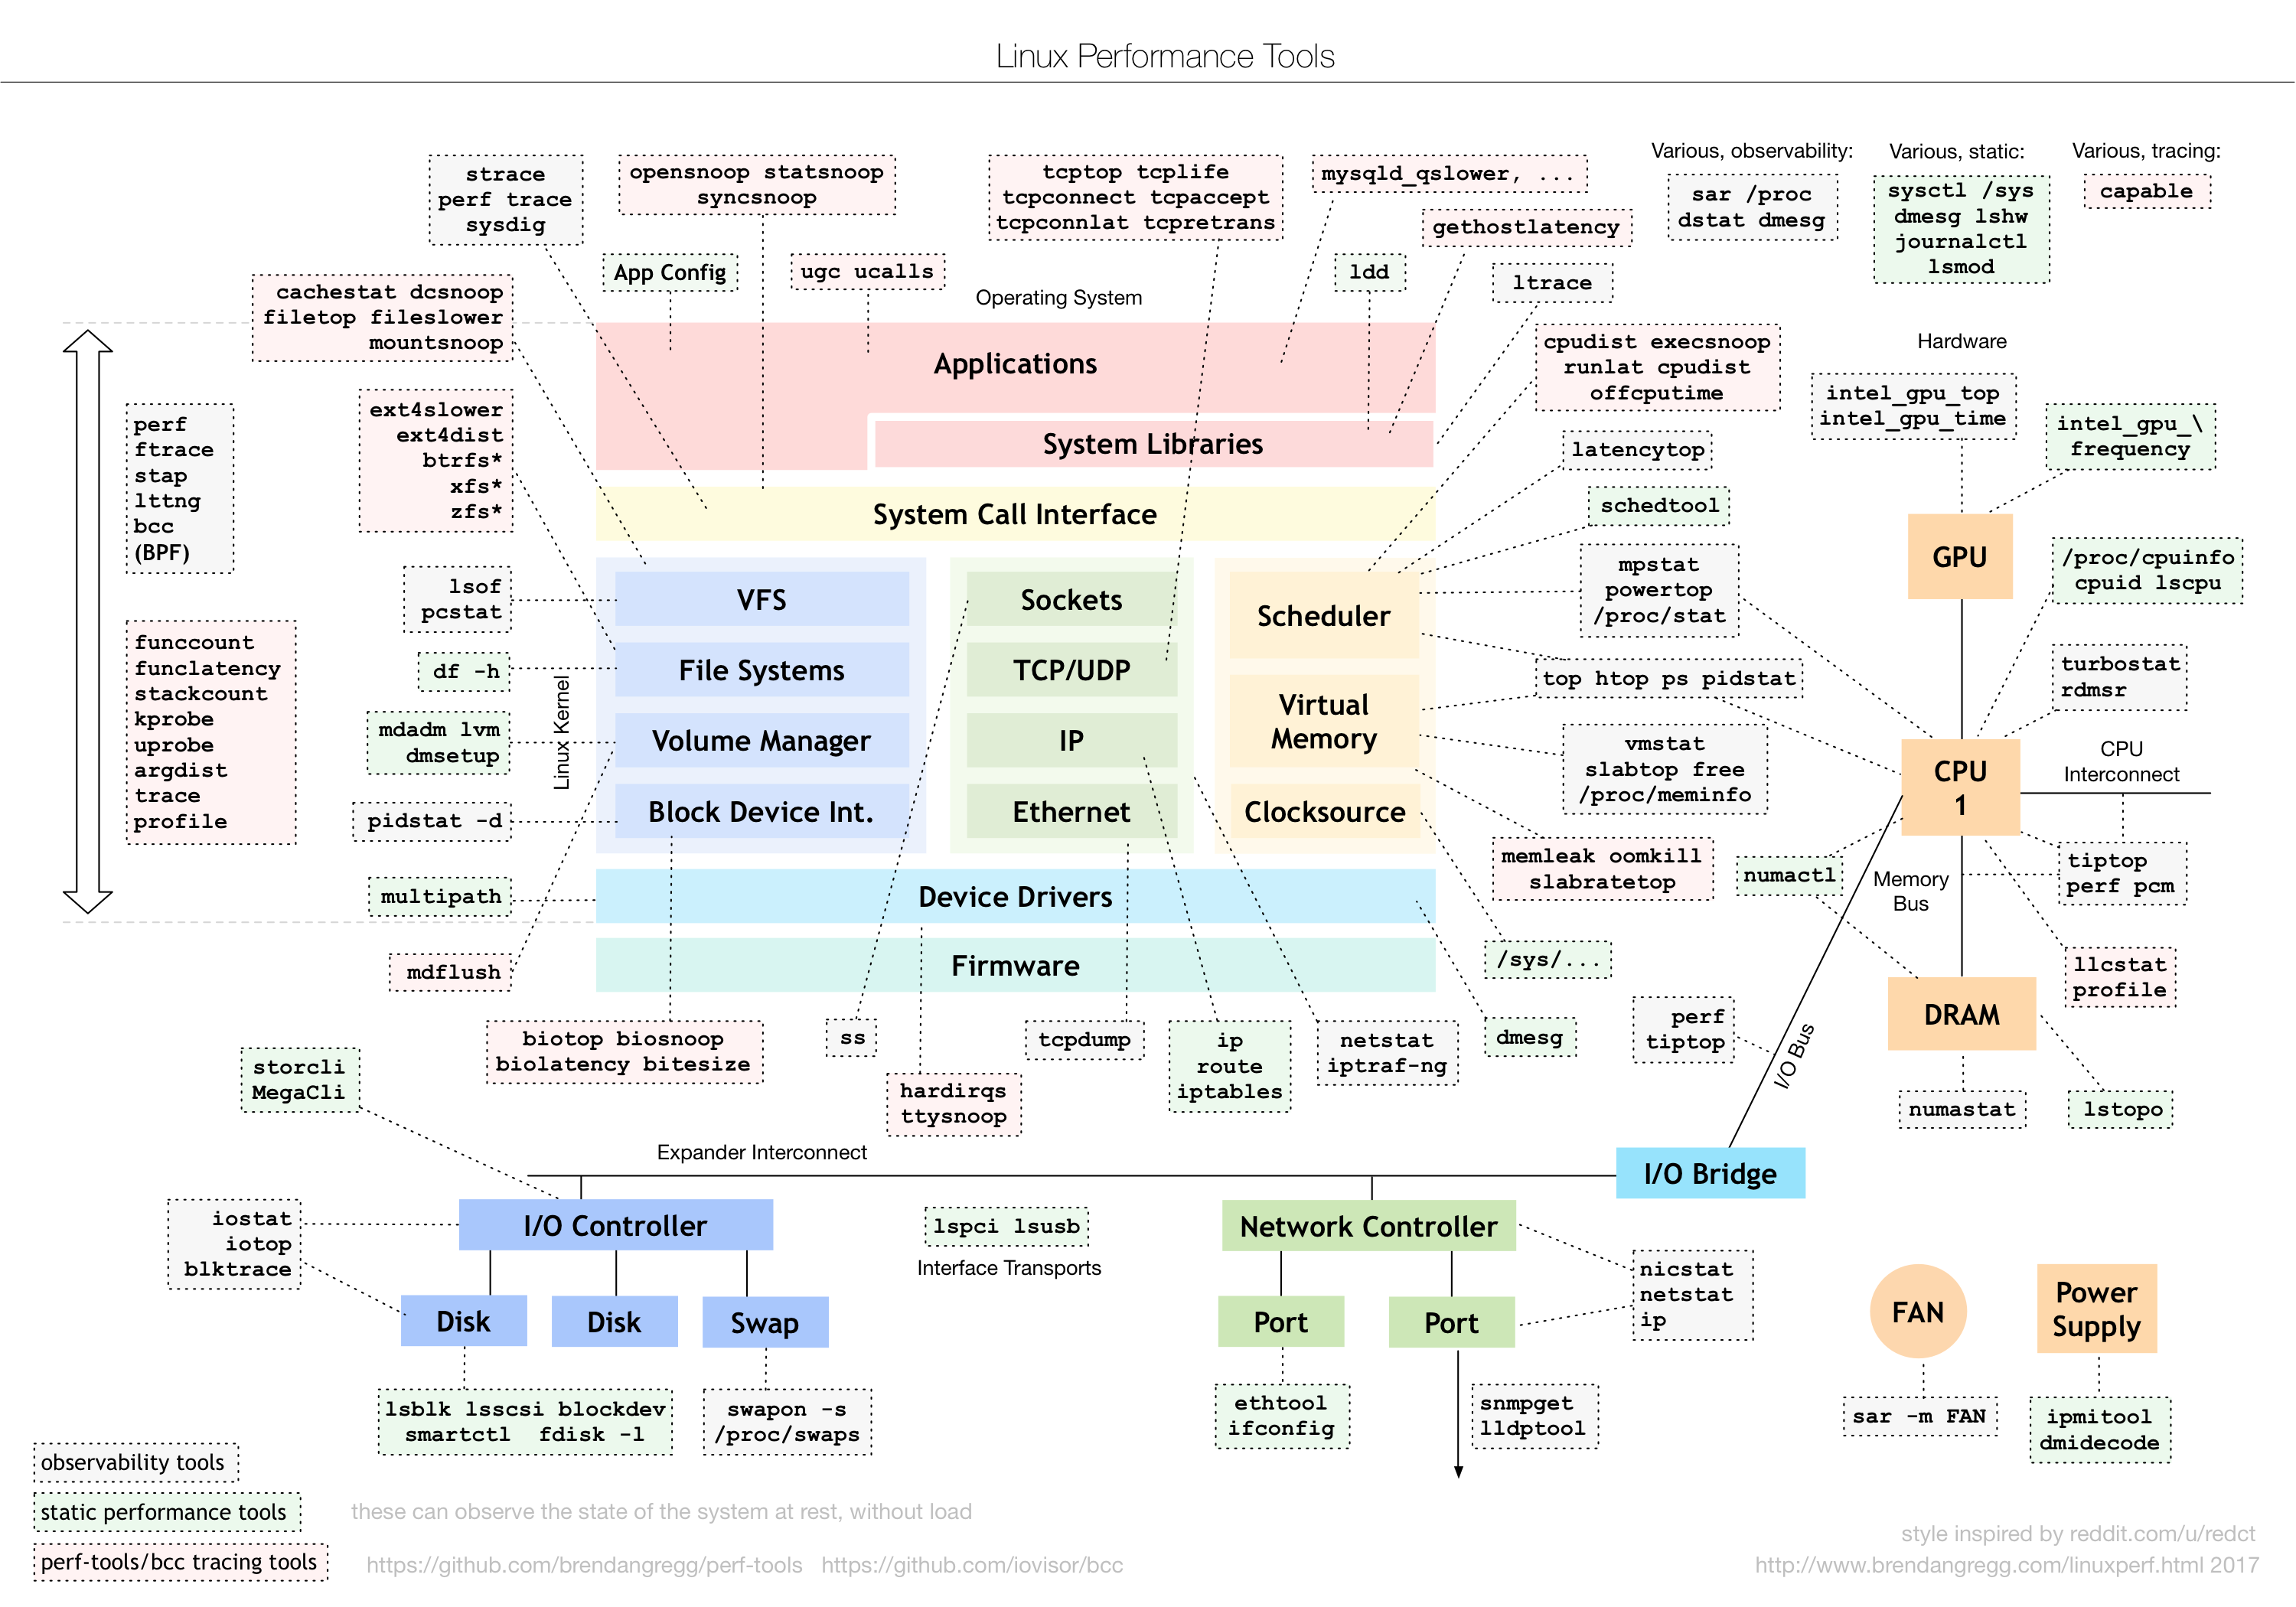
This page links to various Linux performance material I've created, including the tools maps on the right. These use a large font size to suit slide decks. You can also print them out for your office wall. They show: Linux observability tools, Linux static performance analysis tools, Linux benchmarking tools, Linux tuning tools, and Linux sar. Check the year on the image (bottom right) to see how recent it is.
There is also a hi-res diagram combining observability, static performance tuning, and perf-tools/bcc: png, svg (see discussion), but it is not as complete as the other diagrams. For even more diagrams, see my slide decks below.
On this page: Tools, Documentation, Talks, Resources.
Tools
- perf: perf one-liners, examples, visualizations.
- eBPF tools: BPF/bcc tracing tools and examples.
- perf-tools: Ftrace perf tools (github).
- bcc: BPF/bcc perf tools (github).
- bpftrace: BPF/bpftrace perf tools (github).
- Flame Graphs: using perf and other profilers.
Documentation
- Linux Performance Analysis in 60,000 Milliseconds shows the first ten commands to use in an investigation (video, PDF). Written by myself and the performance engineering team at Netflix (2015).
- My post Performance Tuning Linux Instances on EC2 includes the tunables used at Netflix (2015).
- A post on Linux Load Averages: Solving the Mystery, explaining what they are and why they include the uninterruptible sleep state (2017).
- The post The Return of the Frame Pointers, describing what they are, why they are coming back in major Linux distros, and other stack walking techniques (2024).
- A gdb Debugging Full Example (Tutorial), including the use of some perf/debugging tools (2016).
- The book Systems Performance: Enterprise and the Cloud, 2nd Edition (2020) covers performance analysis methods and Linux tools, including perf, Ftrace, and eBPF.
- The book BPF Performance Tools: Linux System and Application Observability tours over 100 eBPF performance analysis tools, while including short summaries of the traditional tools. In a way, this is volume 2, and Systems Performance 2nd Edition is volume 1.
- Generating flame graphs on Linux using perf & eBPF:
- Posts about eBPF, bcc, and bpftrace (2015-23):
-
Linux eBPF (2015)
bcc: Taming Linux 4.3+ Tracing Superpowers
tcpconnect and tcpaccept for Linux (bcc)
Linux eBPF Stack Trace Hack (bcc) (2016)
Linux eBPF Off-CPU Flame Graph (bcc)
Linux Wakeup and Off-Wake Profiling (bcc)
Linux chain graph prototype (bcc)
Linux eBPF/bcc uprobes
Linux BPF/bcc Road Ahead
Ubuntu Xenial bcc/BPF
Linux bcc/BPF Tracing Security Capabilities
Linux MySQL Slow Query Tracing with bcc/BPF
Linux bcc/BPF ext4 Latency Tracing
Linux bcc/BPF Run Queue (Scheduler) Latency
Linux bcc/BPF Node.js USDT Tracing
Linux bcc tcptop
Linux 4.9's Efficient BPF-based Profiler
DTrace for Linux 2016
Linux 4.x Tracing Tools: Using BPF Superpowers
Linux bcc/BPF tcplife: TCP Lifespans
Golang bcc/BPF Function Tracing (2017)
7 BPF tools for performance analysis on Fedora
TCP Tracepoints (2018)
Linux bcc/eBPF tcpdrop
bpftrace (DTrace 2.0) for Linux 2018
Learn eBPF Tracing: Tutorial and Examples (2019)
A thorough introduction to bpftrace
BPF: A New Type of Software
BPF Theremin, Tetris, and Typewriters
BPF binaries: BTF, CO-RE, and the future of BPF perf tools (2020)
USENIX LISA2021 BPF Internals (eBPF) (2021)
How To Add eBPF Observability To Your Product
eBPF Observability Tools are not Security Tools (2023)
- My lwn.net article Ftrace: The Hidden Light Switch shows a use case for Linux ftrace (Aug, 2014).
- Posts about ftrace-based perf-tools (2014-5):
- Posts about perf-based perf-tools: perf Hacktogram.
- Posts about perf_events (2014-7):
- A page on Working Set Size Estimation for Linux (2018+).
- A post on KPTI/KAISER Meltdown Initial Performance Regressions (2018).
- In The PMCs of EC2: Measuring IPC I showed the new Performance Monitoring Counter (PMC) support in the AWS EC2 cloud (2017).
- CPU Utilization is Wrong: a post explaining the growing problem of memory stall cycles dominating the %CPU metric (2017).
- A post about Linux 4.7 Hist Triggers (2016).
- The post The Speed of Time, a case study from 2014 of analyzing Linux clocksource performance in virtualized environments (2021).
- The blog post strace Wow Much Syscall discusses strace(1) for production use, and compares it to advanced tracing tools (2014).
- USE Method: Linux Performance Checklist; also see the USE Method page for the description of this methodology.
- Off-CPU Analysis Method, where I demonstrate this methodology on Linux.
Talks
In rough order of recommended viewing or difficulty, intro to more advanced:
1. Linux Systems Performance (USENIX LISA 2019)
This is my summary of Linux systems performance in 40 minutes, covering six facets: observability, methodologies, benchmarking, profiling, tracing, and tuning. It's intended for everyone as a tour of fundamentals, and some companies have indicated they will use it for new hire training.
A video of the talk is on usenix.org and youtube, here are the slides or as a PDF.
For a lot more information on observability tools, profiling, and tracing, see the talks that follow.
2. Linux Performance 2018 (PerconaLive 2018)
This was a 20 minute keynote summary of recent changes and features in Linux performance in 2018.
A video of the talk is on youtube, and the slides are on slideshare or as a PDF.
3. Linux Performance Tools (Velocity 2015)
At Velocity 2015, I gave a 90 minute tutorial on Linux performance tools, summarizing performance observability, benchmarking, tuning, static performance tuning, and tracing tools. I also covered performance methodology, and included some live demos. This should be useful for everyone working on Linux systems. If you just saw my PerconaLive2016 talk, then some content should be familiar, but with many extras: I focus a lot more on the tools in this talk.
A video of the talk is on youtube (playlist; part 1, part 2) and the slides are on slideshare or as a PDF.
This was similar to my SCaLE11x and LinuxCon talks, however, with 90 minutes I was able to cover more tools and methodologies, making it the most complete tour of the topic I've done. I also posted about it on the Netflix Tech Blog.
4. How Netflix Tunes EC2 Instances for Performance (AWS re:Invent, 2017)
Instead of performance observability, this talk is about tuning. I begin by providing Netflix background, covering instance types and features in the AWS EC2 cloud, and then talk about Linux kernel tunables and observability.
A video of the talk is on youtube and the slides are on slideshare:
5. Container Performance Analysis (DockerCon, 2017)
At DockerCon 2017 in Austin, I gave a talk on Linux container performance analysis, showing how to find bottlenecks in the host vs the container, how to profiler container apps, and dig deeper into the kernel.
A video of the talk is on youtube and the slides are on slideshare.
6. Broken Linux Performance Tools (SCaLE14x, 2016)
At the Southern California Linux Expo (SCaLE 14x), I gave a talk on Broken Linux Performance Tools. This was a follow-on to my earlier Linux Performance Tools talk originally at SCaLE11x (and more recently at Velocity as a tutorial). This broken tools talk was a tour of common problems with Linux system tools, metrics, statistics, visualizations, measurement overhead, and benchmarks. It also includes advice on how to cope (the green "What You Can Do" slides).
A video of the talk is on youtube and the slides are on slideshare or as a PDF.
7. Using Linux perf at Netflix (Kernel Recipes, 2017)
At Kernel Recipes 2017 I gave an updated talk on Linux perf at Netflix, focusing on getting CPU profiling and flame graphs to work. This talk includes a crash course on perf_events, plus gotchas such as fixing stack traces and symbols when profiling Java, Node.js, VMs, and containers.
A video of the talk is on youtube and the slides are on slideshare:
There's also an older version of this talk from 2015, which I've posted about. To learn more about flame graphs, see my flame graphs presentation.
8. Give me 15 minutes and I'll change your view of Linux tracing (LISA, 2016)
I gave this demo at USENIX/LISA 2016, showing ftrace, perf, and bcc/BPF. A video is on youtube (sorry, the sound effects are a bit too loud):.
This was the first part of a longer talk on Linux 4.x Tracing Tools: Using BPF Superpowers. See the full talk video and talk slides.
9. Performance analysis superpowers with Linux eBPF (O'Reilly Velocity, 2017)
This talk covers using enhanced BPF (aka eBPF) features added to the Linux 4.x series for performance analysis, observability, and debugging. The front-end used in this talk is bcc (BPF compiler collection), an open source project that provides BPF interfaces and a collection of tools.
A video of the talk is on youtube, and the slides are on slideshare or as a PDF.
10. Linux Performance Analysis: New Tools and Old Secrets (ftrace) (LISA 2014)
At USENIX LISA 2014, I gave a talk on the new ftrace and perf_events tools I've been developing: the perf-tools collection on github, which mostly uses ftrace: a tracer that has been built into the Linux kernel for many years, but few have discovered (practically a secret).
A video of the talk is on youtube, and the slides are on slideshare or as a PDF. In a post about this talk, I included some more screenshots of these tools in action.
11. Performance Checklists for SREs (SREcon, 2016)
At SREcon 2016 Santa Clara, I gave the closing talk on performance checklists for SREs (Site Reliability Engineers). The later half of this talk included Linux checklists for incident performance response. These may be useful whether you're analyzing Linux performance in a hurry or not.
A video of the talk is on youtube and usenix, and the slides are on slideshare and as a PDF. I included the checklists in a blog post.
Resources
Other resources (not by me) I'd recommend for the topic of Linux performance:
- RHEL Performance Guide includes many CLI tools and tunables.
- Performance analysis & tuning of Red Hat Enterprise Linux - 2015 Red Hat Summit (video 2hrs): this is a great and in-depth tour of Linux performance tuning that should be largely applicable to all Linux distros.
- Linux Instrumentation: slides from a great talk in June 2010 by Ian Munsie, which summarizes the different Linux tracers very well. If you're trying to understand all the tracers and frameworks, this is worth studying (keeping in mind it's from 2010).
- Julia Evans blog has many posts about many topics, including performance tools.
- Davidlohr Bueso's Linux performance posts.