

I originally posted this at http://blogs.sun.com/brendan/entry/networking_analytics_example.
I just setup a new Sun Storage 7410, and found a performance issue using Analytics. People have been asking for examples of Analytics in use, so I need to blog these as I find them. This one is regarding network throughput, and while simple, it demonstrates the value of high level data and some features of Analytics.
The Symptom
To test this new 7410, I ran a cached DRAM read workload from 10 clients and checked network throughput:
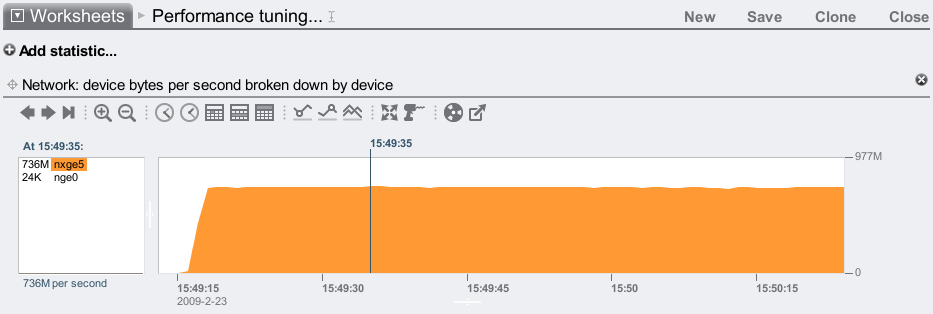
It's reached 736 Mbytes/sec, and I know the 7410 can go faster over 1 x 10 GbE port (I previously posted a test showing a single nxge port reaching 1.10 Gbytes/sec.) This is a different workload and client setup, so, is 736 Mbytes/sec the most I should expect from these clients and this workload? Or can I go closer to 1.10 Gbytes/sec?
With Analytics, I can examine intricate details of system performance throughout the software stack. Start simple – start with the higher level questions and drill down deeper on anything suspicious. Also, don't assume anything that can easily be measured.
I expect my 10 clients to be performing NFSv3 reads, but are they? This is easily checked:
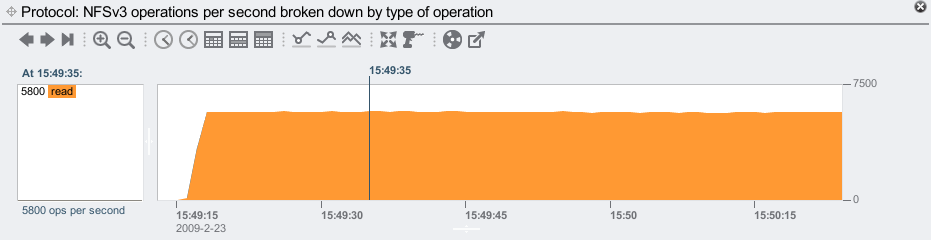
They are.
Since these clients are 10 identical blades in a blade server, and the workload I ran successfully connected to and started running on all 10 clients, I could assume that they are all still running. Are they? This is also easily checked:
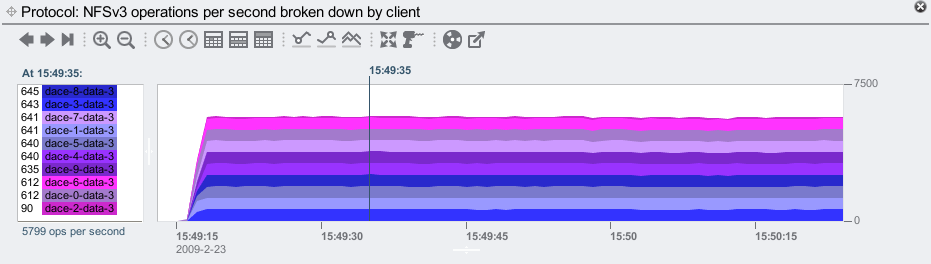
I see all 10 clients in the left panal, so they are still running. But there is something suspicious – the client dace-2-data-3 is performing far fewer NFSv3 ops than the other clients. For the selected time of 15:49:35, dace-2-data-3 performed 90 NFSv3 ops/sec while the rest of the clients performed over 600. In the graph, that client is plotted as a trickle on the top of the stacks, and at only a pixel or two high, it's difficult to see.
This is where it is handy to change the graph type from stacked to line, using the 5th icon from the right:
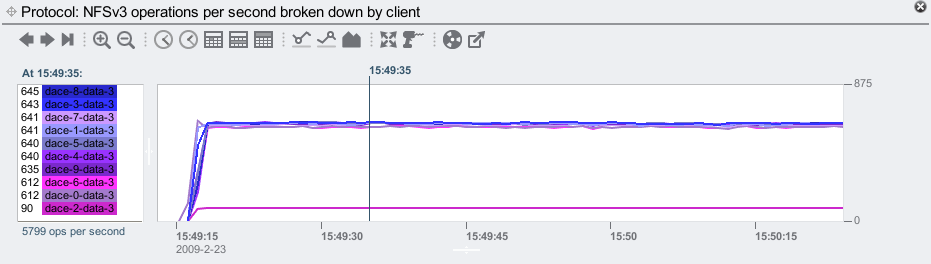
Rather than stacking the data to highlight its components, the line graphs plot those components separately, so that they can be compared with one another. This makes it pretty clear that dace-2-data-3 is an outlier, shown as a single line much lower than all others.
For some reason, dace-2-data-3 is performing fewer NFSv3 ops than its identical neighbors. Lets check if its network throughput is also lower:
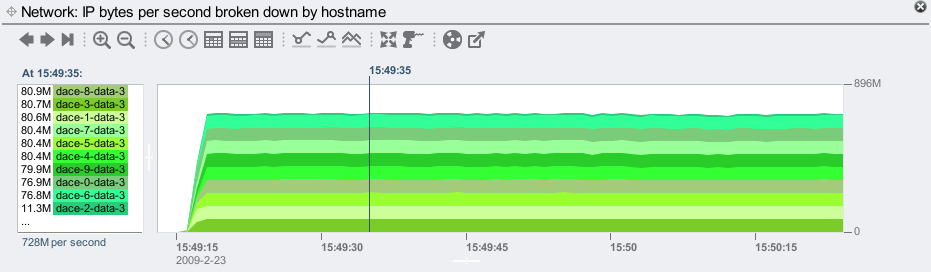
It is, running at only 11.3 Mbytes/sec. Showing this as a line graph:
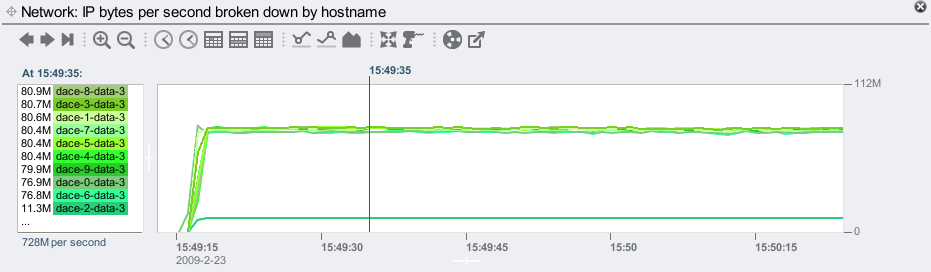
As before, the line graph highlights this client as an outlier.
Line Graphs
While I'm here, these line graphs are especially handy for comparing any two items (called breakdowns.) Click the first from the left panel, then shift-click a second (or more). For example:
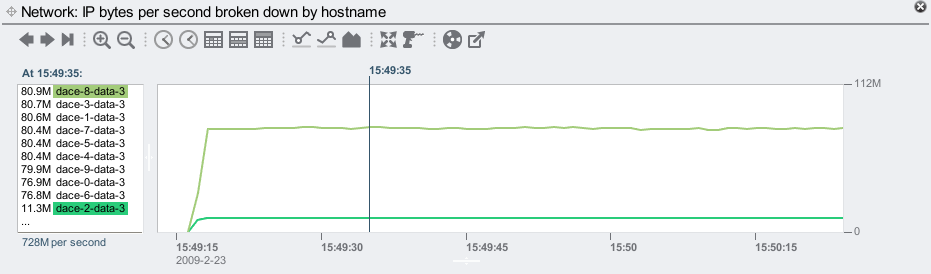
By just selecting one breakdown, the graph will rescale to fit it to the vertical height (note the units change on the top right):
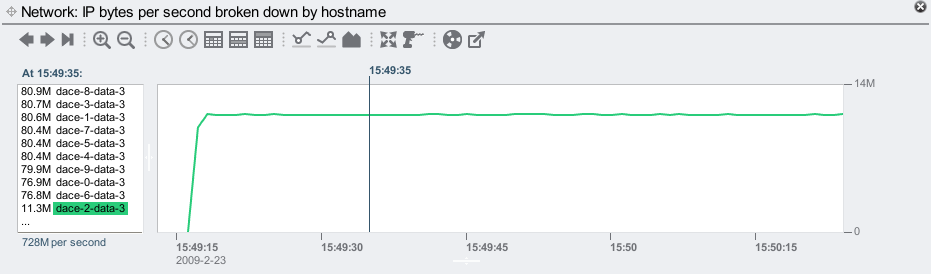
Variations in this client's throughput are now more clearly visible. Handy stuff...
Datasets
Another side topic worth mentioning is the datasets: archived statistics used by Analytics. So far I've used:
- Network bytes/sec by device
- NFSv3 ops/sec by operation
- NFSv3 ops/sec by-client
- IP bytes/sec by-hostname
There is a screen in the Sun Storage 7000 series interface to manage datasets:
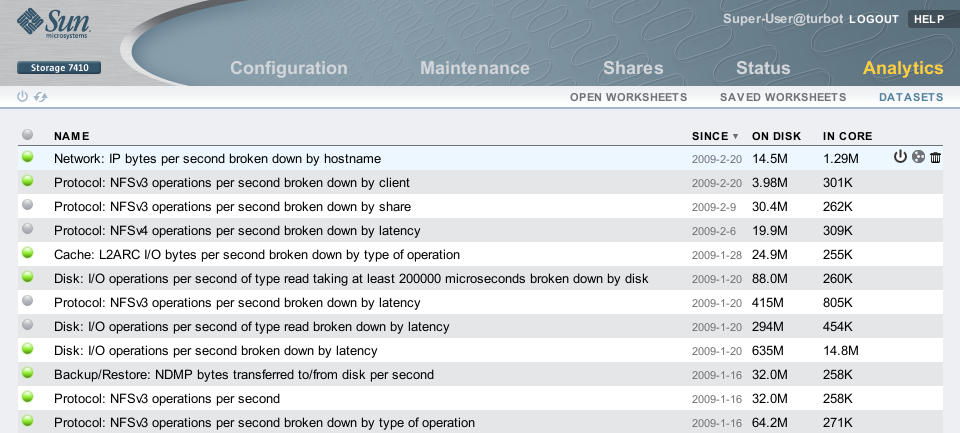
Here I've sorted by creation time, showing the newly created datasets at the top. The icons on the right include a power icon, which can suspend dataset collection. Suspended datasets show a gray light on the left, rather than green for enabled.
The by-client and by-hostname statistics require more CPU overhead to collect than the others, as these gather their data by tracing every network packet, aggregating that data, then resolving hostnames. These are some of the datasets that are DTrace based.
The overhead of DTrace based datasets is relative to the number of traced events, and how loaded the system is. The overhead itself is microscopic, however, if you multiply that by 100,000 on a busy system, it can become measurable. This system was pushing over 700 Mbytes/sec, which is approaching 100,000 packets/sec. The overhead (performance cost) for those by-client and by-hostname datasets was about 1.4% each. Tiny as this is, I usually suspend these when performing benchmarks (if they have been enabled – they aren't out of the box). With lighter workloads (lighter than 700+ Mbytes/sec), this overhead becomes lower as there is more CPU capacity available for collecting such statistics. So, you generally don't need to worry about the CPU overhead, unless you want to perform benchmarks.
The Problem
Back to the issue; The 11.3 Mbytes/sec value rings a bell. Converting bytes to bits, that's about 90 Mbit/sec – within 100 Mbit/sec. Hmm.. These are supposed to be 1 Gbit/sec interfaces. Is something wrong? On the client:
dace-2# dladm show-linkprop -p speed
LINK         PROPERTY        VALUE          DEFAULT        POSSIBLE
e1000g0      speed           100            --             10,100,1000
e1000g1      speed           1000           --             10,100,1000
Yes. The 1 Gbit/sec interface has negotiated to 100 Mbit. Taking a look at the physical port:

Confirmed! The port (in the center) is showing a yellow light on the right rather than a green light. There is a problem with the port, or the cable, or the port on the switch.
The Fix
Swapping the cable with one that is known-to-be-good fixed the issue – the port renegotiated to 1 Gbyte/sec:
dace-2# dladm show-linkprop -p speed
LINK         PROPERTY        VALUE          DEFAULT        POSSIBLE
e1000g0      speed           1000           --             10,100,1000
e1000g1      speed           1000           --             10,100,1000
And the client dace-2-data-3 is now running much faster:
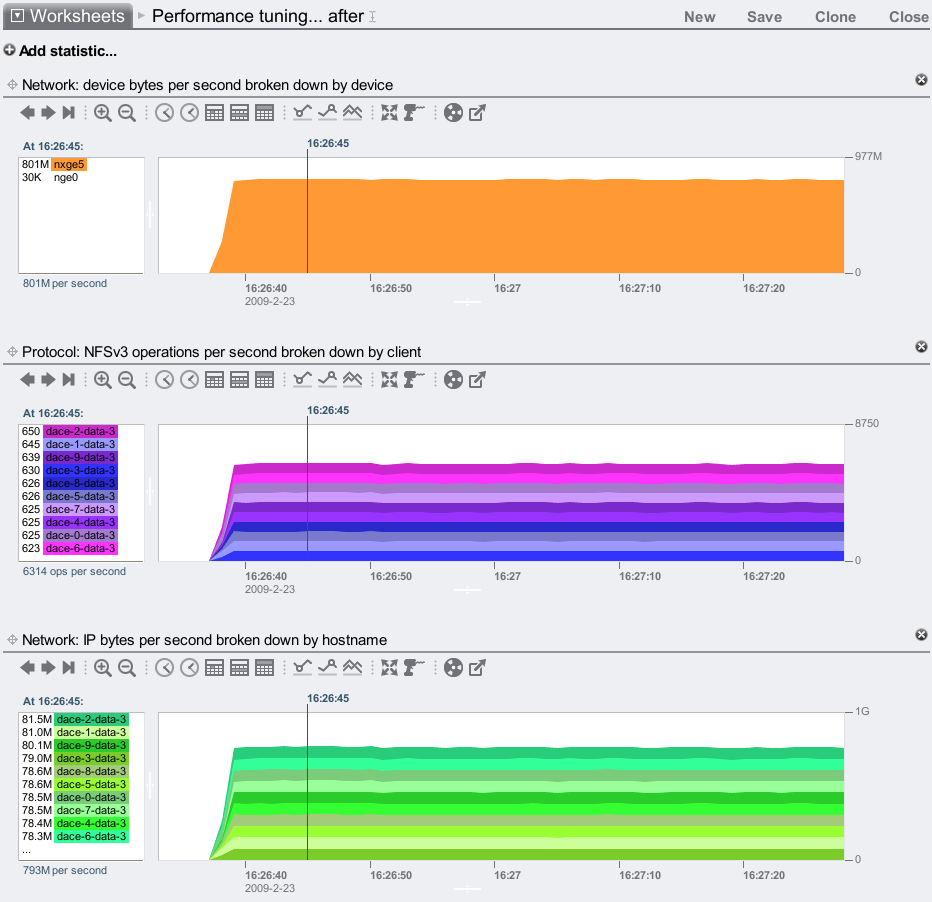
That's about a 9% performance win. Caused by a bad Ethernet cable, found by Analytics.