

I originally posted this at http://blogs.sun.com/brendan/entry/nfs_analytics_example.
I just tracked down a minor performance issue on my desktop in a couple of minutes, and thought it may make a good example to follow as it demonstrates using Analytics along with dtrace, truss, snoop and kstats – really the entire suite of perf tools I regularly use on Solaris.
I was downloading a file and happened to run the kstat based nicstat tool to watch network traffic. After the download finished, traffic continued:
brendan@deimos:~> nicstat 1
    Time     Int   rKB/s   wKB/s   rPk/s   wPk/s    rAvs    wAvs   %Util    Sat
20:53:30    nge0   10.81   13.13   35.77   37.69   309.4   356.6    0.02   0.00
20:53:30     lo0    0.00    0.00    0.00    0.00    0.00    0.00    0.00   0.00
    Time     Int   rKB/s   wKB/s   rPk/s   wPk/s    rAvs    wAvs   %Util    Sat
20:53:31    nge0   28.17   21.71   89.51   91.50   322.2   243.0    0.04   0.00
20:53:31     lo0    0.00    0.00    0.00    0.00    0.00    0.00    0.00   0.00
    Time     Int   rKB/s   wKB/s   rPk/s   wPk/s    rAvs    wAvs   %Util    Sat
20:53:32    nge0   26.18   19.71   84.15   85.14   318.6   237.0    0.04   0.00
20:53:32     lo0    0.00    0.00    0.00    0.00    0.00    0.00    0.00   0.00
    Time     Int   rKB/s   wKB/s   rPk/s   wPk/s    rAvs    wAvs   %Util    Sat
20:53:33    nge0   26.89   19.93   80.18   85.13   343.4   239.7    0.04   0.00
20:53:33     lo0    0.00    0.00    0.00    0.00    0.00    0.00    0.00   0.00
    Time     Int   rKB/s   wKB/s   rPk/s   wPk/s    rAvs    wAvs   %Util    Sat
20:53:34    nge0   26.89   21.50   88.14   91.11   312.3   241.6    0.04   0.00
20:53:34     lo0    0.00    0.00    0.00    0.00    0.00    0.00    0.00   0.00
^C
It's not much, but my desktop should be idle, and yet there are regular network reads and writes. I'd like to know what that is.
Running snoop should give me a quick idea of the traffic over the wire:
root@deimos:/> snoop -r | cut -c1-80
Using device nge0 (promiscuous mode)
192.168.1.109 -> 192.168.2.156 NFS C 4 (lookup valid) PUTFH FH=700C NVERIFY GETA
192.168.2.156 -> 192.168.1.109 NFS R 4 (lookup valid) NFS4ERR_SAME PUTFH NFS4_OK
192.168.1.109 -> 192.168.2.156 NFS C 4 (lookup valid) PUTFH FH=700C NVERIFY GETA
192.168.2.156 -> 192.168.1.109 NFS R 4 (lookup valid) NFS4ERR_SAME PUTFH NFS4_OK
192.168.1.109 -> 192.168.2.156 NFS C 4 (lookup valid) PUTFH FH=700C NVERIFY GETA
192.168.2.156 -> 192.168.1.109 NFS R 4 (lookup valid) NFS4ERR_SAME PUTFH NFS4_OK
192.168.1.109 -> 192.168.2.156 NFS C 4 (lookup valid) PUTFH FH=700C NVERIFY GETA
192.168.2.156 -> 192.168.1.109 NFS R 4 (lookup valid) NFS4ERR_SAME PUTFH NFS4_OK
192.168.1.109 -> 192.168.2.156 NFS C 4 (lookup valid) PUTFH FH=700C NVERIFY GETA
192.168.2.156 -> 192.168.1.109 NFS R 4 (lookup valid) NFS4ERR_SAME PUTFH NFS4_OK
[...]
That's not what I was expecting. I'm doing NFS traffic? The only NFS share I have mounted is my home directory, and I'm not doing any sustained I/O right now.
Fortunately my home directory server is a Sun Storage system, so I can examine the NFS traffic with Analytics from the server side:
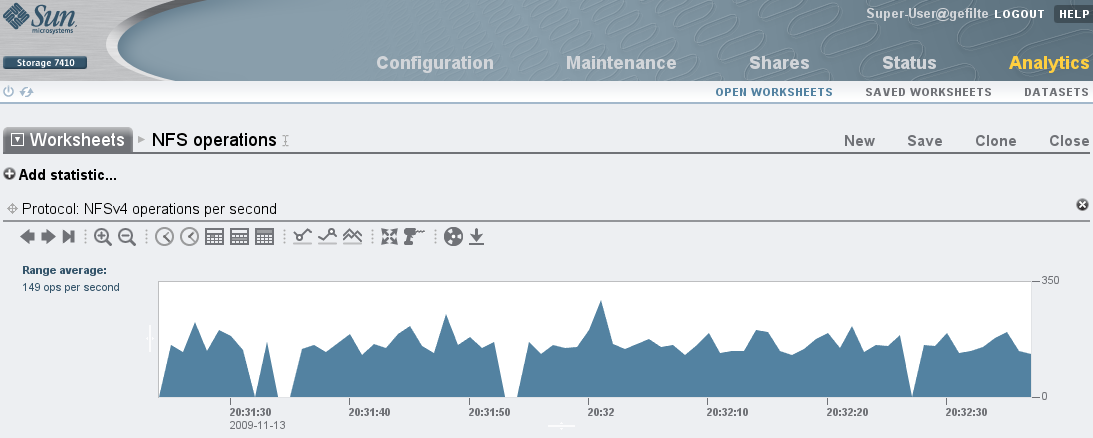
I'll begin by drilling down by client, as I know my desktop is "deimos":
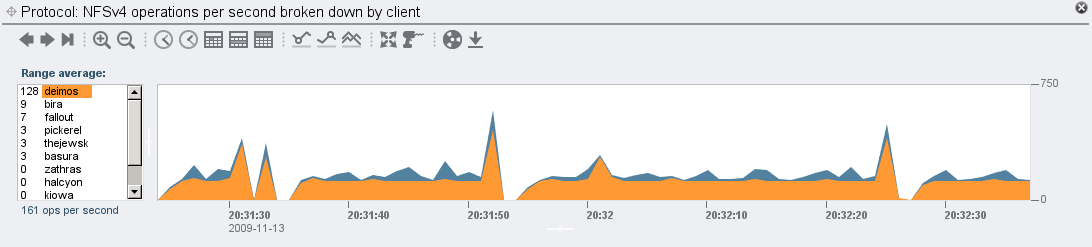
This shows I'm doing more NFS IOPS to the home directory server than anyone else.
Now to drill down further, by type of operation and by file:
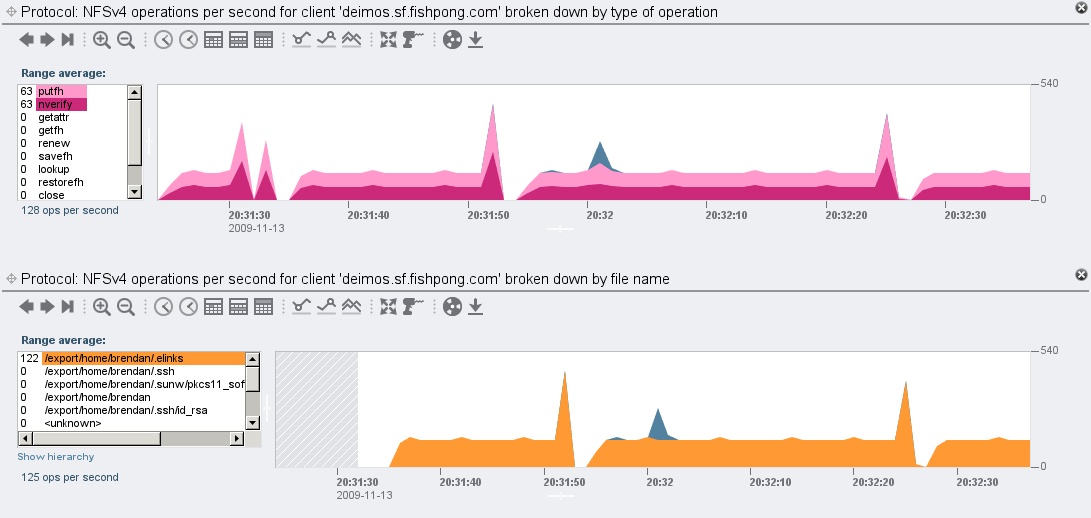
".elinks"? elinks is a text based browser that I use, a modern version of lynx.
Here's a screenshot of elinks viewing osnews:
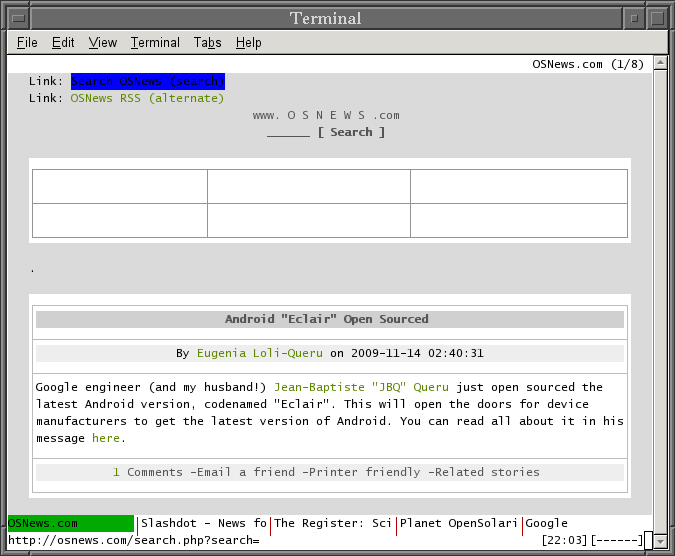
So why is elinks causing so much NFS traffic?
Right now I could aim DTrace at elinks to get a detailed view of what it is up to, but as I'm not worried about slowing the target in this case, I'll take a quick look with truss to start with (runs non-root by default, fewer keystrokes and inbuilt syscall translation):
brendan@deimos:~> truss -fp `pgrep elinks`
295062: pollsys(0x08047AC0, 3, 0x08047B68, 0x00000000)  = 0
295062: alarm(0)                                        = 0
295062: open64("/home/brendan/.elinks/formhist", O_RDONLY) Err#2 ENOENT
295062: time()                                          = 1258176283
295062: time()                                          = 1258176283
295062: time()                                          = 1258176283
295062: open64("/home/brendan/.elinks/formhist", O_RDONLY) Err#2 ENOENT
295062: time()                                          = 1258176283
295062: time()                                          = 1258176283
295062: time()                                          = 1258176283
295062: open64("/home/brendan/.elinks/formhist", O_RDONLY) Err#2 ENOENT
295062: time()                                          = 1258176283
295062: time()                                          = 1258176283
295062: time()                                          = 1258176283
295062: open64("/home/brendan/.elinks/formhist", O_RDONLY) Err#2 ENOENT
295062: time()                                          = 1258176283
295062: time()                                          = 1258176283
295062: time()                                          = 1258176283
295062: open64("/home/brendan/.elinks/formhist", O_RDONLY) Err#2 ENOENT
[...]
Ahh, elinks is repeatedly trying to read a non-existant file from my home directory, which is causing the NFS traffic.
To get an accurate read on the rate of these opens, I'll use dtrace to frequency count the filenames that were called with open() by elinks, printing a summary every second:
root@deimos:/> dtrace -n 'syscall::open*:entry /execname == "elinks"/ {
        @[copyinstr(arg0)] = count(); } tick-1sec { printa(@); clear(@); }'
dtrace: description 'syscall::open*:entry ' matched 3 probes
CPU     ID                    FUNCTION:NAME
  1  87538                       :tick-1sec
  /home/brendan/.elinks/formhist                                   63

  1  87538                       :tick-1sec
  /home/brendan/.elinks/formhist                                   63

  1  87538                       :tick-1sec
  /home/brendan/.elinks/formhist                                   63

^C
It's 63 opens per second, all of the ".elinks/formhist" file.
DTrace can dig deeper, shedding light as to why elinks is reading that file. I can just add "ustack()" as a second key to the DTrace aggregation used to frequency count filenames, to include the entire user stack trace:
root@deimos:/> dtrace -n 'syscall::open*:entry /execname == "elinks"/ {
@[copyinstr(arg0), ustack()] = count(); } tick-1sec { printa(@); clear(@); }'
dtrace: description 'syscall::open*:entry ' matched 3 probes
CPU     ID                    FUNCTION:NAME
  1  87538                       :tick-1sec
  /home/brendan/.elinks/formhist
              libc.so.1`__open64+0x7
              libc.so.1`_endopen+0xb8
              libc.so.1`fopen64+0x29
              elinks`load_formhist_from_file+0x57
              elinks`get_form_history_value+0x39
              elinks`draw_forms+0xec
              elinks`draw_view_status+0x1a
              elinks`draw_doc+0x3fd
              elinks`refresh_view+0x1b
              elinks`draw_formatted+0x115
              elinks`tabwin_func+0xb4
              elinks`term_send_event+0x154
              elinks`redraw_terminal+0x36
              elinks`redraw_leds+0xb2
              elinks`check_timers+0x87
              elinks`select_loop+0x19a
              elinks`main+0x43
              elinks`_start+0x80
               63
I'm not familiar with the elinks source, so I'll read from the bottom of the stack trace up, looking for high level functions. It looks generic until I get to redraw_leds(). leds? LEDs? There is a pseudo-LED text display in the bottom right of the screen. It's calling redraw_terminal(), which is calling refresh_view(), and then into load_formhist_from_file() – causing the file open.
Doing file opens with the frequent update of the status LEDs sounds like a bug, and perhaps a known one. A minute with google found that this was known and fixed in the next version of elinks.
While I was watching, the home directory server for fishworks was serving most of its NFS IOPS for a bug in elinks on my desktop. Which I can eliminate by upgrading my elinks version. This is an example of the best type of performance win: eliminating unnecessary work.