


I wouldn't dare run strace(1) in production without seriously considering the consequences, and first trying the alternates. While it's widely known (and continually rediscovered) that strace is an amazing tool, it's much less known that it currently is – and always has been – dangerous.
strace is the system call tracer for Linux. It currently uses the arcane ptrace() (process trace) debugging interface, which operates in a violent manner: pausing the target process for each syscall so that the debugger can read state. And doing this twice: when the syscall begins, and when it ends.
This means strace pauses your application twice for each syscall, and context-switches each time between the application and strace. It's like putting traffic metering lights on your application.
BUGS: A traced process runs slowly.
- – strace(1) man page
In some cases this doesn't matter. Your application might be completely broken to start with, or you could be running it in a test environment where speed is not a concern. In production, you'll want to be really careful, and think though the consequences (e.g., could this cause the target to fail-over due to exceeding latency thresholds?). Better, look for alternates to try first, like Linux perf_events.
Overhead
The performance overhead of strace is relative to the system call rate it is instrumenting. To put something of an upper bound on it, here is a simple worst-case test:
$ dd if=/dev/zero of=/dev/null bs=1 count=500k
512000+0 records in
512000+0 records out
512000 bytes (512 kB) copied, 0.103851 s, 4.9 MB/s
That finished in 0.103851 seconds.
Now with strace (here I'm tracing a syscall that is never called, accept(), but we pay the overhead anyway):
$ strace -eaccept dd if=/dev/zero of=/dev/null bs=1 count=500k
512000+0 records in
512000+0 records out
512000 bytes (512 kB) copied, 45.9599 s, 11.1 kB/s
That's 442x slower. It is worst-case, since dd(1) is performing syscalls as fast as it can.
Handy strace One-Liners
# Slow the target command and print details for each syscall:
strace command

# Slow the target PID and print details for each syscall:
strace -p PID

# Slow the target PID and any newly created child process, printing syscall details:
strace -fp PID

# Slow the target PID and record syscalls, printing a summary:
strace -cp PID

# Slow the target PID and print open() syscalls only:
strace -eopen -p PID

# Slow the target PID and print open() and stat() syscalls only:
strace -eopen,stat -p PID

# Slow the target PID and print connect() and accept() syscalls only:
strace -econnect,accept -p PID

# Slow the target command and see what other programs it launches (slow them too!):
strace -qfeexecve command

# Slow the target PID and print time-since-epoch with (distorted) microsecond resolution:
strace -ttt -p PID

# Slow the target PID and print syscall durations with (distorted) microsecond resolution:
strace -T -p PID
How To Learn strace
There's much you can learn about interpreting strace output. The following two steps should get you started with key system calls.
1. Learn Key Syscalls
You should know what the following 12 key system calls do, which you'll see regularly in strace output. Test your knowledge! How many of these do you know? Mouse-over for answers.
| syscall | what it does |
|---|---|
| read | read bytes from a file descriptor (file, socket) |
| write | write bytes from a file descriptor (file, socket) |
| open | open a file (returns a file descriptor) |
| close | close a file descriptor |
| fork | create a new process (current process is forked) |
| exec | execute a new program |
| connect | connect to a network host |
| accept | accept a network connection |
| stat | read file statistics |
| ioctl | set I/O properties, or other miscellaneous functions |
| mmap | map a file to the process memory address space |
| brk | extend the heap pointer |
Click here to reveal all. Each syscall has a man page, so if you are at the command line, it should only take a few seconds to jog your memory.
There are variants of these syscalls, so you may see "execve" for "exec", and "pread" as well as "read". There should be man pages for these, too.
2. Simple strace Example
You can practice and learn strace by aiming it at some basic commands: ls(1), sleep(1), ssh(1), etc.
Lets strace the venerable ls -l as our first example. We'll list /etc so that there are plenty of files to examine, and the output is mostly what you expect (listing files) and not program startup and initialization.
The output starts by showing program initialization:
$ strace ls -l /etc
execve("/bin/ls", ["ls", "-l", "/etc"], [/* 35 vars */]) = 0
brk(0)                                  = 0x9a5000
mmap(NULL, 4096, PROT_READ|PROT_WRITE, MAP_PRIVATE|MAP_ANONYMOUS, -1, 0) = 0x7f9336828000
access("/etc/ld.so.preload", R_OK)      = -1 ENOENT (No such file or directory)
open("/etc/ld.so.cache", O_RDONLY|O_CLOEXEC) = 3
fstat(3, {st_mode=S_IFREG|0644, st_size=19218, ...}) = 0
mmap(NULL, 19218, PROT_READ, MAP_PRIVATE, 3, 0) = 0x7f9336823000
close(3)                                = 0
[...]
The execve() variant is used to run /bin/ls, then libraries are pulled in. There'll be multiple groups beginning with an open() of a /lib* location and ending in close().
As an example of reading a single line: take a look at the open() line, and also the open(2) man page. The man page summarizes this syscall as:
       int open(const char *pathname, int flags);
       int open(const char *pathname, int flags, mode_t mode);
It also explains these arguments in detail, and the return value. So, our "pathname" was "/etc/ld.so.cache", and the flags were O_RDONLY|O_CLOEXEC. It returned 3, a file descriptor for later use with other syscalls.
Later in the output the real action begins:
openat(AT_FDCWD, "/etc", O_RDONLY|O_NONBLOCK|O_DIRECTORY|O_CLOEXEC) = 3
getdents(3, /* 169 entries */, 32768)   = 5280
lstat("/etc/motd", {st_mode=S_IFLNK|0777, st_size=25, ...}) = 0
lgetxattr("/etc/motd", "security.selinux", 0x9b58f0, 255) = -1 ENODATA (No data available)
readlink("/etc/motd", "/var/lib/update-motd/motd", 26) = 25
lstat("/etc/gdbinit.d", {st_mode=S_IFDIR|0755, st_size=4096, ...}) = 0
lgetxattr("/etc/gdbinit.d", "security.selinux", 0x9b5950, 255) = -1 ENODATA (No data available)
getxattr("/etc/gdbinit.d", "system.posix_acl_access", 0x0, 0) = -1 ENODATA (No data available)
getxattr("/etc/gdbinit.d", "system.posix_acl_default", 0x0, 0) = -1 ENODATA (No data available)
[...]
This opens /etc and reads the directory entries (getdents()), then for each file it calls lstat(), a stat() variant, and two extended attribute varients: lgetxattr() and getxattr(). getxattr() is called twice, once for each namespace: see its second argument.
After collecting all this file information, ls(1) begins printing it out, sorted:
clock_gettime(CLOCK_REALTIME, {1399855888, 841769117}) = 0
write(1, "drwxr-xr-x  4 root root    4096 "..., 50drwxr-xr-x  4 root root    4096 Dec 10 23:47 acpi
) = 50
stat("/etc/localtime", {st_mode=S_IFREG|0644, st_size=118, ...}) = 0
write(1, "-rw-r--r--  1 root root      16 "..., 53-rw-r--r--  1 root root      16 Dec 10 23:48 adjtime
) = 53
stat("/etc/localtime", {st_mode=S_IFREG|0644, st_size=118, ...}) = 0
write(1, "-rw-r--r--  1 root root    1512 "..., 53-rw-r--r--  1 root root    1512 Jan 12  2010 aliases
) = 53
stat("/etc/localtime", {st_mode=S_IFREG|0644, st_size=118, ...}) = 0
write(1, "-rw-r-----  1 root smmsp  12288 "..., 56-rw-r-----  1 root smmsp  12288 Dec 10 23:47 aliases.db
) = 56
stat("/etc/localtime", {st_mode=S_IFREG|0644, st_size=118, ...}) = 0
write(1, "drwxr-xr-x  2 root root    4096 "..., 58drwxr-xr-x  2 root root    4096 Apr 25 20:47 alternatives
) = 58
[...]
The output is a little messed up since ls -l and strace are writing to the same terminal. The write() syscalls are printing a line of output for each file, and ...
WTF?? Why is ls(1) running stat() on /etc/localtime for every line of output?
Performance Tuning ls(1)
A quick search online (I would have hit up the ls(1) source next) explained the problem seen here: my TZ environment variable is not set. Setting it eliminated those stat() /etc/localtime calls.
So I just found a performance win with this simple example. Oh, um, I meant it this way, of course!
Coaxing ls(1) to run long enough to take a performance measurement:
$ time ls -l `perl -e 'print "/etc " x 1000'` >/dev/null

real    0m3.562s
user    0m1.004s
sys 0m2.464s
And with the fix:
$ time TZ=US/Pacific ls -l `perl -e 'print "/etc " x 1000'` >/dev/null

real    0m2.753s
user    0m0.804s
sys 0m1.868s
I just improved performance by 23% (2.753s vs 3.562s). Not bad. (I wouldn't get too excited about finding and eliminating stat()s, though, as they are a fast syscall, and wins are not usually this high.)
This is a good example of the type of performance issues that strace is good at identifying: problems of the load applied. While we discovered it by fishing around with strace, this would also be found by following a performance methodology: workload characterization, for system calls.
Since it can distort time measurements so severely (although it does have a "-O overhead" option, and heuristic, to try to compensate), strace is not so good at determining performance issues involving latency. It also is of much less use outside of the syscall interface, for example if the performance issue was deeper in the kernel or application.
Versus Advanced Tracers
Comparing the current version of strace (e.g., ver 4.8) vs current versions of perf_events/ktap/SystemTap/LTTng/dtrace4linux (as per 2014).
Pros:
- strace is simple. Syscalls only. POSIX command line interface.
- Automatic meaningful output for each syscall type. Don't have to code this yourself.
- Widely available and mature.
Cons:
- WARNING: Can cause significant and sometimes massive performance overhead, in the worst case, slowing the target application by over 100x. This may not only make it unsuitable for production use, but any timing information may also be so distorted as to be misleading.
- Can't trace multiple processes simultaneously (with the exception of followed children).
- Visibility is limited to the system call interface.
There is a possible con: in the past, strace has had bugs which can leave the target process, or its followed children, in the STOP state (e.g., here, here). This could cause a serious production outage, as the application is now frozen mid-flight. If you realize this immediately and can fix it (kill strace, then kill -CONT the process), then you may avoid a serious outage. However, you may still have caused a burst of application requests with multi-second latency (outliers), depending on how quickly you typed in the kill command.
If you'd like to write a blog post about how awesome strace is and show a case study of its use, then great, but please copy the above WARNING bullet point.
Did you know?
- strace is banned in France, where it is classified as a cracking tool (it can trace plain-text I/O).
- strace is designed to operate at the system call layer, also called its "test depth".
- In the latest development version (12.1), strace has an easter egg: with "-VV" it begins the trace by printing "DIVE! DIVE!", and playing an aah-WOO-gah alarm on /dev/audio.
- The first strace is on display at the Computer History Museum in San Jose. It was made in 1961 using wire wrapped circuitry and core memory, and could trace up to 12 system calls per second. Within its sheet metal enclosure are four seats: for the surgeon, co-pilot, and their two secretaries. It could stay submerged at syscall depth for up to 9 hours.
- In 1963, Digital Electronics released a cheaper 2-seater version of strace, which was enormously popular.
- The largest strace is the Soviet "Tacti-call" class, which can remain at syscall depth for over 120 days, and has a maximum crew of 160. It is nuclear powered, and has 4 forward and 2 aft signal tubes, each typically armed with type 9 signals.
- On the bottom of San Francisco bay are several thousand unused straces, which were intended for Y2K issues that never arose, and so were scuttled.
- The rarely seen presidential "strace one" is an advanced model that is rumored to operate below syscall depth; however, its specifications are classified.
- In the worst Twitter outage of 2013, engineers were forced to take their strace below crush depth (also called "collapse depth"). They survived the depth and located the root cause, but were then eaten by the fail whale.
More About strace
Since the following appear to lack overhead warnings, I added a confirmation box on the links:
- The Magic of Strace (2014)
- Debugging obscure Postgres problems with strace (2013)
- Using strace to Debug Stuck Celery Tasks (2013)
- Diagnosing Magento speed issues with strace (2012)
- Strace -- The Sysadmin's Microscope (2010)
- strace: for fun, profit, and debugging. (2008)
- Introducing strace - a System call tracing and Signal reporting tool (2008)
- 5 simple ways to troubleshoot using Strace (2008)
These can be useful as they show case studies for real issues, and also provide different perspectives based on each author's area of interest and expertise for applying strace.
If you'd like to learn more about strace internals and ptrace(), I recommend:
Beyond strace
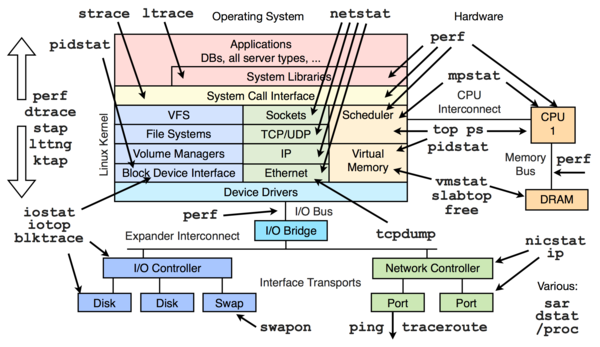
There are many articles and posts on strace(1), as well as tcpdump(8) and top(1), but few on harder Linux observability tools and frameworks, like ltrace (library trace), perf_events, tracepoints, kprobes, uprobes, etc. I joked about this in my SCaLE12x keynote, showing a simplified Linux internals diagram composed of only top, strace, and tcpdump!
strace has limited visibility: (an instrumentable version of) the syscall interface. My Linux performance observability tools diagram on the right shows the scope of strace vs other tools. Now, much can be inferred about kernel activity from the syscall requests, but there are plenty of areas for which you have no direct visibility. Browse the diagram to see the other tools you can use to go beyond strace.
I usually skip strace and go straight to these other tools, like perf (perf_events) or one of the other in-development Linux dynamic tracers. These give me deeper visibility, lower overhead, and customizable output. Although, sometimes the quickest route is just firing up strace, and I will, if the overhead is acceptable.
strace Future
strace(1) is a great tool, but the current version (using ptrace()) can slow down the target severely. Be aware of the overhead strace causes, and consider other alternates for Linux that use lower-cost buffered tracing. These include perf_events, sysdig, ktap, and SystemTap. Many of these also allow custom kernel summaries, reducing overheads further.
Linux 3.7 introduced perf trace, a buffered strace-like subcommand for perf_events, which was introduced as an "alternate to strace". There is also sysdig, which allows custom filters and output. It's quite possible that in the future strace will become a wrapper to one of these, and all my warnings about the overheads will be out of date (it won't mean that overheads can be ignored, though!).
Click here for Disqus comments (ad supported).