

Is Intel Turbo Boost running for my AWS EC2 cloud instance (which is a Xen guest)?
ec2-guest# ./showboost
CPU MHz     : 2500
Turbo MHz   : 2900 (10 active)
Turbo Ratio : 116% (10 active)
CPU 0 summary every 5 seconds...

TIME       C0_MCYC      C0_ACYC        UTIL  RATIO    MHz
06:11:35   6428553166   7457384521      51%   116%   2900
06:11:40   6349881107   7365764152      50%   115%   2899
06:11:45   6240610655   7239046277      49%   115%   2899
06:11:50   6225704733   7221962116      49%   116%   2900
[...]
Yes! These 2500 MHz CPUs are currently running at 2900 MHz.
I guess the CPUs are cold enough to boost. What's their temperature?
ec2-guest# ./cputemp 1
CPU1 CPU2 CPU3 CPU4 CPU5 CPU6 CPU7 CPU8 CPU9 CPU10 CPU11 CPU12 CPU13 CPU14 CPU15 CPU16
70 68 68 65 63 63 61 60 68 64 64 63 62 61 70 68
70 68 69 65 63 63 61 61 68 65 63 63 61 61 70 69
70 69 69 65 63 63 61 60 69 65 64 63 61 61 69 69
69 69 69 66 64 64 61 61 68 65 64 64 61 61 70 69
[...]
Relatively cool: between 60 and 70 degrees Celsius. This is another tool from my msr-cloud-tools.
In this post I'll describe MSRs, how to read them, and why measuring turbo boost is important.
Model Specific Registers (MSRs)
Aka machine specific registers, these are described in Vol 3c of the Intel 64 and IA-32 Architectures Software Developer's Manual. They access low level CPU information, including turbo boost ratios and temperature readings. They are read and written using the RDMSR and WRMSR instructions.
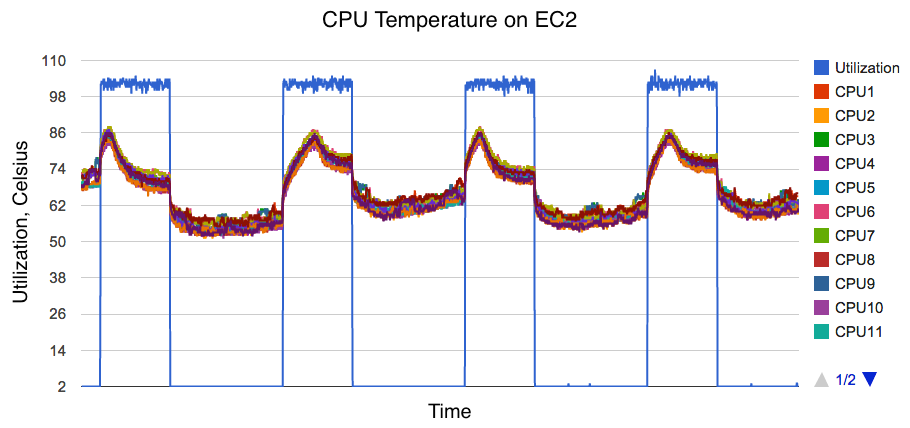
The image on the right shows how CPU temperatures, measured using MSRs on an EC2 instance, vary based on CPU utilization (in blue). The workload is synthetic: all CPUs driven to 100% utilization for 5 minutes, then to 0% for a while, repeat. What's interesting is that temperature rises initially with CPU load, then drops sharply. Did system fans kick in? (So far I haven't found fan RPM MSRs, to confirm.)
I'm usually focused on the performance monitoring counters (PMCs; aka performance instrumentation counters (PICs), CPU performance counters (CPCs), etc.). These are read by RDPMC, and described in Vol 3b of the same manual. These can measure data cache misses, stall cycles, and other useful performance events.
On AWS EC2, within a cloud instance (Xen guest), PMCs aren't available, as you'll see with, say, "perf stat". That doesn't mean they can't ever work, just that they (or their controlling MSRs) aren't currently available.
But a small handful of MSRs are available on EC2. Here are the more interesting ones I've found:
| Reg | Name | Description |
|---|---|---|
| 0xe7 | IA32_MPERF | Bits 63:0 is TSC Frequency Clock Counter C0_MCNT TSC relative |
| 0xe8 | IA32_APERF | Bits 63:0 is TSC Frequency Clock Counter C0_ACNT actual clocks |
| 0x19c | IA32_THERM_STATUS | Bits 22:16 is the CPU therm status digital readout (DO) |
| 0x1a2 | MSR_TEMPERATURE_TARGET | Bits 23:16 is temp target (TT) |
| 0x1ad | MSR_TURBO_RATIO_LIMIT | Bits 7:0 is the turbo boost ratio (x100 for MHz) for 1 core active |
| 0x1ae | MSR_TURBO_RATIO_LIMIT1 | Bits 15:8 (for example) is the turbo boost ratio for 10 cores active |
These are used by various kernel routines, like the idle thread and cpufreq.
Note that these are model specific, which means they can vary between different processor models (micro-architectures). For example, Silvermont has a read/write target offset in MSR_TEMPERATURE_TARGET (bits 29:24), which can lower the throttle temperature (PROCHOT). Such differences make MSRs non-portable and tricky to use, which is why standards like PAPI are important.
Reading MSRs
Here's how you can measure MSRs (assuming Intel):
1. Determine your CPU type and micro-architecture
# head /proc/cpuinfo
processor       : 0
vendor_id       : GenuineIntel
cpu family      : 6
model           : 62
model name      : Intel(R) Xeon(R) CPU E5-2670 v2 @ 2.50GHz
[...]
The family and model numbers tell us that this is the Ivy Bridge micro-architecture (see the Intel decoder). You can also use the cpuid tool (from the cpuid package), which should report micro-architecture directly.
2. Look up MSRs for your processor type
These are in Vol 3c of the Intel software developer manual. This is a 540 page volume, and if you're new to it, you'll get lost a few times before you get the hang of it.
3. Install and load msr-tools:
# apt-get install msr-tools
# modprobe msr
(Assuming Ubuntu.) The msr-tools package adds the rdmsr and wrmsr tools, and the msr kernel module.
4. Use rdmsr
Based on the addresses from (2). Eg, to read the turbo boost ratio when 10 cores are active (Ivy Bridge):
# rdmsr 0x1ae -f 15:8 -d
29
Multiply by 100 to get MHz. The way these work is explained earlier in the manual.
I did share a couple of tools in a msr-cloud-tools collection, however, I've only written them for the processor type I'm currently analyzing. You may need to edit them to use the right MSRs.
Why Measure Turbo Boost
We live in an annoying age for computer performance analysts: the error margin for many measurements is over 10%, thanks to turbo boost, the Intel processor technology that can dynamically over-clock CPUs. Ubuntu is 10% faster than CentOS? Could just be turbo boost. New software version regressed by 5%? Could just be turbo boost. Tunable made things 10% faster? Could just be ... You get the picture.
Turbo boost can make a 2500 MHz processor run at 3300 Mhz, depending on factors including temperature, power consumption, and the C-state of the cores. Colder servers run faster. I once had two identical servers at the top and bottom of a rack, and the top server ran 5% faster, as it received more cold air from the air conditioners. That's both great and maddening: I'll take the better performance, but it can also mess up measurements when I'm comparing systems or software.
There are three ways I've historically dealt with this:
- Turn off turbo boost in the BIOS when doing performance comparisons.
- Measure actual CPU cycles using CPU performance counters to observe the turbo boost rate.
- Run a short experiment (benchmark) to measure the current cycle rate, eg, noploop.
If you run your own datacenter, you can do them all. But as a Xen guest on AWS EC2, you can't change the BIOS and do (1). You can do option (3), but that can be time-consuming and difficult (less reliable) on very busy systems. Until recently, I thought you couldn't do (2), either, and then I found the MSRs...
Discovering MSRs
I was working on a suspected turbo boost issue when a colleague at Netflix, Scott, mentioned that he liked using the i7z command to debug turbo boost. We didn't think it would work on EC2, but I tried anyway.
Most of the output was clearly wrong, but a lone column of temperature readings showed that something was working. Using opensnoop from my ftrace perf-tools collection to see how:
# ./opensnoop -n i7z
Tracing open()s issued by process name "i7z". Ctrl-C to end.
COMM             PID      FD FILE
i7z              8427    0x3 /proc/cpuinfo
i7z              8427    0x3 /dev/cpu/0/msr
i7z              8427    0x3 /dev/cpu/0/msr
i7z              8427    0x3 /dev/cpu/0/msr
i7z              8427    0x3 /dev/cpu/0/msr
[...]
This showed that i7z was reading /dev/cpu/0/msr, and led me to take a close look at the available MSRs.
I'd normally use CPU_CLK_Unhalted.Core, but that wasn't available. After some digging, I found I could use the ratio of IA32_APERF deltas to IA32_MPERF deltas, which shows how much faster the time stamp counter (TSC, which is cycle-based) is moving when the processor is in the C0 state.
It was an enormous relief to find a way to directly measure real clock rates, and turbo boost. My error margins have vanished: I can measure performance again.
Security Anecdote
(Update) When I discovered I could access MSRs in EC2, I ran various Internet searches ("EC2 MSR", "AWS MSR", "Xen MSR", "Cloud MSR", etc.) and found nothing. It wasn't a topic anyone had posted about. I thought it'd be useful to share it here, and be the first to tell the World about MSRs in the cloud. A good story for Netflix engineering: Leading the way with low-level debugging.
But this could also backfire. I'd previously found odd things like kernel panics and published them, and I would then see security researchers follow up with vulnerabilities based on what I'd shared. And those are the good guys! (The bad guys find but don't share.) MSRs are an unusual resource, and can be used to modify hardware settings. Might there be EC2 vulnerabilities?
Nowadays I'd ask our security team and AWS to investigate. But in 2014 I was a new employee and figured I'd check them out myself, especially since I had previously worked in security. I developed a fuzzer to step through all the possible MSRs, writing different values to check the results. Meanwhile, I checked various attributes of the system including dmesg for any induced failures. Nothing bad happened, and writes to many MSRs were simply denied. It seemed that AWS had already considered the security implications and built an MSR firewall.
I chatted to others including my manager about going public, and there was a concern that AWS may disable them if they deemed them to overshare info between VMs. I thought it unlikely as the info they provide gives little such insight. It's temperatures, power usage, and other broad metrics.
And so I went public with this post on Sep 15, 2014, and included MSRs in my Sep 25 Surge talk in Baltimore: From Clouds to Roots (slides 84 to 87). On Sep 26 I was back at work where I found the CORE SRE team buzzing with activity: AWS had announced a global cloud reboot! While Netflix routinely tests recovery from the loss of availability zones, this would test losing everything – the entire cloud – and our ability to recover from having no services online. The CORE team was exploring the boot up procedure, what happens if certain services are booted before others, and how to fix things if they fail.
Meanwhile, I had a sinking feeling. I messaged Joe, our technical account manager (TAM), feeling somehow guilty: "did I cause this? Is this about MSRs?" he replied that he didn't think so, as he'd heard it was Xen, but he didn't know the full details as they were under embargo.
That embargo expired on Oct 1 and I finally saw the vulnerability summary:
"Xen Security Advisory 108 (CVE-2014-7188) - Improper MSR range used for x2APIC emulation"
It was MSRs! I knew no one was looking at these on EC2 until this post. I contacted our TAM again "this really was me, wasn't it?" He didn't confirm or deny this time, but did reply: "next time you find something interesting on our processors, please tell us first!"
That's the story of how I was likely partly responsible for the 2014 global cloud reboot. Kudos to Jan Beulich for finding the vulnerability (XSA-108) and AWS for getting it fixed and deployed before the details were made public. AWS also disabled the temperature MSRs afterwards, and I've teased our TAM ever since: "When are we getting our temperatures back?" (That's when I'm not asking him about PEBS.)
Conclusion
A handful of model-specific registers, MSRs, are available in Xen guests including on AWS EC2. These allow the real clock rate, and the degree of turbo boost, to be measured. This is important to know for any performance comparison, as variations in turbo boost can skew results by over 10%, based on how hot or cold servers were during the test.
I've written a couple of tools so far, in msr-cloud-tools, to measure CPU turbo boost and temperature. As is the nature of MSRs, they are specific to processor types, and these scripts only work (so far) on our Intel(R) Xeon(R) CPU E5-2670 v2s. If you want to use these tools or MSRs yourself, you may need to find out the right MSRs to use for your processor type. The good news is that the vendor documentation from Intel and AMD is very good, although it takes some time to dig through.
Click here for Disqus comments (ad supported).