

Here's a quick tour of some new open source tools which I demonstrated at the Silicon Valley Linux Technology meetup last night. These use the new eBPF capabilities added in recent Linux, including Linux 4.3.
Summarizing the distribution of disk I/O latency:
# ./biolatency
Tracing block device I/O... Hit Ctrl-C to end.
^C
     usecs           : count     distribution
       0 -> 1        : 0        |                                      |
       2 -> 3        : 0        |                                      |
       4 -> 7        : 0        |                                      |
       8 -> 15       : 0        |                                      |
      16 -> 31       : 0        |                                      |
      32 -> 63       : 0        |                                      |
      64 -> 127      : 1        |                                      |
     128 -> 255      : 12       |********                              |
     256 -> 511      : 15       |**********                            |
     512 -> 1023     : 43       |*******************************       |
    1024 -> 2047     : 52       |**************************************|
    2048 -> 4095     : 47       |**********************************    |
    4096 -> 8191     : 52       |**************************************|
    8192 -> 16383    : 36       |**************************            |
   16384 -> 32767    : 15       |**********                            |
   32768 -> 65535    : 2        |*                                     |
   65536 -> 131071   : 2        |*                                     |
Tracing per-disk I/O:
# ./biosnoop
TIME(s)        COMM           PID    DISK    T  SECTOR    BYTES   LAT(ms)
0.000004001    supervise      1950   xvda1   W  13092560  4096       0.74
0.000178002    supervise      1950   xvda1   W  13092432  4096       0.61
0.001469001    supervise      1956   xvda1   W  13092440  4096       1.24
0.001588002    supervise      1956   xvda1   W  13115128  4096       1.09
1.022346001    supervise      1950   xvda1   W  13115272  4096       0.98
1.022568002    supervise      1950   xvda1   W  13188496  4096       0.93
1.023534000    supervise      1956   xvda1   W  13188520  4096       0.79
1.023585003    supervise      1956   xvda1   W  13189512  4096       0.60
Tracing the open() syscall:
# ./opensnoop
PID    COMM               FD ERR PATH
17326  <...>               7   0 /sys/kernel/debug/tracing/trace_pipe
17358  run                 3   0 /lib/x86_64-linux-gnu/libtinfo.so.5
17358  run                 3   0 /lib/x86_64-linux-gnu/libdl.so.2
17358  run                 3   0 /lib/x86_64-linux-gnu/libc.so.6
17358  run                -1   6 /dev/tty
17358  run                 3   0 /proc/meminfo
17358  run                 3   0 /etc/nsswitch.conf
Counting VFS operation types:
# ./vfsstat
TIME         READ/s  WRITE/s CREATE/s   OPEN/s  FSYNC/s
18:35:35:       241       15        4       99        0
18:35:36:       232       10        4       98        0
18:35:37:       244       10        4      107        0
18:35:38:       235       13        4       97        0
18:35:39:      6749     2633        4     1446        0
18:35:40:       277       31        4      115        0
Counting kernel function calls per-second, that match "tcp*send*":
# ./funccount -i 1 'tcp*send*'
Tracing... Ctrl-C to end.

ADDR             FUNC                          COUNT
ffffffff816d2281 tcp_send_delayed_ack             30
ffffffff816d6c81 tcp_v4_send_check                31
ffffffff816c2f61 tcp_sendmsg                      31
ffffffff816bf851 tcp_send_mss                     31

ADDR             FUNC                          COUNT
ffffffff816d1db1 tcp_send_fin                      3
ffffffff816d0f71 tcp_send_ack                     18
ffffffff816d2281 tcp_send_delayed_ack            214
ffffffff816c2f61 tcp_sendmsg                     231
ffffffff816bf851 tcp_send_mss                    231
ffffffff816d6c81 tcp_v4_send_check               255

ADDR             FUNC                          COUNT
ffffffff816d0f71 tcp_send_ack                      2
ffffffff816d2281 tcp_send_delayed_ack              9
ffffffff816c2f61 tcp_sendmsg                      30
ffffffff816bf851 tcp_send_mss                     30
Timing tcp_sendmsg() latency (call duration), in microseconds:
# ./funclatency -u tcp_sendmsg
Tracing tcp_sendmsg... Hit Ctrl-C to end.
^C
     usecs           : count     distribution
       0 -> 1        : 20778    |**************************************|
       2 -> 3        : 15429    |****************************          |
       4 -> 7        : 355      |                                      |
       8 -> 15       : 171      |                                      |
      16 -> 31       : 106      |                                      |
      32 -> 63       : 9        |                                      |
Detaching...
... all of these tools have man pages, and most have help messages as well:
# ./funclatency -h
usage: funclatency [-h] [-p PID] [-i INTERVAL] [-T] [-u] [-m] [-r] pattern

Time kernel funcitons and print latency as a histogram

positional arguments:
  pattern               search expression for kernel functions

optional arguments:
  -h, --help            show this help message and exit
  -p PID, --pid PID     trace this PID only
  -i INTERVAL, --interval INTERVAL
                        summary interval, seconds
  -T, --timestamp       include timestamp on output
  -u, --microseconds    microsecond histogram
  -m, --milliseconds    millisecond histogram
  -r, --regexp          use regular expressions. Default is "*" wildcards
                        only.

examples:
    ./funclatency do_sys_open       # time the do_sys_open() kenel function
    ./funclatency -u vfs_read       # time vfs_read(), in microseconds
    ./funclatency -m do_nanosleep   # time do_nanosleep(), in milliseconds
    ./funclatency -mTi 5 vfs_read   # output every 5 seconds, with timestamps
    ./funclatency -p 181 vfs_read   # time process 181 only
    ./funclatency 'vfs_fstat*'      # time both vfs_fstat() and vfs_fstatat()
Linux 4.3+, eBPF
What's new in Linux 4.3 is the ability to print strings from Extended Berkeley Packet Filters (eBPF) programs. This is only a small addition, but one I needed for many tools. eBPF is a virtual machine for running user-defined, sandboxed bytecode, with maps for data storage. I wrote about it in eBPF: One Small Step.
eBPF enhances Linux tracing, allowing mini programs to be executed on tracing events. In my tools above, eBPF lets me tag events with custom timestamps, store histograms, filter events, and only emit summarized info to user-level. These capabilities give me the info I want, with the lowest possible overhead cost.
While eBPF provides amazing superpowers, there is a catch: it's hard to use via its assembly or C interface. The challenge attracts me, but it can be a brutal experience, especially if you write eBPF assembly directly (eg, see bpf_insn_prog[] from sock_example.c; I've yet to code one of these from scratch that compiles). The C interface is better (see other examples in samples/bpf), but it's still laborious and difficult to use.
Enter bcc
The BPF Compiler Collection (bcc) project provides a front-end for eBPF, making it easier to write programs. It uses C for the back-end instrumentation, and Python for the front-end interface. My tools at the start of this post all use bcc, and can be found in the tools directory of bcc on github. Also browse that directory for the _example.txt files.
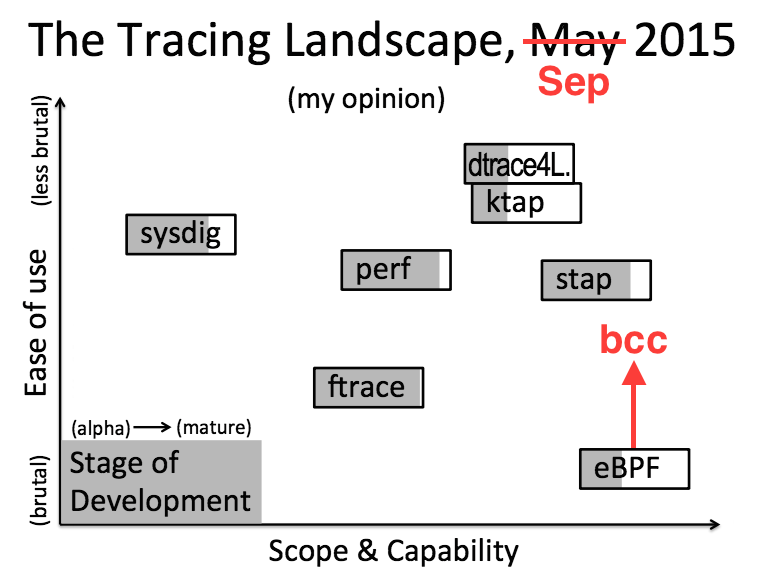
I've modified my diagram on the right (from Velocity 2015) to show the role that bcc plays: it improves the useability of eBPF.
It's still early days for bcc, and right now it isn't easy to setup and use, even once you're on Linux 4.3+ (eg, here are my own notes). In the future, this should be as simple as a package add. And this will be adding user-level software only: the kernel parts (eBPF) are already in the Linux kernel.
Just as one example of bcc, here's the full code to my biolatency tool, which I showed at the top of this post:
A lot of this code is logic for processing command-line arguments. The C instrumentation code is defined in-line, as bpf_text. There are a few things I'd like improved, like switching to tracepoints instead of kprobes, but this is not bad so far. I can write tools in this.
bcc can also do a lot more than my examples here: it can also be used for advanced network traffic control. For more about those capabilities, see the IO Visor project.
Even if few people learn bcc programming, it should see success through the use of its tools. At a company like Netflix, it will only take a few of us learning bcc/eBPF to have a big impact for the company: we can develop tools for others to use, and plugins for our other analysis software (eg, Vector). A lot of what we create is open sourced, so others will benefit as well.
Other tracers and tools
bcc won't be the only interface to eBPF. There is already work on bringing it to Linux perf_events. It would also be great to see a tracer with a grammar, like SystemTap or ktap, support eBPF, which would make ad hoc tools even easier to write. (Perhaps bcc will provide its own grammer in the future.) eBPF should make other enhancements possible for the other tracers.
I previously created perf-tools, a collection of mostly ftrace-based tracing tools for Linux systems. With eBPF and bcc, I'll eventually switch some of these tools to eBPF, where they will have more features, be easier to maintain, and have lower overhead. For example, my perf-tools iolatency tool, which is equivalent to biolatency, processed every disk event in user-level, costing measurable overhead (which I warned about in the tool and its man page). The overhead for the bcc biolatency version should be negligible.
With bcc/eBPF, I'll also be creating many new tools that were previously impossible (or impractical) to do.
Thanks to Alexei Starovoitov and Brenden Blanco of PLUMgrid, and others, for developing eBPF and bcc, and Deirdré Straughan for edits to this post.
Click here for Disqus comments (ad supported).