

I've just combined off-CPU stacks with wakeup stacks in kernel context, which I've never been able to do before. This allows a new type of profiling and visualization: an off-wake flame graph. In this post I'll summarize off-CPU time profiling, wakeup time profiling, and off-wake time profiling, and show examples of these as flame graphs. For profiling, I'm using Linux eBPF with some new bcc front-end tools I've developed and shared.
Off-CPU Time Flame Graph
Off-CPU analysis is the profiling of all thread blocking events (disk I/O, network I/O, locking, sleeping, swapping, etc) with their stack traces, and is complementary to CPU profiling. I covered it in a previous post[1] where I used Linux eBPF to profile the events, but finished by saying I had to drill further on blocked stacks.
To illustrate the limitations of off-CPU analysis, I created the following off-CPU time flame graph while my system performed a file system archive using "tar". The commands (from bcc[2] and FlameGraph[3]) were:
# offcputime -fu 10 > out.offcpu
# flamegraph.pl --color=io --countname=us < out.offcpu > offcpu.svg
The -u option shows user-mode threads only, excluding kernel threads. Here is the result (SVG):
Click to zoom. This shows stack traces that were blocked and off-CPU, along with the total duration they were blocked as their widths, for a 10 second profile.
Click on "tar" on the lower right (or click the "Search" button on the top right and type in "tar", to find it). See those blocking stack traces? 8.4 seconds total reading files (via vfs_read()), and 608 milliseconds total reading directories (sys_getdents(), etc.). Awesome! This is an example of an off-CPU time flame graph working well.
Now "Reset Zoom" and take a look at "gzip" on the left. It's blocked on sys_read() for 8.8 seconds in total, so it's blocked on a file descriptor. Ok, that's a little bit useful, but we'd like to know more: what is that file descriptor, and why did reads take 8.8 seconds in total?
Many other paths are also not fully explained by these off-CPU stacks alone: eg, paths in sys_select().
Wakeup Time Flame Graph
Sleeping threads are woken up by other threads. Since the kernel manages this, we can trace these kernel wakeup events and inspect the stack trace of the waker thread at the time of the wakeup.
I've added a new tool to bcc for this, wakeuptime. As with offcputime, it's currently using an eBPF hack[4] until stack support is provided by the kernel. The following wakeup time flame graph was created using:
# wakeuptime -fu 10 > out.wakeup
# flamegraph.pl --color=waker --countname=us < out.wakeup > wakeup.svg
For differentiation, a different palette was selected. Here is the result (SVG):
Now the stack trace shows the waker thread at the time of wakeup. The bottom frame is the name of the wakeup thread, and the top frame is the name of the target thread. The widths correspond to the time from when the target thread blocked, to when the wakeup was sent. That should be most of the blocking time. It may exclude a little time spent waiting on a run queue to be scheduled, after the wakeup.
See "tar" at the top? Click it. That path shows a block I/O interrupt event. It's the disk I/O completing, and waking up tar. Excellent. The numbers don't quite match the previous flame graph, since I collected these profiles at different times.
Now find "gzip" at the top (top is the target of the waker), it's the right-most column. Click it. So gzip was woken up by tar doing a write. This makes sense, as the archive was actually:
# tar cf - /usr /var | gzip > /mnt/scratch/backup.tar
So gzip is blocked waiting on tar, and tar is blocked waiting on disk I/O. The complete picture is explained in both the off-CPU and waker flame graphs.
gzip also appears at the bottom, as responsible for waking various other threads, although I think this is more to do with pending interrupts being processed (the handle_irq path), and not gzip-specific. I may improve how this is presented in a future version of the tool.
Off-Wake Time Flame Graph
Let's combine the off-CPU time flame graph with the wakeup time flame graph. I've done this using another new tool, offwaketime, which combines these stacks in kernel context for efficiency.
# offwaketime -fu 10 > out.offwake
# flamegraph.pl --color=chain --countname=us < out.offwake > offwake.svg
Here's an example (SVG):
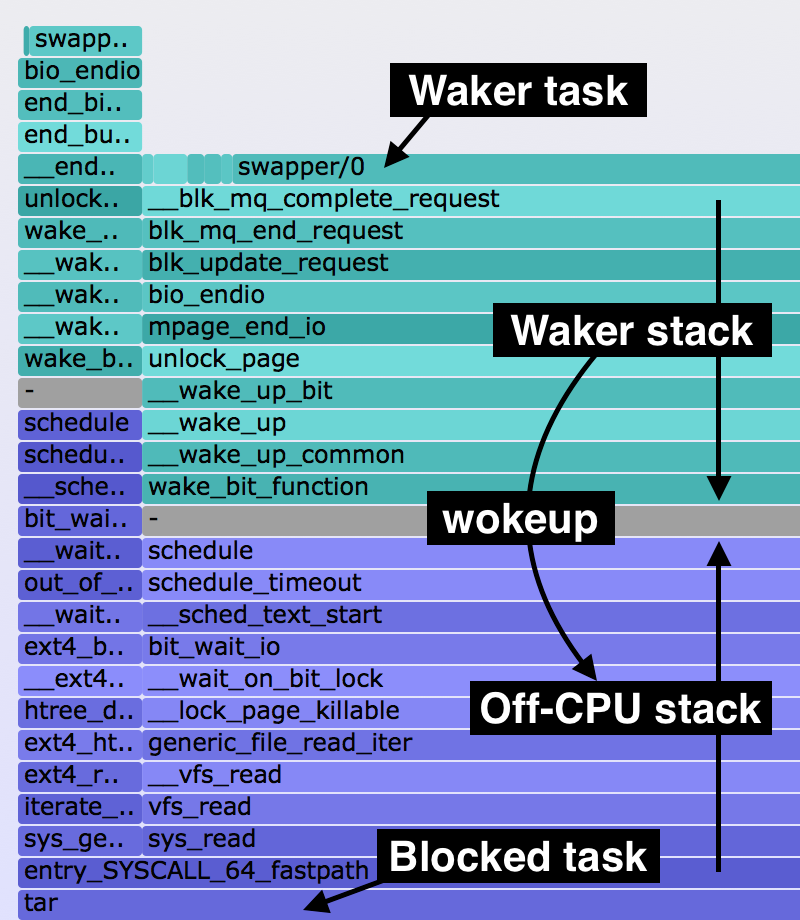
The bottom stacks, colored blue, are the off-CPU stacks. On top are the waker stacks, colored aqua, with the frames in reverse order. Why? I've found this more logical: top-down shows the wakeup path, bottom-up shows the off-CPU blocked path. They meet in the middle, with a grey divider. On the top of the waker stacks are the waker task names. This layout is annotated on the right.
Since we're back to having the target thread at the bottom (like the off-CPU flame graph), find "tar" as a bottom frame. Click it. You can see the off-CPU stack and then the wakeup stack, illustrating more of how block I/O is processed.
You can also find "gzip" as a bottom frame. The very top frame is "tar", the wakeup task. Their stacks are shown together.
To read these off-wake time flame graphs, begin at the bottom frames to find the blocked tasks, then continue reading bottom-up. The first stacks show the primary reason the threads blocked (off-CPU), and the second stacks show the secondary reason (wakeup). On the very top is the waker task names.
Limitations & Improvements
Because of limitations in my eBPF stack hack, this offwaketime program truncates waker frames to a depth of 10. This limitation will be removed in future versions, which should also include user-level stacks as well, for application context. Since tar and gzip are simple programs, we can guess what they are doing without their user-level stacks. For large applications, however, the kernel context alone may be ambiguous, and we may need the user-level stacks to make better sense of the flame graph.
Another limitation is that one wakeup stack may not be enough to explain the source of latency, when the waker thread was blocked on another thread. An example in this SVG is "sshd", which was blocked on the kernel worker thread "kworker/u16:2" (which itself isn't present in the flame graph, because I excluded kernel threads using offwaketime -u). In an upcoming post, I'll show what happens when we include kernel threads, and also multiple waker stacks.
I'm also experimenting with how best to associate the waker stack with the off-cpu stack. In my current version, the newly woken thread checks an eBPF map where waker stacks are stored by thread ID. This works fine, but there may be room for improvement, especially with how timing is measured and presented.
Bonus
I accidentally caught cron executing while collecting examples, and saw this (original SVG):
 This is a "dumpsystemstats" script gathering various system statistics. Since I had flushed the file system cache, many of the processes called were no longer cached, and needed to be read from disk.
The flame graph paints the full picture of why dumpsystemstats took as long as it did to execute. And by mousing over the original SVG, I can read the times and quantify each path. Explaining the enumeration:
- Pathname opens for the child processes and their disk I/O, via do_open_execat(), took 12 ms.
- Initial process execution triggering disk I/O to load the instruction text, took 90 ms.
- The bulk of the time is waiting on child process execution, via sys_wait4(), took 266 ms.
- The path showing child processes exiting and waking up their parent.
- Each process name that was called. cat took 15 ms in total, date 29 ms in total, etc.
Not labeled here is the thin tower on the right, for sys_newstat() taking 11 ms. The total run time of dumpsystemstats, 386 ms, can be explained.
I should note that the ordering I used for this enumeration may reflect the actual order of execution, or it may not. We don't know which towers were executed before which other towers, as the x-axis is an alphabetical sort, not the passage of time (that's flame charts). However, for the primary use case – provide a breakdown of time – the ordering is not important. As a performance engineer, this has already identified many areas to work on, and quantified them.
Summary
There are now four types of flame graphs for investigating time spent by threads:
- CPU flame graphs: to show on-CPU time (CPU usage).
- Off-CPU time flame graphs: to show why threads have blocked.
- Wakeup time flame graphs: to show what blocked threads were woken up by.
- Off-wake time flame graphs: to show why threads blocked and why they were woken up.
The last two were introduced in this post, along with versions implemented using Linux bcc/eBPF: wakeuptime and offwaketime. The current versions of these tools have various limitations, including only kernel stacks. These limitations should be removed in the future, as eBPF and bcc continue to be developed.
The last three can solve many issues involving blocking events and off-CPU time, but not everything, as the wakeup stack may not be sufficient. Despite this, they should still be a useful addition to a performance analysis toolbox, as one way to analyze all blocking events: I/O, locks, paging, swapping, sleeps, etc.
For the first two flame graph types, see my CPU flame graphs[5] and off-CPU time flame graphs[6] pages, and my previous post on eBPF off-CPU time flame graphs[7]. I first introduced these types in my USENIX LISA 2013 talk on flame graphs[8].
References & Links
- http://www.brendangregg.com/blog/2016-01-20/ebpf-offcpu-flame-graph.html
- https://github.com/iovisor/bcc
- https://github.com/brendangregg/FlameGraph
- http://www.brendangregg.com/blog/2016-01-18/ebpf-stack-trace-hack.html
- http://www.brendangregg.com/FlameGraphs/cpuflamegraphs.html
- http://www.brendangregg.com/FlameGraphs/offcpuflamegraphs.html
- http://www.brendangregg.com/blog/2016-01-20/ebpf-offcpu-flame-graph.html
- http://www.brendangregg.com/flamegraphs.html#Presentation
Thanks to Deirdré Straughan for edits and suggestions.
Click here for Disqus comments (ad supported).