

Performance Monitoring Counters (PMCs) are now publicly available from dedicated host types in the AWS EC2 cloud. PMC nerds worldwide rejoice! (All six of us.) There should be more of us in the future, as with the increasing scale of processors and speed of storage devices, the common bottleneck is moving from disks to the memory subsystem. CPU caches, the MMU, memory busses, and CPU interconnects. These can only be analyzed with PMCs.
Memory is the new disk.
If PMCs are new to you, then in a nutshell they are special hardware counters that can be accessed via processor registers, and enabled and read via certain instructions. PMCs provide low-level CPU performance statistics that aren't available anywhere else.
In this post I'll summarize the PMCs available in EC2, which are for dedicated hosts only (eg, m4.16xl, i3.16xl), and I'll demonstrate measuring IPC. Note that PMCs are also known as HPCs (hardware performance counters), and other names as well.
EC2 Dedicated Host PMCs
The PMCs available are the architectural PMCs listed in the Intel 64 and IA-32 Architectures Developer's Manual: vol. 3B, in section 18.2.1.2 "Pre-defined Architectural Performance Events", Table 18-1 "UMask and Event Select Encodings for Pre-Defined Architectural Performance Events". I've drawn my own table of them below with example event mnemonics.
Architectural PMCs
| Event Name | UMask | Event Select | Example Event Mask Mnemonic |
|---|---|---|---|
| UnHalted Core Cycles | 00H | 3CH | CPU_CLK_UNHALTED.THREAD_P |
| Instruction Retired | 00H | C0H | INST_RETIRED.ANY_P |
| UnHalted Reference Cycles | 01H | 3CH | CPU_CLK_THREAD_UNHALTED.REF_XCLK |
| LLC Reference | 4FH | 2EH | LONGEST_LAT_CACHE.REFERENCE |
| LLC Misses | 41H | 2EH | LONGEST_LAT_CACHE.MISS |
| Branch Instruction Retired | 00H | C4H | BR_INST_RETIRED.ALL_BRANCHES |
| Branch Misses Retired | 00H | C5H | BR_MISP_RETIRED.ALL_BRANCHES |
What's so special about these seven architectural PMCs?
They give you a good overview of key CPU behavior, sure. But Intel have also chosen them as a golden set, to be highlighted first in the PMC manual and their presence exposed via the CPUID instruction.
Note that the Intel mnemonic for LLC here is "longest latency cache", but this is also known as "last level cache" or "level 3 cache" (assuming it's L3).
PMC Usage
Before I demonstrate PMCs, it's important to know that there's two very different ways they can be used:
- Counting: where they provide a count over an interval.
- Sampling: where based on a number of events, an interrupt can be triggered to sample the program counter or stack trace.
Counting is cheap. Sampling costs more overhead based on the rate of the interrupts (which can be tuned by changing the event trigger threshold), and whether you're reading the PC or the whole stack trace.
I'll demonstrate PMCs by using counting to measure IPC.
Measuring IPC
Instructions-per-cycle (IPC) is a good starting point for PMC analysis, and is measured by counting the instruction count and cycle count PMCs. (On some systems it is shown as its invert, cycles-per-instruction, CPI.)
IPC is like miles-per-gallon for CPUs: how much bang for your buck. The resource here isn't gallons of gasoline but CPU cycles, and the result isn't miles traveled but instructions retired (ie, completed). The more instructions you can complete with your fixed cycles resource, the better.
In the interest of keeping this short, I'll gloss over IPC caveats. There are situations where it can be misleading, like an increase of IPC because your program suffers more spin lock contention, and those spin instructions happen to be very fast. Just like MPG can be misleading, as it can be influenced by the route driven, not just the car's own characteristics.
I'll use the Linux perf command to measure IPC of a program, noploop, which loops over a series of NOP instructions (no op):
# perf stat ./noploop
^C./noploop: Interrupt

 Performance counter stats for './noploop':

       2418.149339      task-clock (msec)         #    1.000 CPUs utilized
                 3      context-switches          #    0.001 K/sec
                 0      cpu-migrations            #    0.000 K/sec
                39      page-faults               #    0.016 K/sec
     6,245,387,593      cycles                    #    2.583 GHz                      (75.03%)
   <not supported>      stalled-cycles-frontend
   <not supported>      stalled-cycles-backend
    24,766,697,057      instructions              #    3.97  insns per cycle          (75.02%)
        14,738,991      branches                  #    6.095 M/sec                    (75.02%)
            24,744      branch-misses             #    0.17% of all branches          (75.04%)

       2.418826663 seconds time elapsed
I've highlighted IPC ("insns per cycle") in the output. I like noploop as a sanity test. Because this processor is 4-wide (instruction prefetch/decode width), it can process a maximum of 4 instructions with every CPU cycle. Since NOPs are the fastest possible instruction (they do nothing), they can be retired at an IPC rate of 4.0. This goes down to 3.97 with a little loop logic (the program is looping over a block of NOPs).
The "<not supported>" metrics are cases where the PMC is not currently available (they are outside of the architectural set, in this case).
You can also measure the entire system, using perf with -a. This time I'm measuring a software build:
# perf stat -a -- sleep 10

 Performance counter stats for 'system wide':

     641398.723351      task-clock (msec)         #   64.116 CPUs utilized            (100.00%)
           379,651      context-switches          #    0.592 K/sec                    (100.00%)
            51,546      cpu-migrations            #    0.080 K/sec                    (100.00%)
        13,423,039      page-faults               #    0.021 M/sec
 1,433,972,173,374      cycles                    #    2.236 GHz                      (75.02%)
   <not supported>      stalled-cycles-frontend
   <not supported>      stalled-cycles-backend
 1,118,336,816,068      instructions              #    0.78  insns per cycle          (75.01%)
   249,644,142,804      branches                  #  389.218 M/sec                    (75.01%)
     7,791,449,769      branch-misses             #    3.12% of all branches          (75.01%)

      10.003794539 seconds time elapsed
That's reporting an IPC of 0.78.
perf can also print statistics over time (-I), but the output becomes verbose. I've written a quick wrapper to clean this up and summaize the architectural PMCs on a single line. It's pmcarch (first version):
# pmcarch 1
CYCLES        INSTRUCTIONS    IPC BR_RETIRED   BR_MISPRED  BMR% LLCREF      LLCMISS     LLC%
90755342002   64236243785    0.71 11760496978  174052359   1.48 1542464817  360223840  76.65
75815614312   59253317973    0.78 10665897008  158100874   1.48 1361315177  286800304  78.93
65164313496   53307631673    0.82 9538082731   137444723   1.44 1272163733  268851404  78.87
90820303023   70649824946    0.78 12672090735  181324730   1.43 1685112288  343977678  79.59
76341787799   50830491037    0.67 10542795714  143936677   1.37 1204703117  279162683  76.83
[...]
This is from a production instance on EC2, and each line of output is a one second summary.
Interpreting IPC
For real-world applications, here's how I'd interpret the IPC:
- IPC < 1: likely stall cycle bound, also likely memory bound (more PMCs can confirm). Stall cycles are when the CPU isn't making forward progress, likely because it's waiting on memory I/O. In this case, look to tune memory usage: allocate fewer or smaller objects, do zero copy, look at NUMA and memory placement tuning. A CPU flame graph will show which code is on-CPU during these stall cycles, and should be clues for were to look for memory usage.
- IPC > 1: likely instruction bound. Look to tune instructions: a CPU flame graph will show which code is on-CPU doing instructions: find ways to reduce executed code.
You can combine IPC and flame graphs to show everything at once: CPI flame graphs (CPI is IPC inverted). This requires using the sampling mode of PMCs to capture stack traces on overflow events. There are, however, caveats with doing this which I'll get to in another post.
Note that I'm using these on a modern Linux kernel, 4.4+. There was a problem on older kernels (3.x) where PMCs would be measured incorrectly, leading to a bogus IPC measurement.
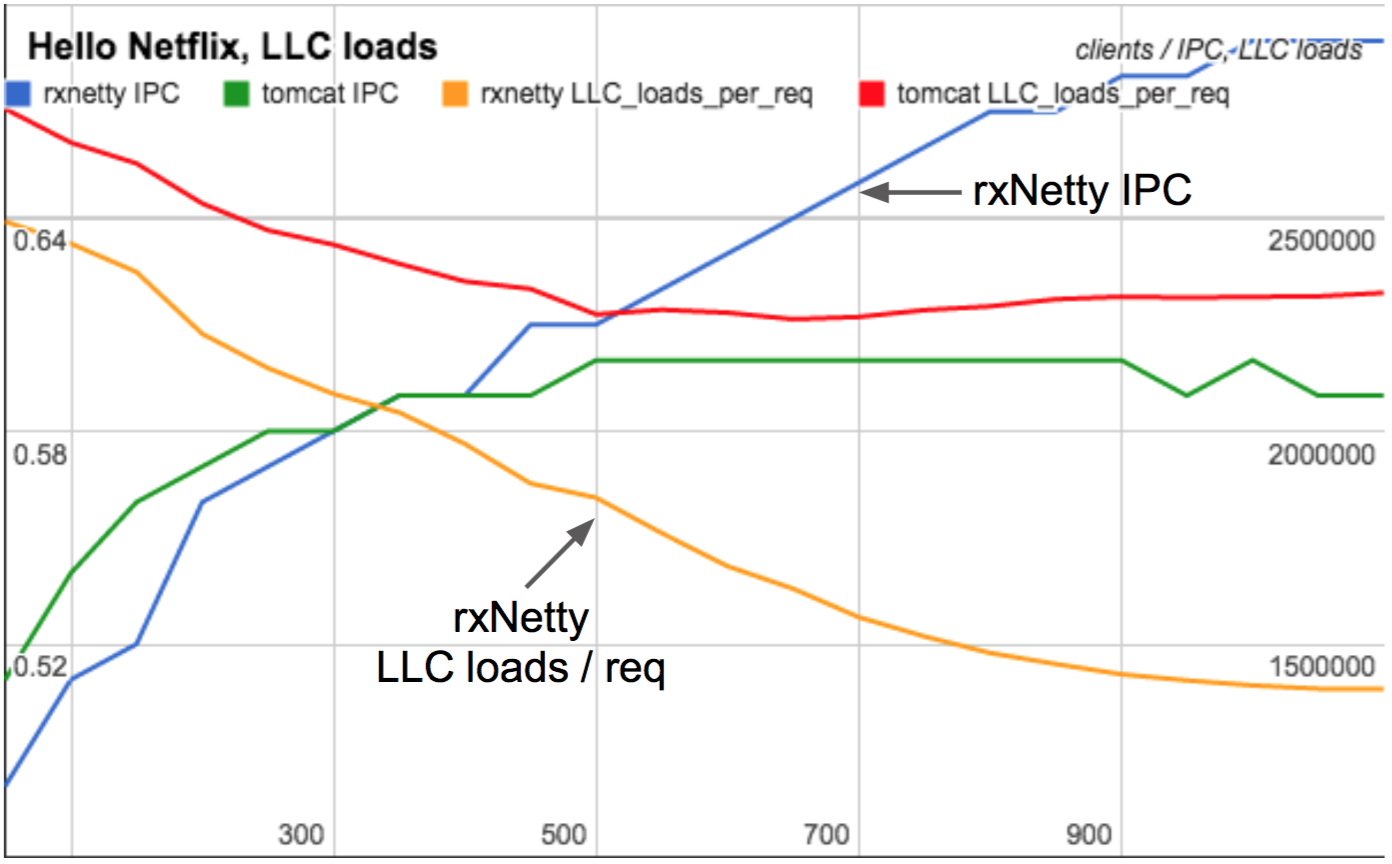
RxNetty Study
In 2015 I found PMCs crucial in fully understanding the performance differences between RxNetty and Tomcat as they scaled with client load. Tomcat serves requests using threads for each connection, whereas RxNetty uses event loop threads. Between low and high client counts, Tomcat's CPU cycles per request was largely unchanged, whereas RxNetty became more efficient and consumed less CPU per request as clients increased. Can you guess why?
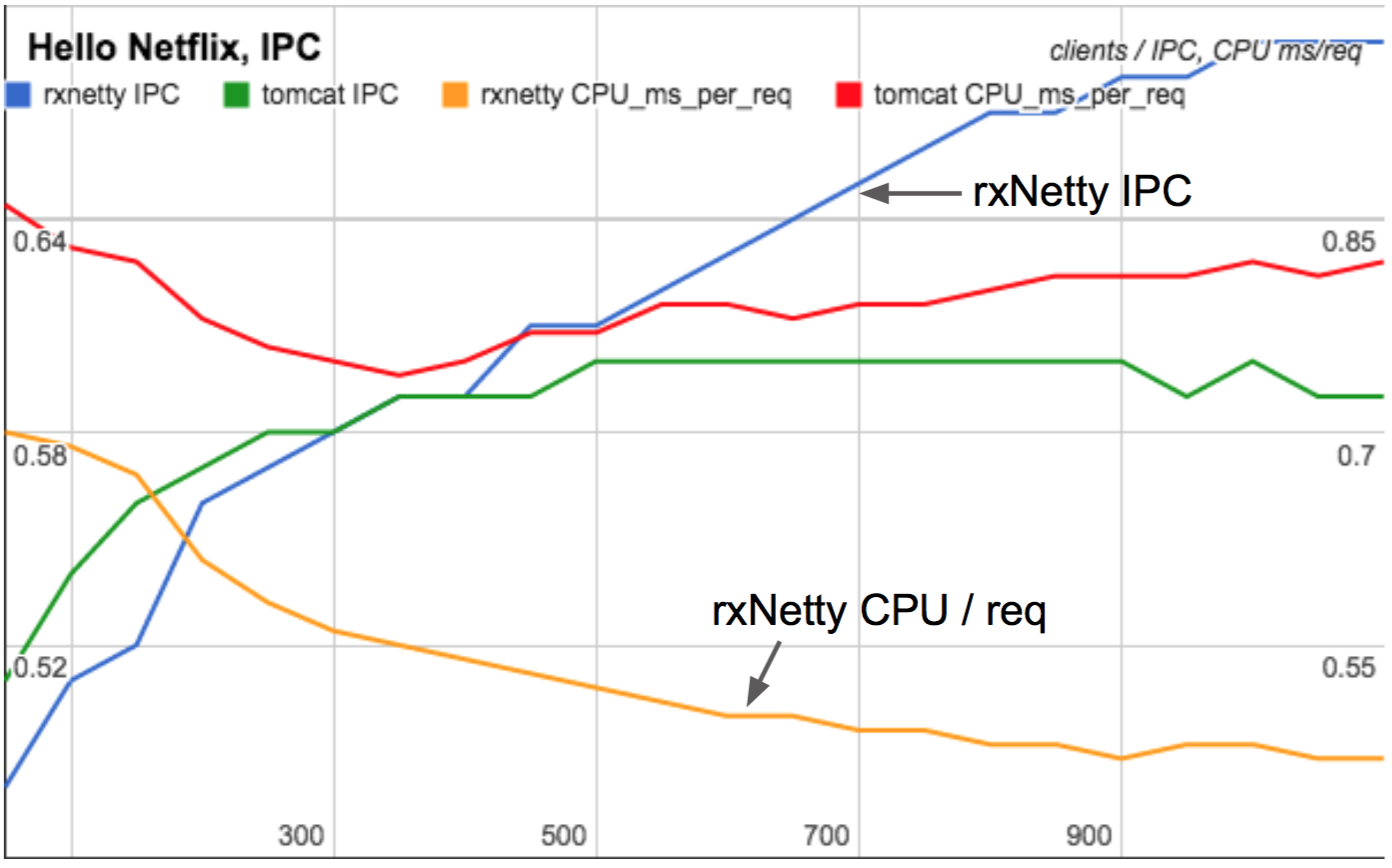
IPC and CPU/req as load scales
Click for a slide deck where I explain why on slides 25-27 (these slides are from the WSPerfLab repository, summarizing a study by myself, Nitesh Kant, and Ben Christensen).
We knew that we had a 46% higher request rate, and so we began a study to identify and quantify the reasons why. There was 5% caused by X, and 3% caused by Y, and so on. But after weeks of study, we fell short: over 10% of that 46% remained unexplained. I checked and rechecked our numbers, but fell short every time. It was driving me nuts, and casting doubt on everything we'd found so far.
With PMCs I was able to identify this last performance difference, and the numbers finally added up! We could break down the 46% difference and explain every percentage point. It was very satisfying. It also emphasized the importance of PMCs: understanding CPU differences is a common task in our industry, and without PMCs you're always missing an important part of the puzzle.
This study was done on a physical machine, not EC2, where I'd measured and studied dozens of PMCs. But the crucial PMCs I included in that slide deck summary were the measurements of IPC and the LLC, which are possible with the architectural PMCs now available in EC2.
How is this even possible in the cloud?
You might be wondering how cloud guests can read PMCs at all. It works like this: PMCs are managed via the privileged instructions RDMSR and WRMSR for configuration (which I wrote about in The MSRs of EC2), and RDPMC for reading. A privileged instruction causes a guest exit, which is handled by the hypervisor. The hypervisor can then run its own code, and configure PMCs if the actual hardware allows, and save and restore their state whenever it context switches between guests.
Mainstream Xen supported this years ago, with its virtual Performance Monitoring Unit (vPMU). It is configured using vpmu=on in the Xen boot line. However, it is rarely turned on. Why?
There are hundreds of PMCs, and they are all exposed with vpmu=on. Could some pose a security risk? A number of papers have been published showing PMC side-channel attacks, whereby measuring certain PMCs while sending input to a known target program can eventually leak bits of the target's state. While these are unlikely in practice, and such attacks aren't limited to PMCs (eg, there's also timing attacks), you can understand a paranoid security policy not wanting to enable all PMCs by default.
In the cloud it's even harder to do these attacks, as when Xen context switches between guests it switches out the PMCs as well. But still, why enable all the PMCs if they aren't all needed? Imagine if we could create a whitelist of allowed PMCs for secure environments. This is a question I pondered in late 2015, and I ended up contributing the x86/VPMU: implement ipc and arch filter flags patch to Xen to provide two whitelist sets as options, chosen with the vpmu boot flag:
- ipc: Enough PMCs to measure IPC only. Minimum set.
- arch: The seven architectural PMCs (see table above). Includes IPC.
More sets can be added. For example, I can imagine an extended set to allow some Intel vTune analysis.
AWS just enabled architectural PMCs. My patch set might be a useful example of how such a whitelist can be implemented, although, how EC2 implemented it might be different to this.
Conclusion
PMCs are crucial for analyzing a (if not the) modern system bottleneck: memory I/O. A set of PMCs are now available on dedicated hosts in the EC2 cloud, enough for high-level analysis of memory I/O issues. I used them in this post to measure IPC, which can identify if your applications are likely memory bound or instruction bound, directing further tuning efforts.
I've worked with PMCs before, and the sort of wins they help you find can range from small single digit percentages to as much as 2x. The net result for companies like Netflix is that our workloads will run faster on EC2 because we can use PMCs to find these performance wins. Consider that, next time someone is comparing clouds by microbenchmarking alone. It's not just out-of-the-box performance that matters, it's also your ability to observe and tune your applications.
A cloud you can't analyze is a slower cloud.
Thanks to those at Netflix for supporting my work on this, the Xen community for their vpmu work, and everyone at Amazon and Intel who made this happen! (Thanks Joe, Matt, Subathra, Rosana, Uwe, Laurie, Coburn, Ed, Mauricio, Steve, Artyom, Valery, Jan, Boris, and more.) (Yes, I'm happy.)
Click here for Disqus comments (ad supported).