Memory Leak (and Growth) Flame Graphs

Your application memory usage is steadily growing, and you are racing against time to fix it. This could either be memory growth due to a misconfig, or a memory leak due to a software bug. For some applications, performance can begin to degrade as garbage collection works harder, consuming CPU. If an application grows too large, performance can drop off a cliff due to paging (swapping), or the application may be killed by the system (Linux's OOM killer). You want to take a quick look before either occurs, in case it's an easy fix. But how?
Debugging growth issues involves checking the application config and memory usage, either from application or system tools. Memory leaks are much harder, but there are many tools to help. Some launch the application with malloc() calls interposed with instrumentation, like Valgrind memcheck, which can also simulate a CPU so that all memory accesses can be checked. This can cause the application to run 20-30 times slower, or more. Another, faster, tool for this is libtcmalloc's heap profiling, although it can still make the application over 5 times slower. Other tools take a core dump and then post-process that to study memory usage, like gdb. Those usually pause the application while a core dump is taken, or require the application to be terminated, so that free() routines are called. While interposing or core dump techniques provide invaluable detail for diagnosing memory leaks, neither of them can easily be used on a growing application that has caught your attention.
On this page page I'll summarize four tracing approaches I use for analyzing memory growths and leaks on an already running application. These show the code paths responsible for memory usage, examined as stack traces, and visualized as Flame Graphs. I'll demonstrate the analysis on Linux, and then summarize other OSes.
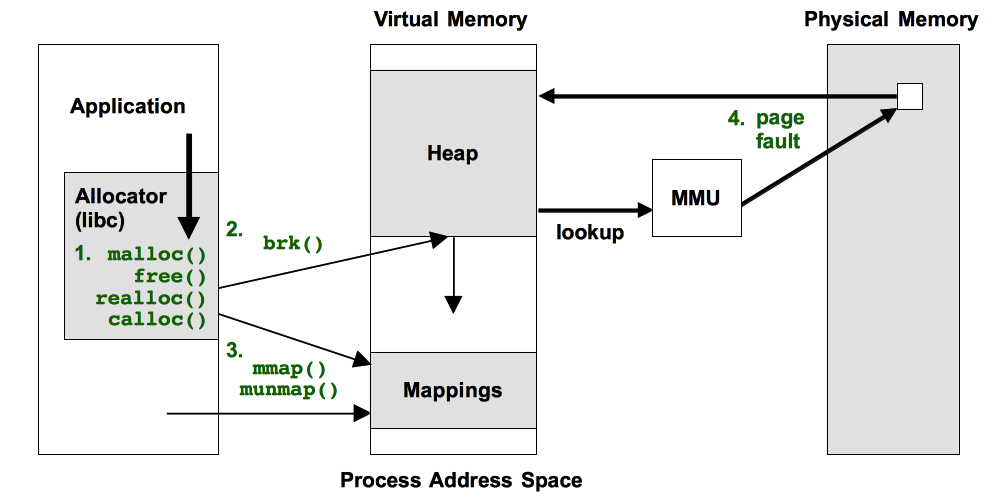
The four approaches are illustrated in the following figure, as the events in green text:
All of these have shortcomings, which I'll explain. A table of contents:
Prerequisites
All of the following approaches require stack traces to be available to tracers, which you may need to fix first. Many applications are compiled with the -fomit-frame-pointer gcc option, breaking frame pointer-based stack walking. VM runtimes like Java compile methods on the fly, and tracers may not find their symbol information without additional help, causing the stack trace to be hexadecimal only. There are other gotchas as well. See my previous write ups on fixing Stack Traces and JIT Symbols for perf.
Linux: perf, eBPF
The following are generic approaches. I'll use Linux as the target example, then summarize other OSes.
There are many tracers available on Linux for memory analysis. I'll use perf and bcc/eBPF here, which are standard Linux tracers. Both perf and eBPF are part of the Linux kernel source. perf works on older Linux systems, whereas eBPF requires at least Linux 4.8 for doing stack traces. eBPF can more easily do in-kernel summaries, making it more efficient and lowering overhead.
1. Allocator Tracing: malloc(), free(), ...
This is where the memory allocator functions, malloc(), free(), etc, are traced. Imagine you could run Valgrind memcheck with "-p PID" on a process, and gather memory leak statistics for 60 seconds or so. Not a complete picture, but hopefully enough to catch egregious leaks. Same performance hit or even worse, but you only take that hit if and when you need to, and for a limited duration.
These allocator functions operate on virtual memory, not physical (resident) memory, which is usually the target of leak detection. Fortunately, they usually have a strong correlation at this level for identifying the problem code.
I sometimes use allocator tracing, but the overheads are high, making this is more of a debugging approach than a production profiler. This is because allocator functions like malloc() and free() can be extremely frequent (many millions of times per second), and adding a small amount of overhead can add up. But then, solving issues can make it worth it. It can be less overhead than Valgrind's memcheck or tcmalloc's heap profiler. If you want to try this yourself, I'd start by seeing how much you can solve using in-kernel summaries with eBPF, which works best on Linux 4.9 and higher.
1.1. Perl Example
Here's an example of allocator tracing using eBPF for in-kernel summaries. It is my stackcount tool from bcc, and I'm using it to simply count calls to libc malloc(), for a given process, a Perl program. It works using uprobes for the malloc() function: user-level dynamic tracing.
# /usr/share/bcc/tools/stackcount -p 19183 -U c:malloc > out.stacks
^C
# more out.stacks
[...]

  __GI___libc_malloc
  Perl_sv_grow
  Perl_sv_setpvn
  Perl_newSVpvn_flags
  Perl_pp_split
  Perl_runops_standard
  S_run_body
  perl_run
  main
  __libc_start_main
  [unknown]
    23380

  __GI___libc_malloc
  Perl_sv_grow
  Perl_sv_setpvn
  Perl_newSVpvn_flags
  Perl_pp_split
  Perl_runops_standard
  S_run_body
  perl_run
  main
  __libc_start_main
  [unknown]
    65922
The output is stack traces and their occurrence counts. For example, the last stack trace led to calling malloc() 65922 times. This is frequency counted in kernel context, and only emits the summary when the program ends. That way, we avoid the overhead of passing data to user space for every malloc(). I'm also using the -U option to trace user-level stacks only, since I'm instrumenting a user-level function: libc's malloc()
You can then convert that output to a flame graph using my FlameGraph software:
$ ./stackcollapse.pl < out.stacks | ./flamegraph.pl --color=mem \
    --title="malloc() Flame Graph" --countname="calls" > out.svg
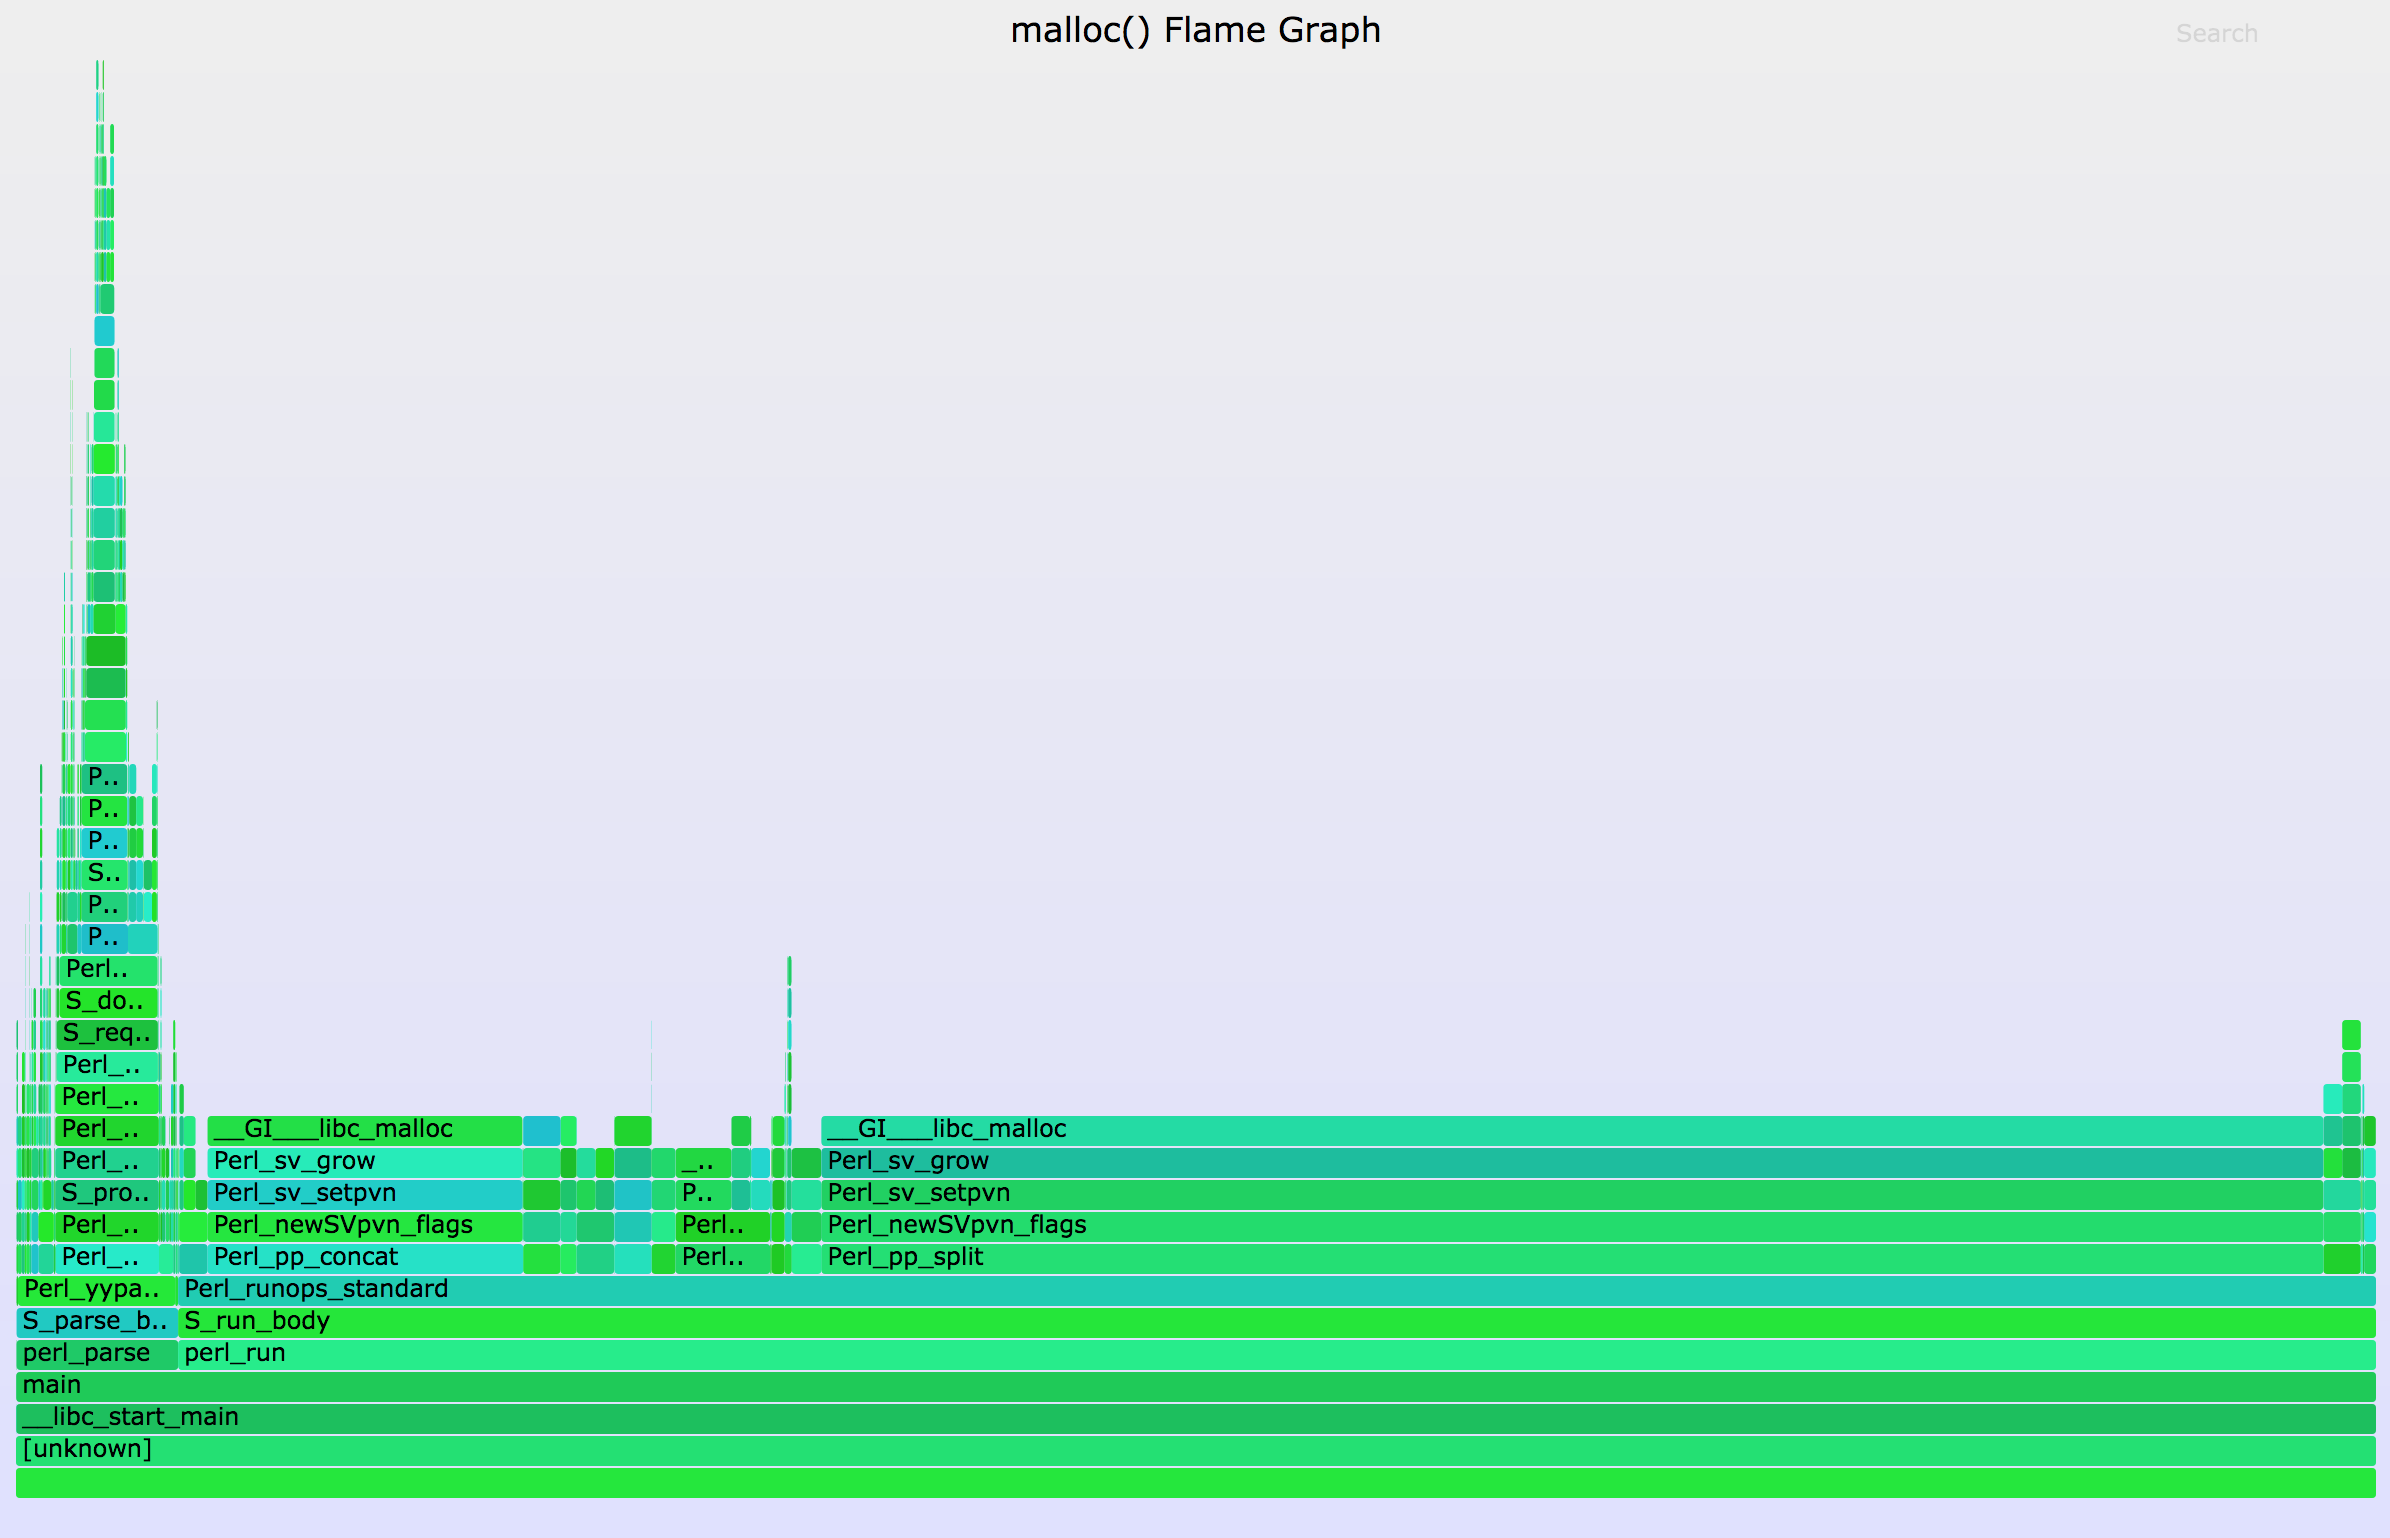
Now open out.svg in a web browser. An example resulting flame graph is below. Mouse over elements for details and click to zoom (if the SVG doesn't work in your browser, try the PNG):
This shows that the bulk of the allocations are via the Perl_pp_split() path.
If you want to try this approach yourself, remember to trace all allocator functions: malloc(), realloc(), calloc(), etc. You can also instrument the size of the allocation, and include that instead of the sample count, so that the flame graph shows bytes allocated rather than a count of calls. Sasha Goldshtein has already written an advanced eBPF-based tool that instruments these functions, which tracks long-term surviving allocations that haven't been freed in an interval, with bytes, for identifying memory leaks. It is memleak in bcc: see the example file.
1.2. MySQL Example
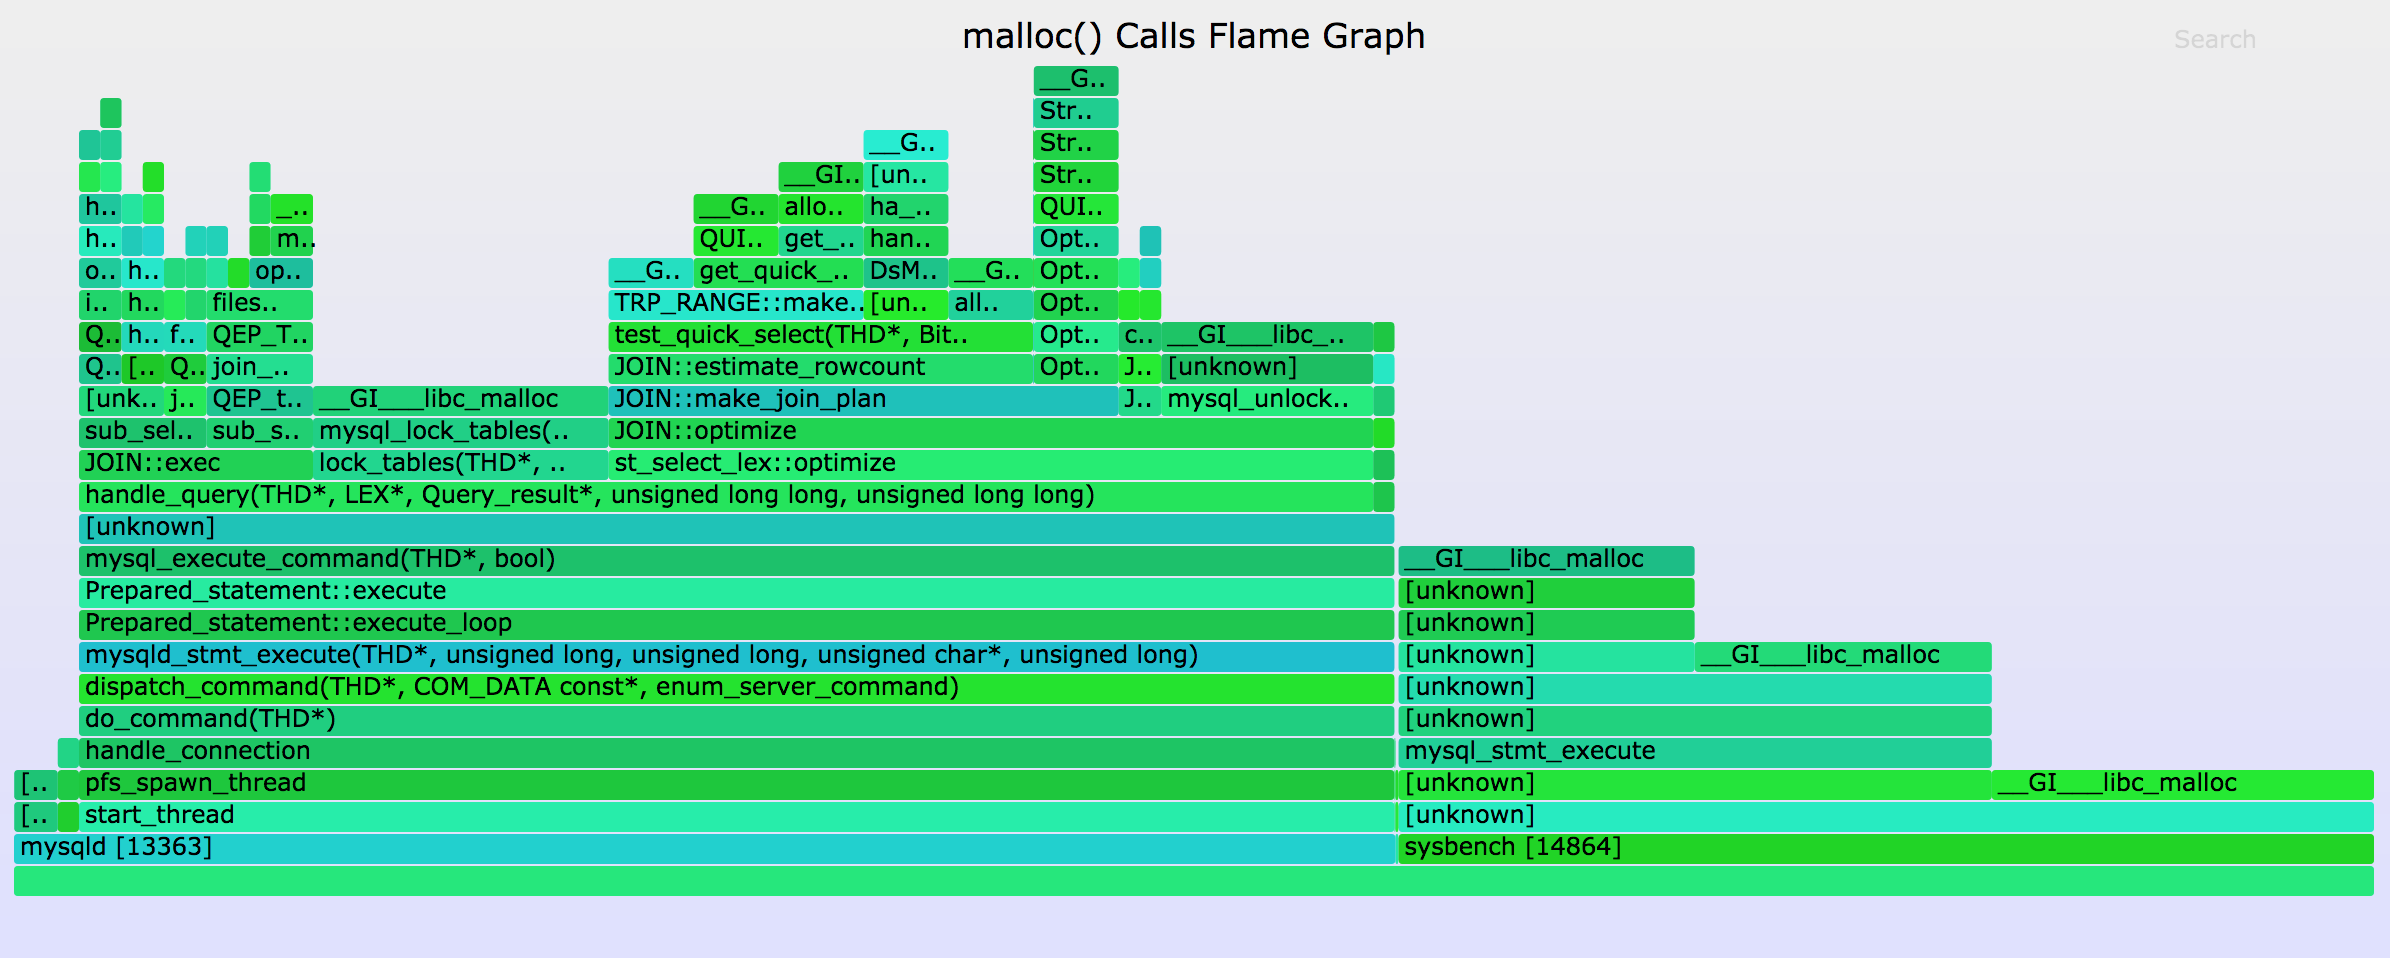
I'll take this example a bit further. It is a MySQL database server that is processing a benchmark load. I'll start with a malloc() count flame graph using stackcount as described earlier (but with stackcount -D 30, for a duration of 30 seconds). The resulting flame graph is (SVG, PNG):
This tells us that the most malloc() calls were in st_select_lex::optimize() -> JOIN::optimize(). But that's not where most of the bytes were allocated.
Here is a malloc() bytes flame graph, where the width shows the total bytes allocated (SVG, PNG):
Most of the bytes were allocated in JOIN::exec(), not JOIN::optimize(). The trace data for these flame graphs was captured at roughly the same time, so the difference here is because some calls are larger than others, and not just that the workload changed between the traces.
I developed a separate tool to do this, mallocstacks, which is similar to stackcount but sums the size_t argument to malloc() as the metric, rather than just counting the stacks. The flame graph generation steps were, to trace malloc() system-wide:
# ./mallocstacks.py -f 30 > out.stacks
[...copy out.stacks to your local system if desired...]
# git clone https://github.com/brendangregg/FlameGraph
# cd FlameGraph
# ./flamegraph.pl --color=mem --title="malloc() bytes Flame Graph" --countname=bytes < out.stacks > out.svg
For this and the earlier malloc() count flame graph, I included an extra step to include just the mysqld and sysbench stacks (sysbench is the MySQL load generation tool). The actual command I used here was:
[...]
# egrep 'mysqld|sysbench' out.stacks | ./flamegraph.pl ... > out.svg
Since the output of mallocstacks.py (and stackcollapse.pl, used earlier) is a single line per-stack trace, it's easy to include some grep/sed/awk to manipulate the data before flame graph generation.
My mallocstacks tool is a proof-of-concept that only traces malloc(). I would keep developing these tools, but overhead is a concern.
1.3. Warning
WARNING: The overhead of allocator tracing via Linux uprobes is high, as of Linux 4.15 (it might improve somewhat in later kernels). This Perl program ran 4x slower (from 0.53 seconds to 2.14 seconds). Yes, this is despite using in-kernel frequency counting of the stack traces. At least it is faster than libtcmalloc's heap profiling, which for the same program made it run 6x slower. This is something of a worst case, as it includes program initialization, which is malloc() heavy. MySQL server suffered a 33% loss in throughput while tracing malloc() (CPUs were at saturation, so there was no headroom for the tracer to consume). This is still likely unacceptable in production for anything beyond very short samples (seconds).
Because of overhead, I try to use other memory analysis techniques described in the sections that follow (brk(), mmap(), page faults).
1.4. Other Examples
As another example, Yichun Zhang (agentzh) developed leaks.stp using SystemTap for Linux, which also uses in-kernel summarization for effeciency. He has created flame graphs from this, example here, which look great. I've since added a new color palette to flame graphs (--color=mem) so that we can differentiate CPU flame graphs (hot colors) from memory ones (green colors).
But the overhead of malloc tracing is so high that I prefer the indirect approaches as described in the following sections on brk(), mmap(), and page faults. This is a tradeoff: for leak detection they aren't nearly as effective as tracing allocator functions directly, but they do incur much less overhead.
2. brk() syscall
Many applications grow using brk(). This syscall sets the program break point: the end of the heap segment (aka the process data segment). brk() isn't called by the application directly, but rather the user-level allocator which provides the malloc()/free() interface. Such allocators typically don't give memory back the OS, keeping freed memory as a cache for future allocations. And so, brk() is typically for growth only (not shrinks). We'll assume that's the case, simplifying how it is traced.
brk() is usually infrequent (eg, <1000/second), which means that per-event tracing using perf may be sufficient. Here's how you can measure the rate of brk()s using perf (which uses in-kernel counts in this case):
# perf stat -e syscalls:sys_enter_brk -I 1000 -a
#           time             counts unit events
     1.000283341                  0      syscalls:sys_enter_brk
     2.000616435                  0      syscalls:sys_enter_brk
     3.000923926                  0      syscalls:sys_enter_brk
     4.001251251                  0      syscalls:sys_enter_brk
     5.001593364                  3      syscalls:sys_enter_brk
     6.001923318                  0      syscalls:sys_enter_brk
     7.002222241                  0      syscalls:sys_enter_brk
     8.002540272                  0      syscalls:sys_enter_brk
[...]
This is a production server, and there's usually zero brk()s per second. This tells you that you'll need to measure for a long duration (minutes) to capture enough samples for a flame graph.
If the rate of brk()s is low for you as well, you can just use perf in sampling mode, where it does per-event dumps. Here are the steps for brk instrumentation and flame graph generation using perf and FlameGraph:
# perf record -e syscalls:sys_enter_brk -a -g -- sleep 120
# perf script > out.stacks
[...copy out.stacks to a local system if desired...]
# ./stackcollapse-perf.pl < out.stacks | ./flamegraph.pl --color=mem \
    --title="Heap Expansion Flame Graph" --countname="calls" > out.svg
I included a "sleep 120" dummy command. Since brk's are infrequent, you may want 120 seconds or even longer to capture enough for a profile.
On newer Linux systems (4.8+) you can use Linux eBPF. brk() can be traced via its kernel function, SyS_brk() or sys_brk(), or on 4.14+ kernels via the syscalls:sys_enter_brk tracepoint. I'll use the function here, and show the eBPF steps using my stackcount bcc program again:
# /usr/share/bcc/tools/stackcount SyS_brk > out.stacks
[...copy out.stacks to a local system if desired...]
# ./stackcollapse.pl < out.stacks | ./flamegraph.pl --color=mem \
    --title="Heap Expansion Flame Graph" --countname="calls" > out.svg
Here is some sample output from stackcount:
$ cat out.stacks
[...]

  sys_brk
  entry_SYSCALL_64_fastpath
  brk
  Perl_do_readline
  Perl_pp_readline
  Perl_runops_standard
  S_run_body
  perl_run
  main
  __libc_start_main
  [unknown]
    3

  sys_brk
  entry_SYSCALL_64_fastpath
  brk
    19
The output includes multiple stack traces along with their occurrence count that led to the brk(). I've truncated the output to show only the last two stacks and counts, although full output isn't too long as brk() is usually infrequent and doesn't have that many different stacks: it's only occurring when the allocator has requests that spill-over its current heap size. This also means that the overhead is very low, and should be negligible. Compare this to malloc()/free() interposers, where the slow-down can be 4x and higher.
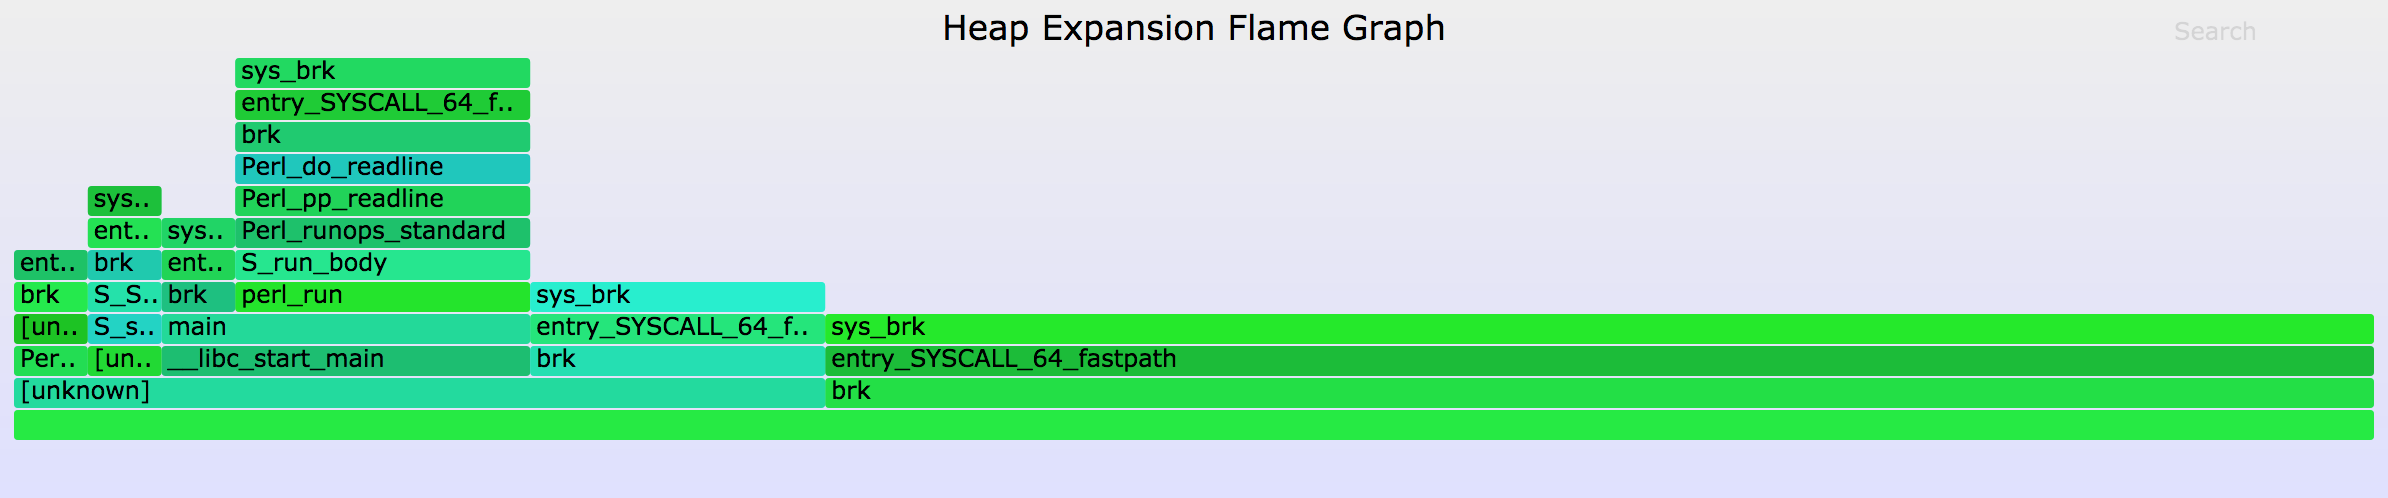
Now an example brk flame graph (SVG, PNG):
What brk() tracing can tell us is the code paths that lead to heap expansion. This could be either:
- A memory growth code path
- A memory leak code path
- An innocent application code path, that happened to spill-over the current heap size
- Asynchronous allocator code path, that grew the application in response to diminishing free space
It requires some sleuthing to tell them apart. If you are searching for leaks in particular, sometimes you'll be lucky and it'll be an unusual code path that is easily found in a bug database as a known leak.
While brk() tracing shows what led to expansion, page fault tracing, covered later, shows what then consumed that memory.
3. mmap() syscall
The mmap() syscall may be explicitly used by the application for loading data files or creating working segments, especially during initialization and application start. In this context, we're interested in creeping application growth, which may occur via mmap() if the allocator uses it instead of brk(). glibc does this for larger allocations, which can be returned to the system using munmap().
mmap() calls should be infrequent (check if you are unsure; see how I did it earlier with brk, and change the event to syscall:sys_enter_mmap), so per-event tracing using perf may be sufficient. Using perf and FlameGraph:
# perf record -e syscalls:sys_enter_mmap -a -g -- sleep 60
# perf script > out.stacks
[...copy out.stacks to a local system if desired...]
# ./stackcollapse-perf.pl < out.stacks | ./flamegraph.pl --color=mem \
    --title="mmap() Flame Graph" --countname="calls" > out.svg
On newer Linux systems (4.8+) you can use Linux eBPF. mmap() can be traced via its kernel function, SyS_mmap() or sys_mmap(), or on 4.14+ kernels via the syscalls:sys_enter_mmap tracepoint. I'll use the function here, and show the eBPF steps using my stackcount bcc program:
# /usr/share/bcc/tools/stackcount SyS_mmap > out.stacks
[...copy out.stacks to a local system if desired...]
# ./stackcollapse.pl < out.stacks | ./flamegraph.pl --color=mem \
    --title="mmap() Flame Graph" --countname="calls" > out.svg
Unlike brk(), mmap() calls don't necessarily mean growth, as they may be freed shortly after using munmap(). And so tracing mmap() may show many new mappings, but most or all of them are neither growth nor leaks. If your system has frequent short-lived processes (eg, doing a software build), the mmap()s as part of process initialization can flood the trace.
As with malloc()/free() tracing, mapping addresses can be inspected and associated so that those that were not freed can be identified. I'll leave that as an excercise for the reader. :-)
As with brk() tracing, once you can identify those mappings that have grown (and not munmap()ed), they will show either:
- A memory growth code path
- A mapping memory leak code path
- Asynchronous allocator code path, that grew the application in response to diminishing free space
This should also be a low overhead approach for analyzing growth, due to the low rate of mmap() and munmap() calls. If these are called frequently, say, over ten thousand times per second, then the overhead can become significant. That would also be a sign of a poorly designed allocator or application.
4. Page Faults
brk() and mmap() tracing show virtual memory expansion. Physical memory is consumed later, when the memory is written to, causing page faults, and virtual to physical mappings to be initialized. This activity can happen in a different code path, and one that may (or may not) be more illuminating. It can be analyzed by tracing the page faults.
Page faults are a low frequency activity when compared to allocator tracing (malloc()). This means that the overhead should be negligible, and you may even be able to just use per-event dumping with perf. You can check the rate to be sure, eg, using perf on a production system:
# perf stat -e page-faults -I 1000 -a
#           time             counts unit events
     1.000257907                534      page-faults
     2.000581953                440      page-faults
     3.000886622                457      page-faults
     4.001184123                701      page-faults
     5.001474912                690      page-faults
     6.001793133                630      page-faults
     7.002094796                636      page-faults
     8.002401844                998      page-faults
[...]
That's several hundred page faults per second, for a system with 16 CPUs. This rate should be negligible to trace using perf and per-event tracing. If this were a one CPU system, or if the rate was over ten thousand per second, I'd use eBPF's kernel summaries to keep the overhead down.
Using perf and Flamegraph:
# perf record -e page-fault -a -g -- sleep 30
# perf script > out.stacks
[...copy out.stacks to a local system if desired...]
# ./stackcollapse-perf.pl < out.stacks | ./flamegraph.pl --color=mem \
    --title="Page Fault Flame Graph" --countname="pages" > out.svg
On newer Linux systems (4.8+) you can use Linux eBPF. Page faults can be dynamically traced via a kernel function, eg, handle_mm_fault(), or on 4.14+ kernels via the tracepoints t:exceptions:page_fault_user and t:exceptions:page_fault_kernel. I'll use the tracepoints here, and show the eBPF steps using my stackcount bcc program:
# /usr/share/bcc/tools/stackcount 't:exceptions:page_fault_*' > out.stacks
[...copy out.stacks to a local system if desired...]
# ./stackcollapse.pl < out.stacks | ./flamegraph.pl --color=mem \
    --title="Page Fault Flame Graph" --countname="pages" > out.svg
Here's an example flame graph, this time from a Java application (SVG, PNG):
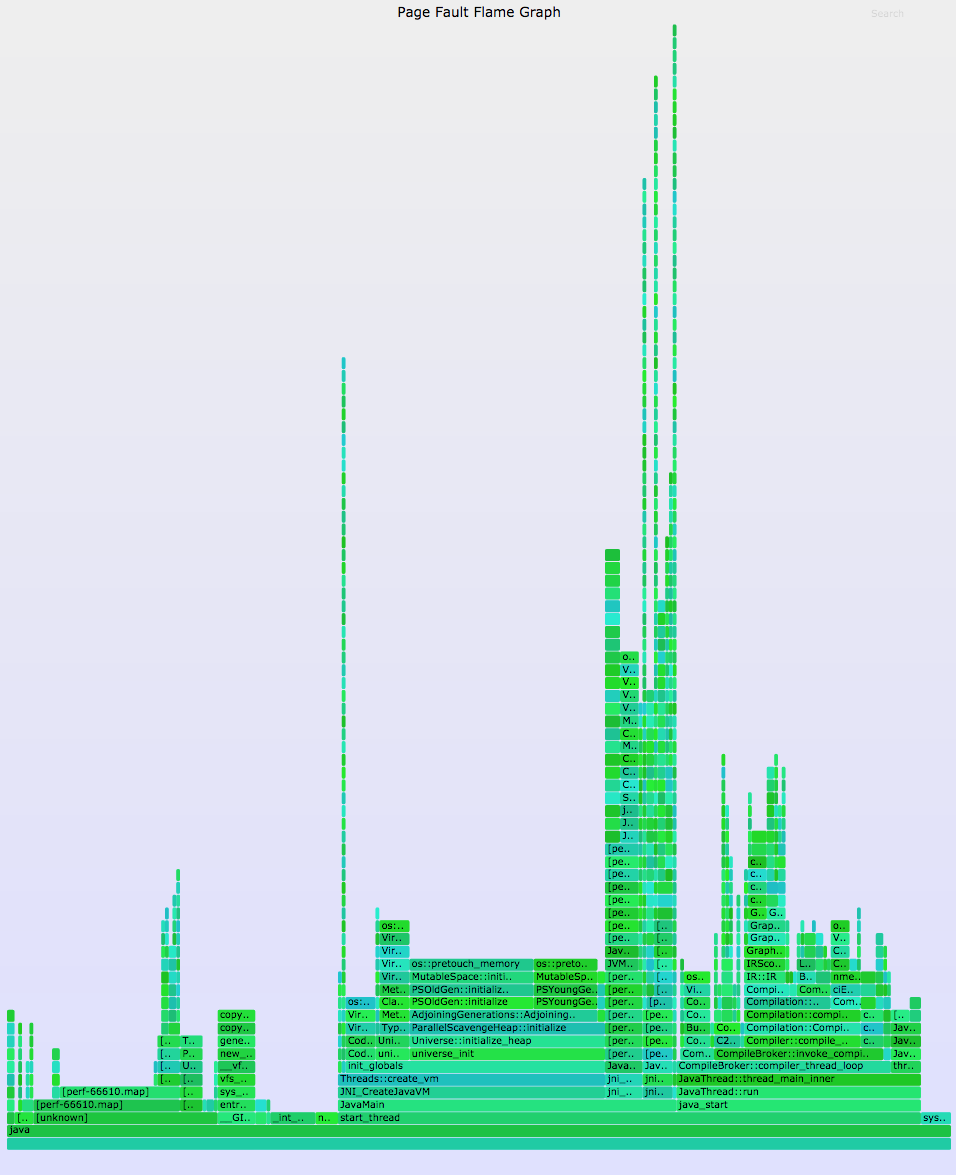
Some paths are not surprising, like Universe::initialize_heap to os::pretouch_memory. What I found interesting in this case was the compiler tower on the right, showing how much memory growth was due to the compilation of Java methods instead of just data.
The earlier techniques show the initial allocation code paths. Page fault tracing shows different code paths: those that are populating physical memory. They will be either:
- A memory growth code path
- A memory leak code path
Again, some sleuthing is required to tell them apart. If you are hunting leaks and have a similar application that isn't growing, then taking page fault flame graphs from each and then looking for the extra code paths can be a quick way to identify the difference. If you are developing applications, then collecting baselines each day should let you identify not only that you have an extra growing or leaking code path, but the day that it appeared, helping you track down the change.
The overhead of page fault tracing is likely a bit higher than brk() or mmap() tracing, but not by much: page faults should still be relatively infrequent, making this tracing approach near negligible. In practice, I find page faults a cheap, quick, and often effective way to diagnose memory growth and leaks. It won't explain everything, but is worth a try.
Other Operating Systems
- Solaris: DTrace can be used for memory tracing. Here is my original page on this: Solaris Memory Leak (and Growth) Flame Graphs
- FreeBSD: DTrace can be used as with Solaris. I'll share examples when I get a chance.
Summary
I've described four techniques for analyzing memory growth using dynamic tracing:
- Allocator function tracing
- brk() syscall tracing
- mmap() syscall tracing
- Page fault tracing
These can identify growth of either virtual or physical memory, and includes all reasons for growth including leaks. The brk(), mmap(), and page fault approaches can't separate out leaks directly, which require further analysis. However, their advantage is that their overhead should be very low, making them suitable for live production application analysis. Another advantage of these approaches is that tracing tools can usually be deployed without restarting the application.
Links
- My USENIX LISA 2013 plenary talk Blazing Performance with Flame Graphs introduced these four approaches to memory analysis, starting on slide 102 and at 56:22.
- My original Solaris Memory Flame Graphs page, which provides more examples (although a different OS).
- I summarized the four approaches to memory analysis in my 2016 ACMQ article The Flame Graph, which was also published as Communications of the ACM, Vol. 59 No. 6.
See the main Flame Graphs page for other types of flame graphs and links, and the flame graph software.